What you can do with MAPS.
Four phases. Four letters: M·A·P·S.
The product’s name is the method. And inside MAPS you’ll find the same four phases, with the same names.
It’s the method we worked with for years, before turning it into a platform.
MAPS changes with the work you’re doing.
A consumer brand doesn’t have the same questions as a B2B company. A startup doesn’t yet have the certainties of a mature company. A retailer needs to read the local area.
If you work in B2B
If you’re a startup
If you work across countries
When you create the project you tell MAPS which market you’re facing, and the research changes. Then it works in the background, in the market’s language, cross-checking different sources: when you come back, the first picture is ready.
Ask the project.
The MAPS chat works on what the project contains. You can decide which sources to use, narrow the answer down to a module, compare it with the past, switch lens or have several experts debate the same problem.
The chats come with the different parts of the work: the project, the market, the CRM data. You don’t have to remember which section a piece of information lives in.
The project isn’t a folder.
It’s something you can ask questions.
A new client comes in. A new market. A launch.
And you need to get up to speed, fast.
Information is usually scattered: purchased research, Google, screenshots of competitors, old presentations, internal data.
MAPS turns it into a picture of the market you can work on.
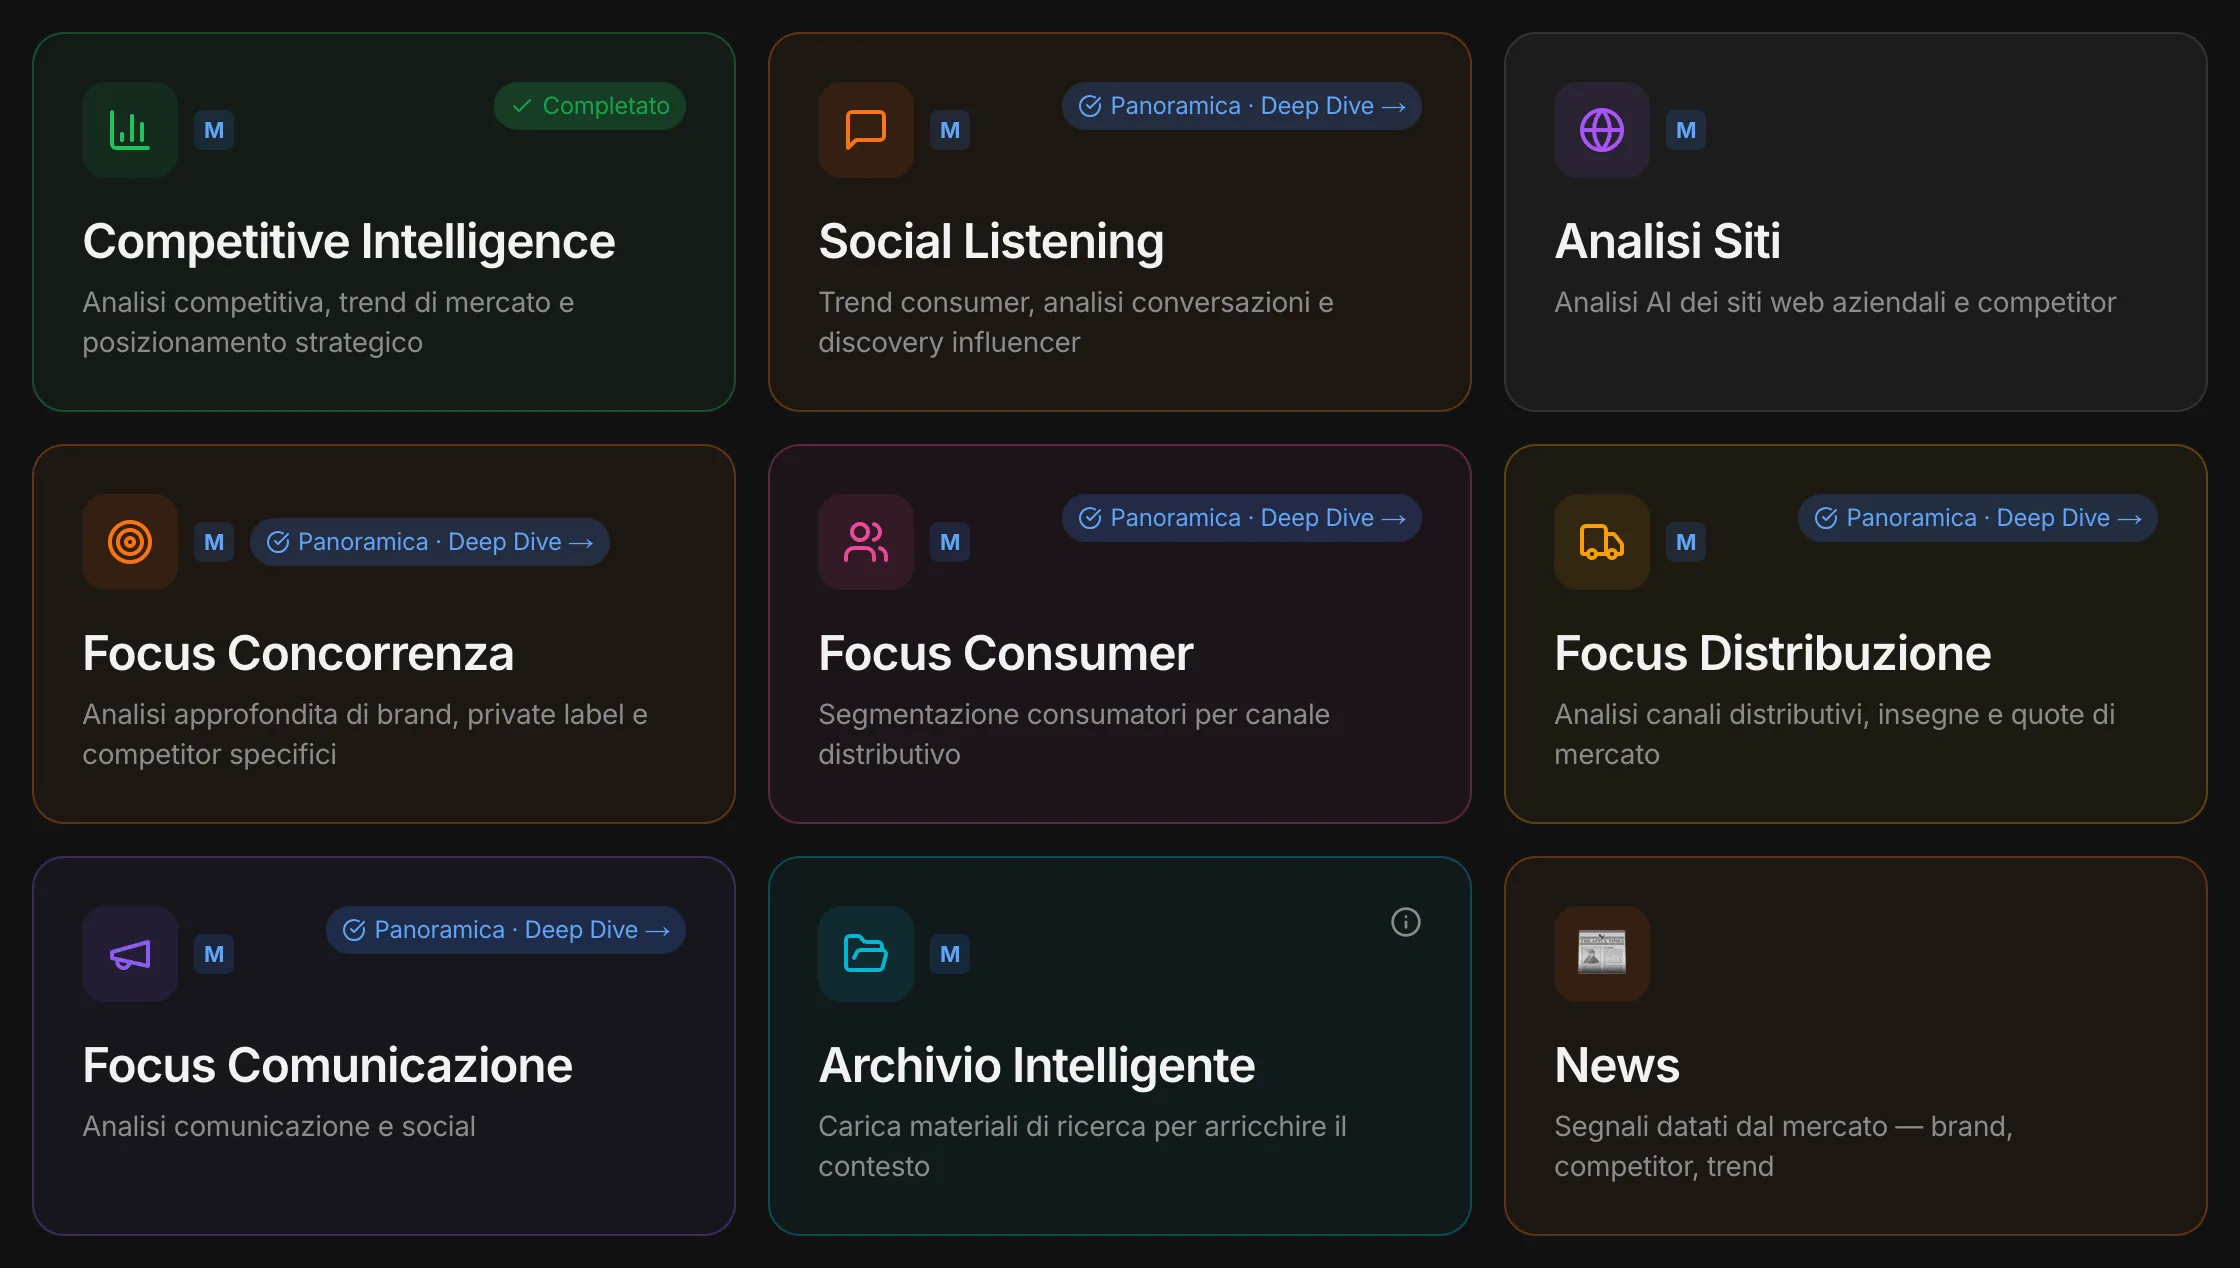
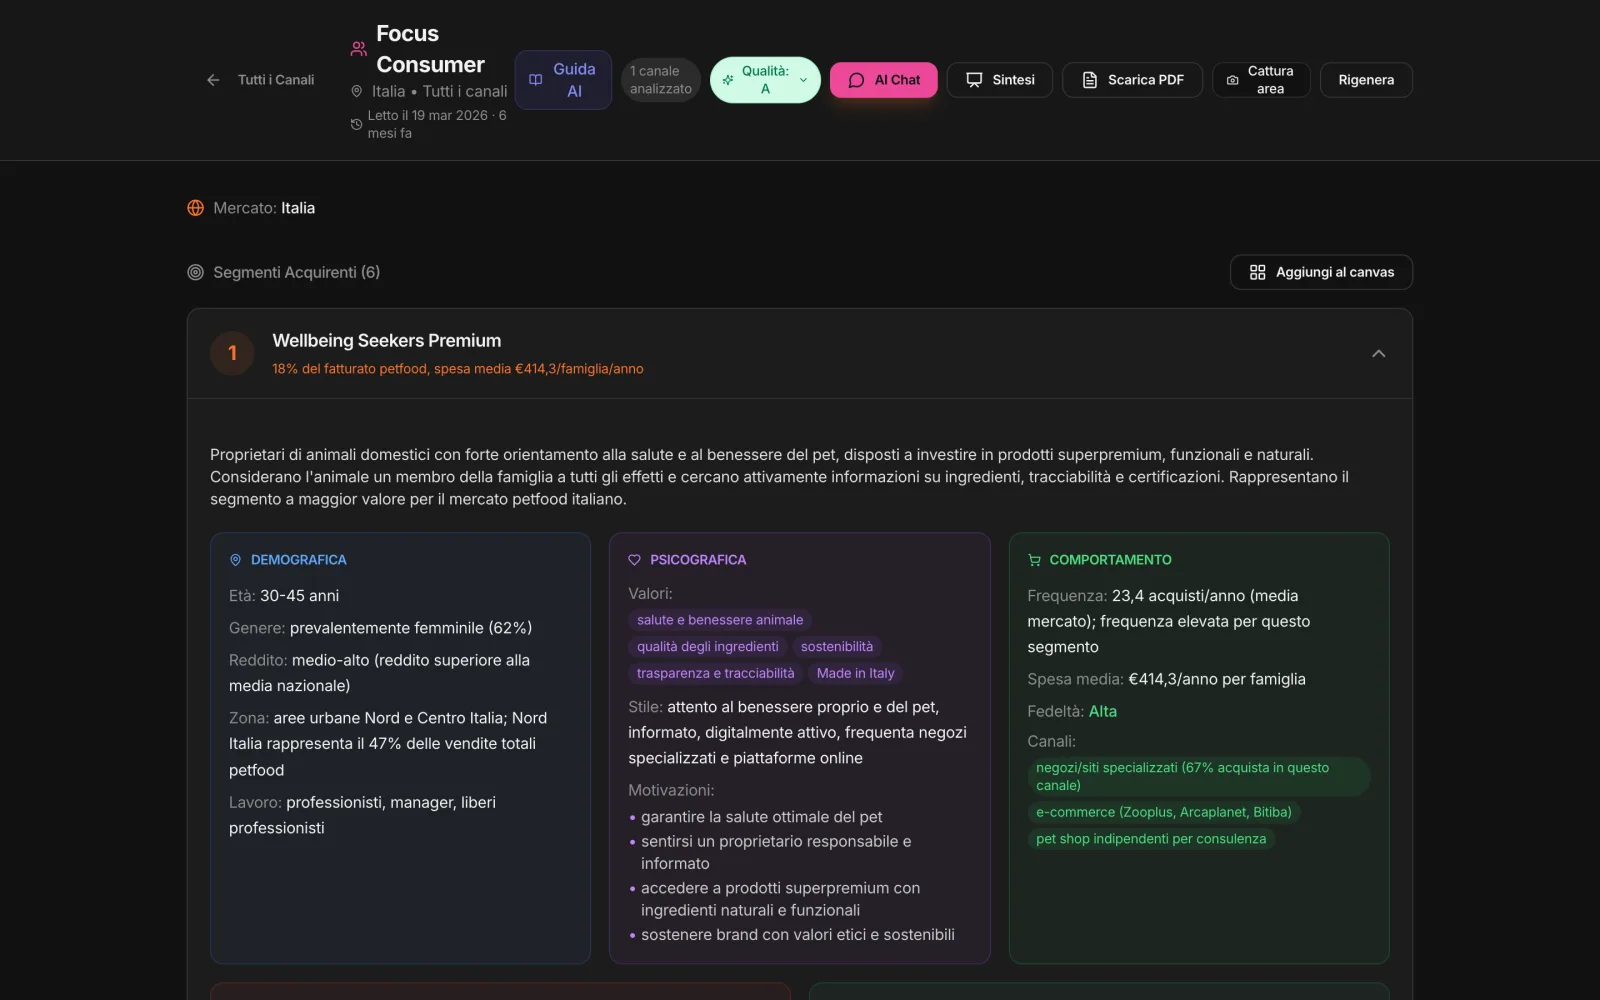
You can read size, growth, shares, prices and channels. Dig into a competitor. Understand who buys, what drives them and where they buy. See how brands communicate, which messages they’re using and how those have changed over time.
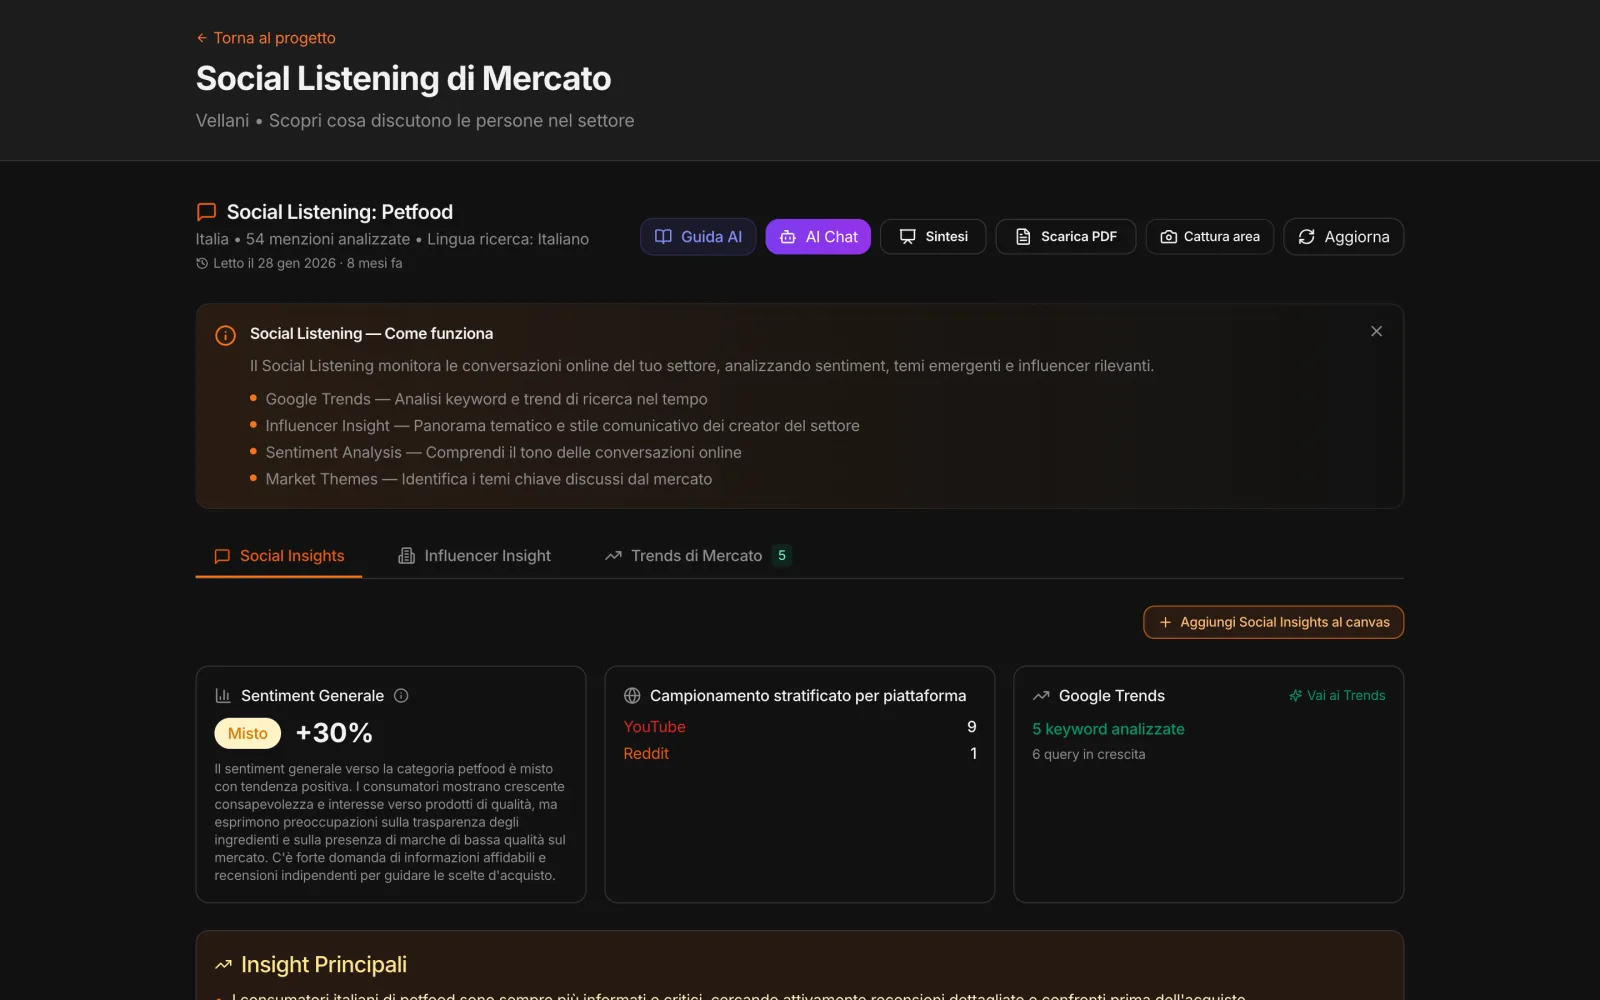
You can follow the conversations about the category, Google searches, influencers, the news and what they could mean for your brand.
And you can see how often the brand shows up when someone asks ChatGPT, Claude, Gemini or Perplexity.
Everything comes together in the Market Dashboard: the summary of the picture, the opportunities worth exploring and the data behind them.
Every number has its source. If it’s an estimate, it says so.
The data is there.
Now you have to decide what to do with it.
Strategy is often born in a blank document, while data, research and frameworks live somewhere else.
In MAPS, they all start from the same project.
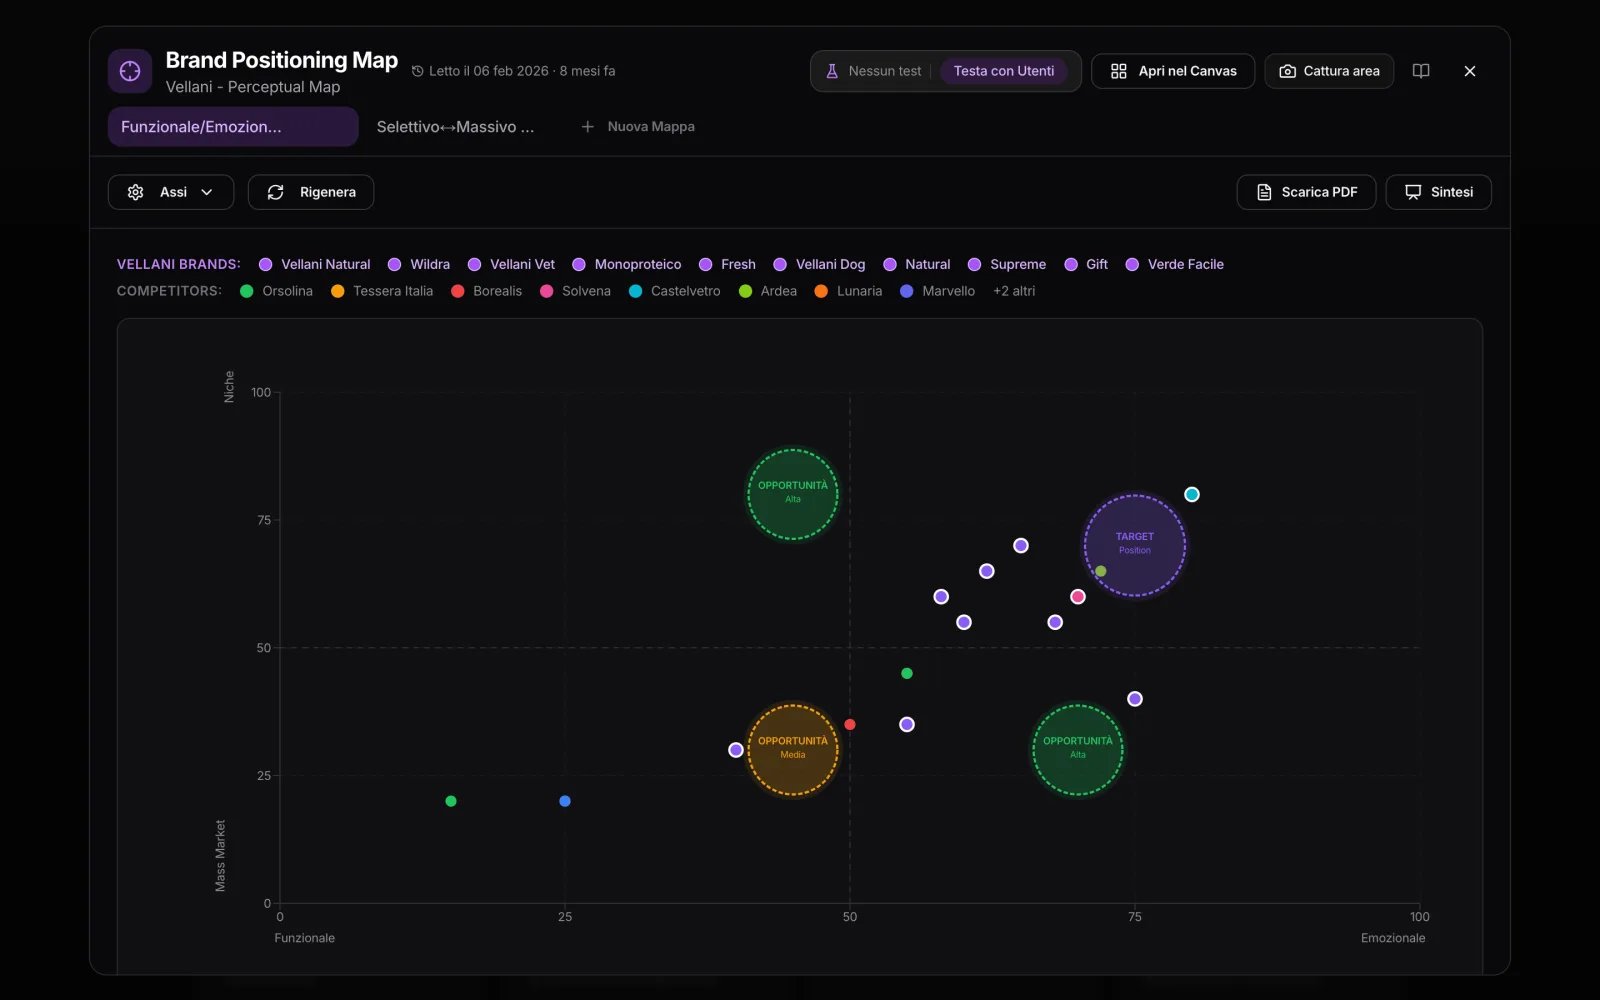
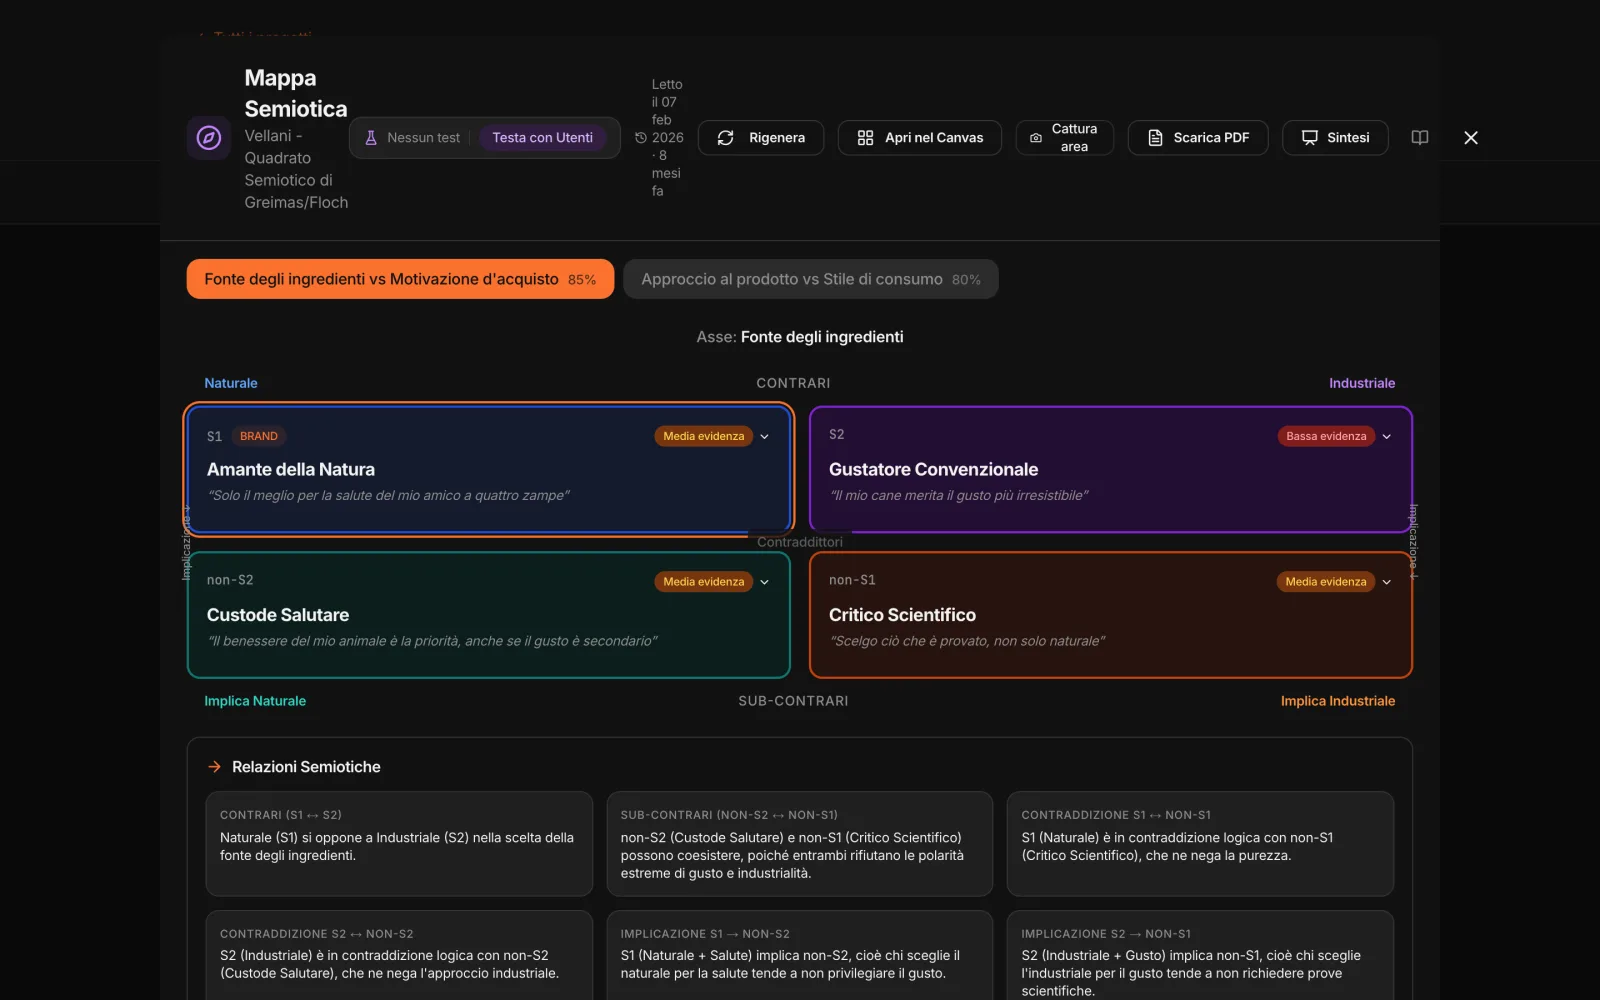
You can work on brand identity, value proposition and positioning. Build SWOTs and scenarios. Map customer journeys, empathy maps and buyer personas. Think through product, price, go-to-market, marketing mix and campaigns.
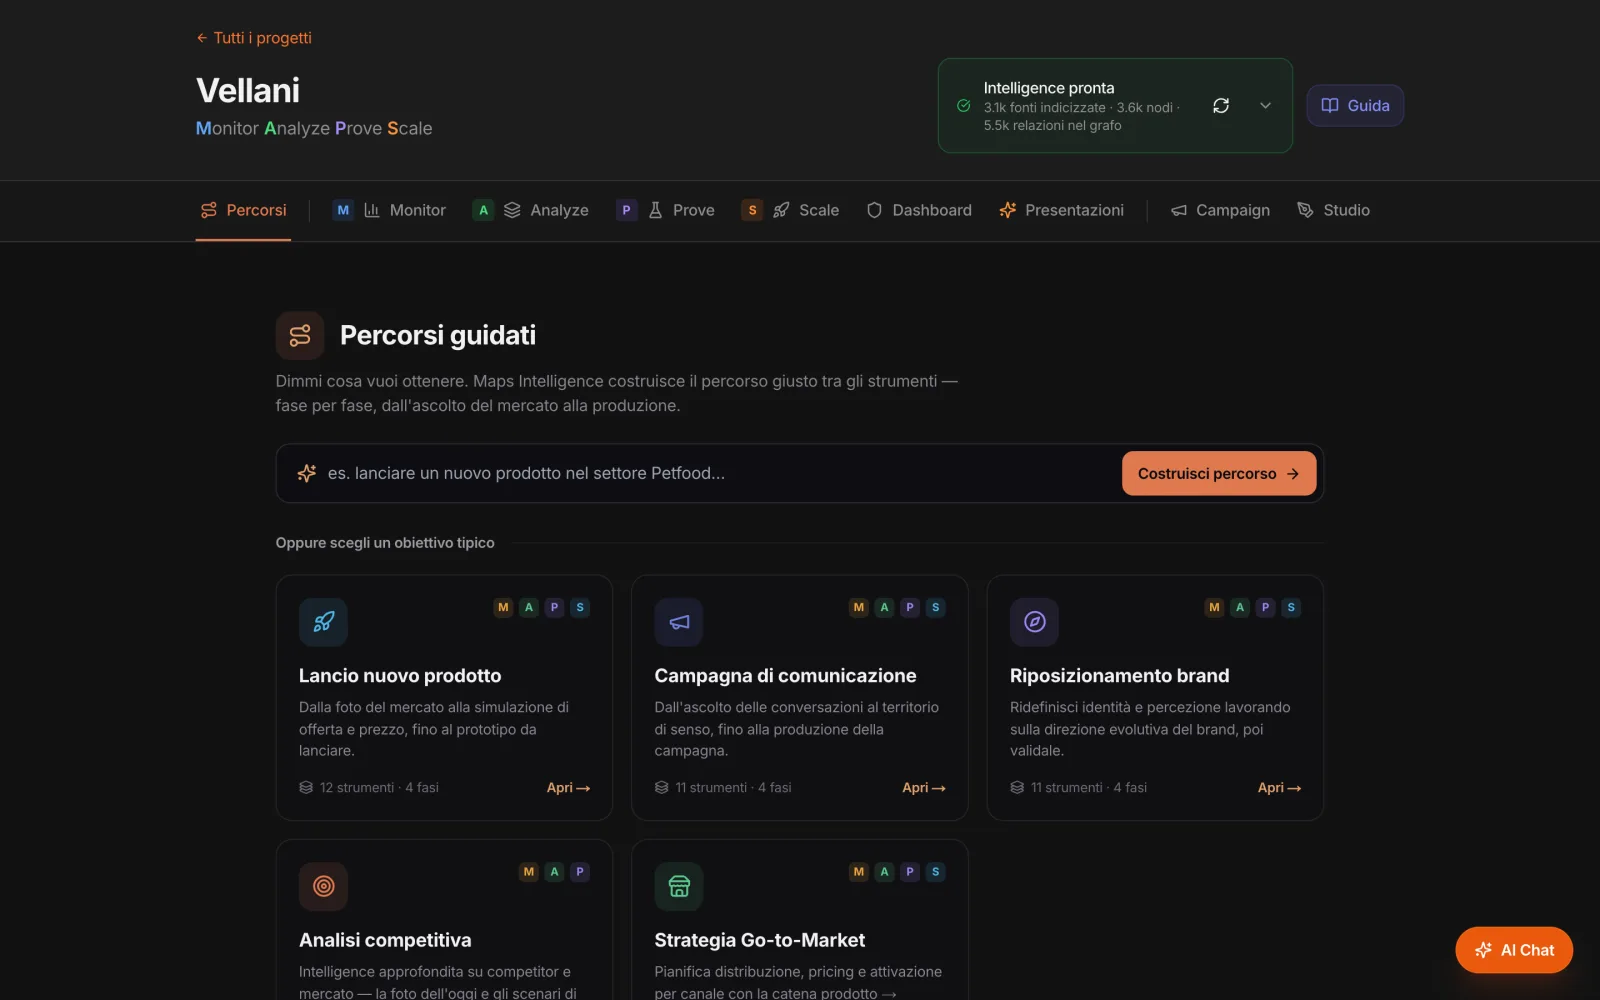
And you don’t necessarily need to know which tool to use. You can start from the goal:
MAPS lines up the right tools in sequence, phase by phase.
Or you can simply ask. The project chat answers using what it knows about your market and shows you where the information comes from.
And you can put your own reasoning to the test.
A choice can be examined through six different strategic lenses. A thesis can be argued out in a debate between experts before it reaches the meeting room.
The goal isn’t more output.
It’s getting to a choice you can defend.
Before you approve an idea,
find out where it could break.
A concept, a message or a campaign can be tested before the market becomes the first place you find out what doesn’t work.
MAPS creates synthetic users from market data, research and, when you have it, your customer data.
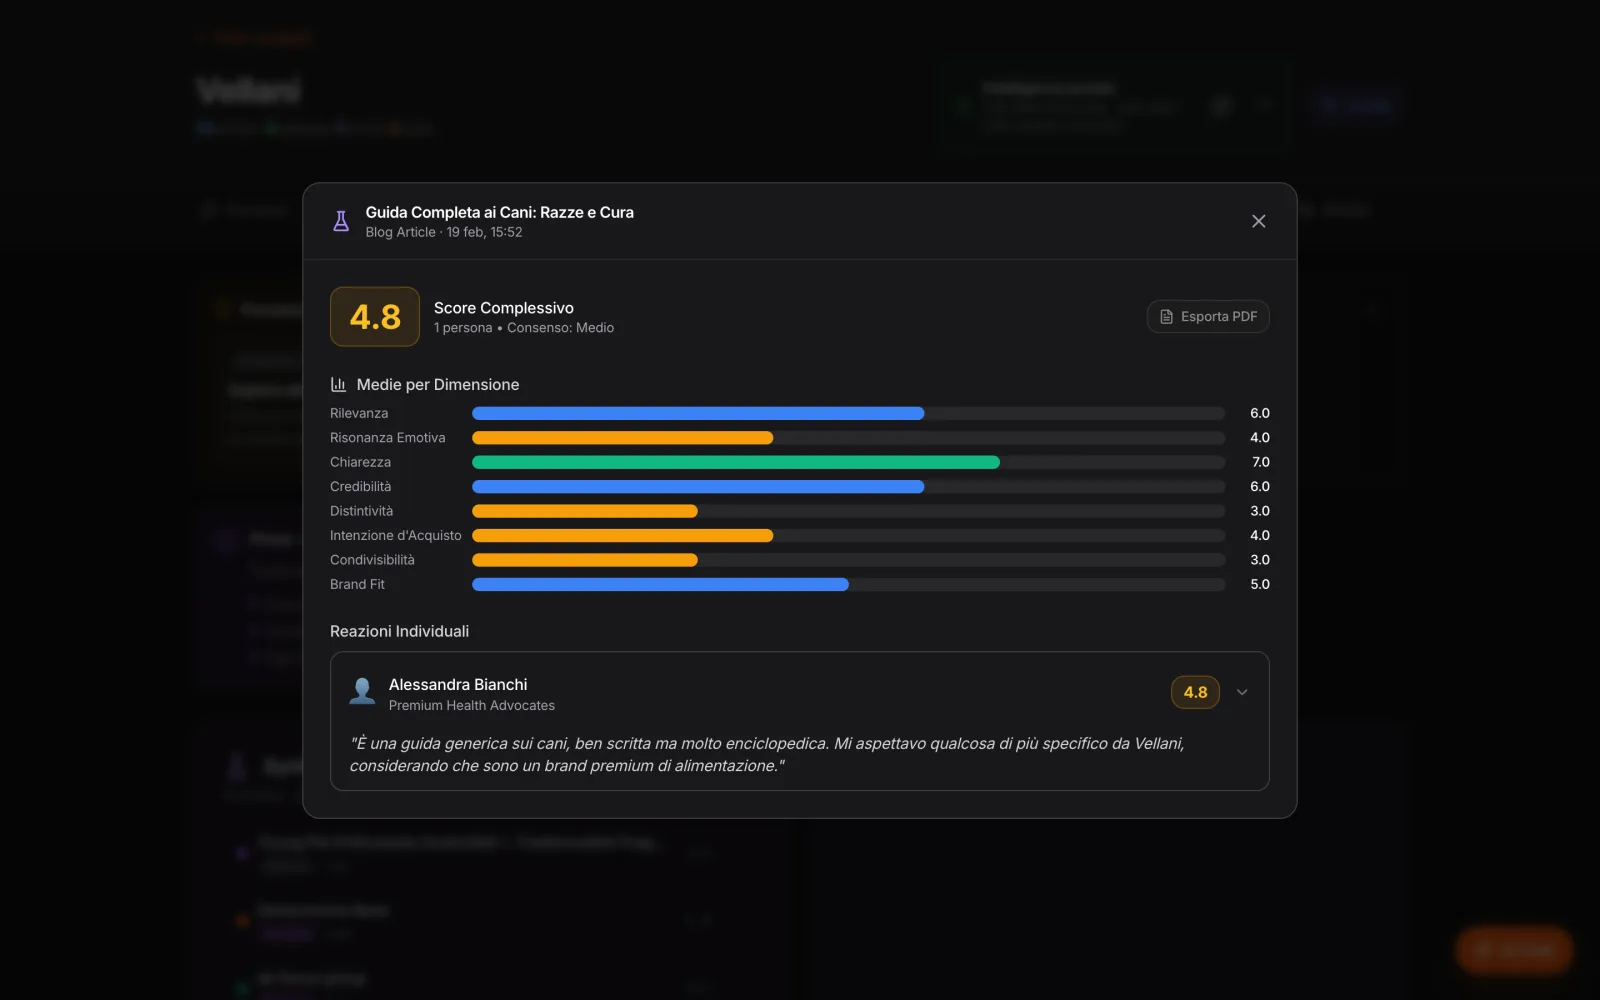
You can interview them one by one, showing a concept, a visual or a piece of copy. You can bring them together in a focus group. You can test content on 8 dimensions, such as relevance, clarity, credibility, distinctiveness and purchase intent, and read the reason behind every score.
You can also check how a text or an image is interpreted in a given culture and which elements deserve attention.
In B2B, the test changes too.
You can simulate the buying table: who decides, who pays, who influences and who can block.
You can practice a negotiation meeting after meeting and try different paths from the same starting point.
It’s a training ground, not a forecast.
For a startup, the table becomes an investment committee.
The strategy is set.
Now it has to become something concrete.
A strategy loses value when every new piece of content starts again from a brief rewritten by hand.
With MAPS, production starts from the project you’ve already built.
You can develop campaign ideas through 8 different creative methods, explore them in an idea lab and quickly turn them into a first prototype.
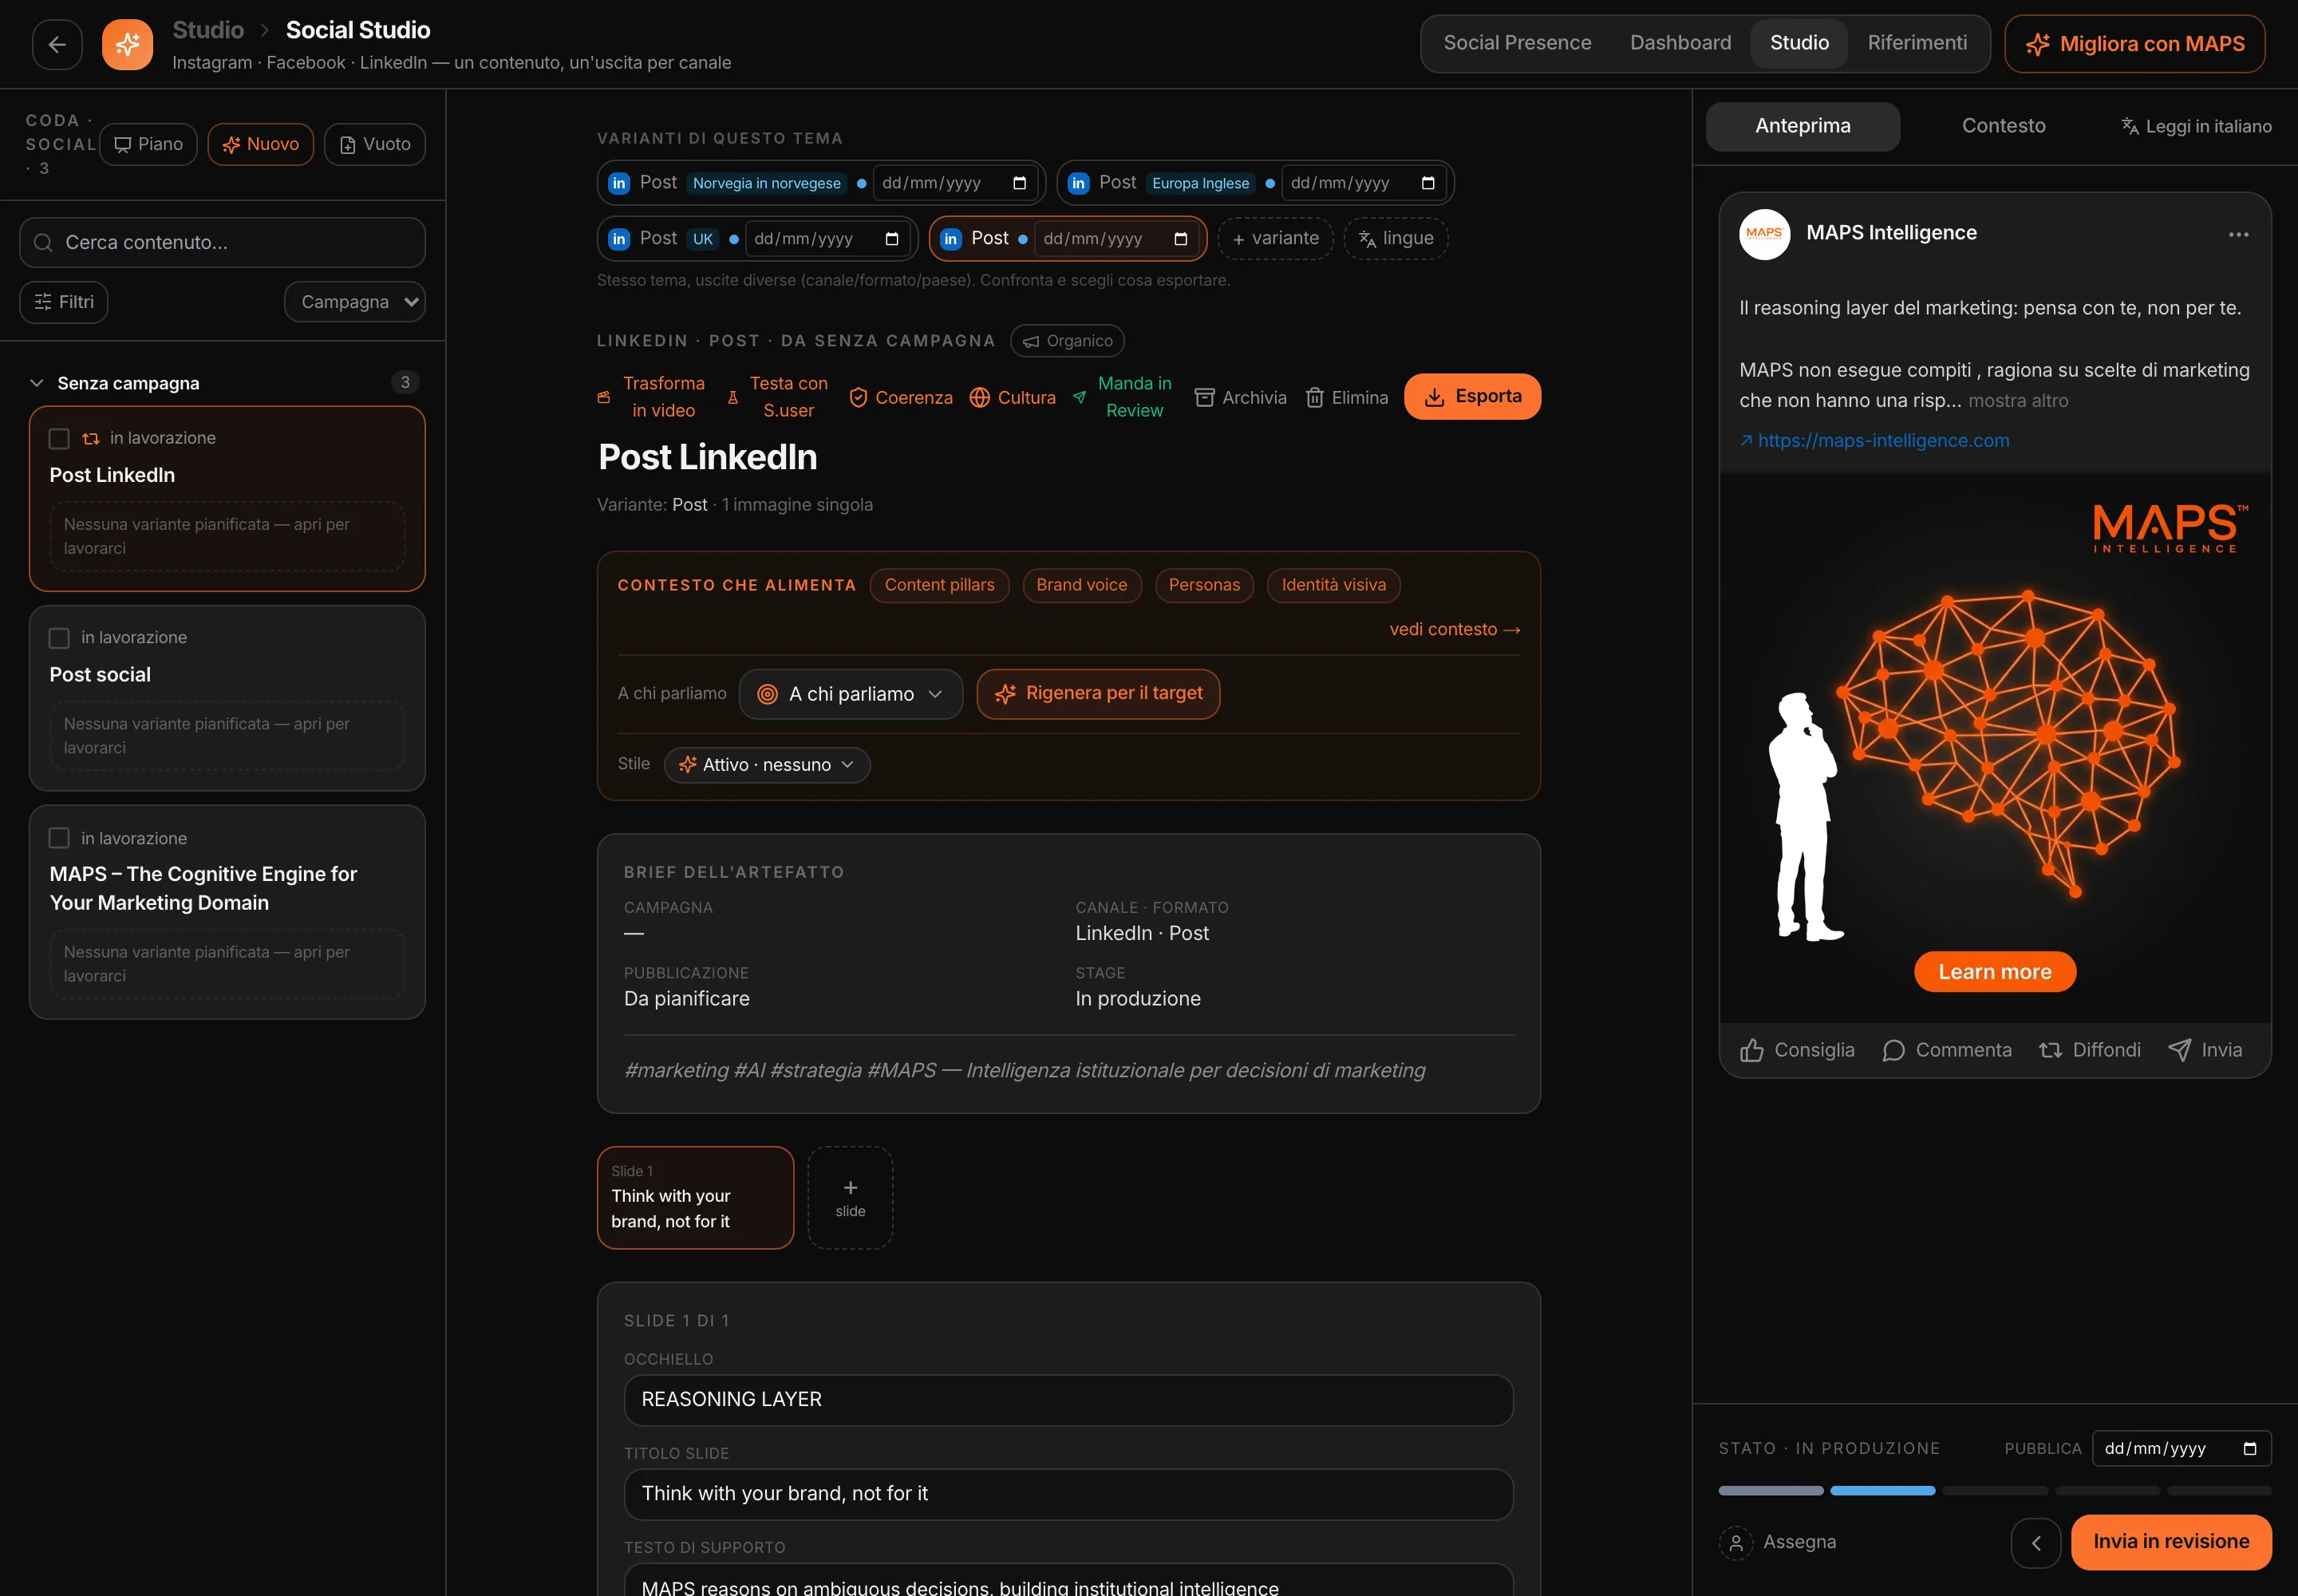
Then you move on to the Studios dedicated to Social, Email, Web, Video, Brand & Visual, Key Visual and content for Google and for AI assistants.
Every Studio starts from the same context: tone of voice, audience, themes, brand guidelines, visual identity, dos and don’ts.
You can create presentations from the analyses, even using your own template. Build campaigns, calendar and budget. Prepare an annual marketing plan.
And when something is ready, the client or the team can review, comment on and approve it in a dedicated portal, even without a MAPS account.
MAPS doesn’t publish or send anything on your behalf. Once the work is approved, you export it and take it into the tools you already use.
The project doesn’t forget
the previous step.
Every analysis, test, decision and piece of content goes into the same project. That’s why the next step doesn’t start from scratch.
And the knowledge stays queryable over time. Every reading is dated: you can compare today’s market with the one six months ago and reconstruct why a decision was made.
A space to think things through together.
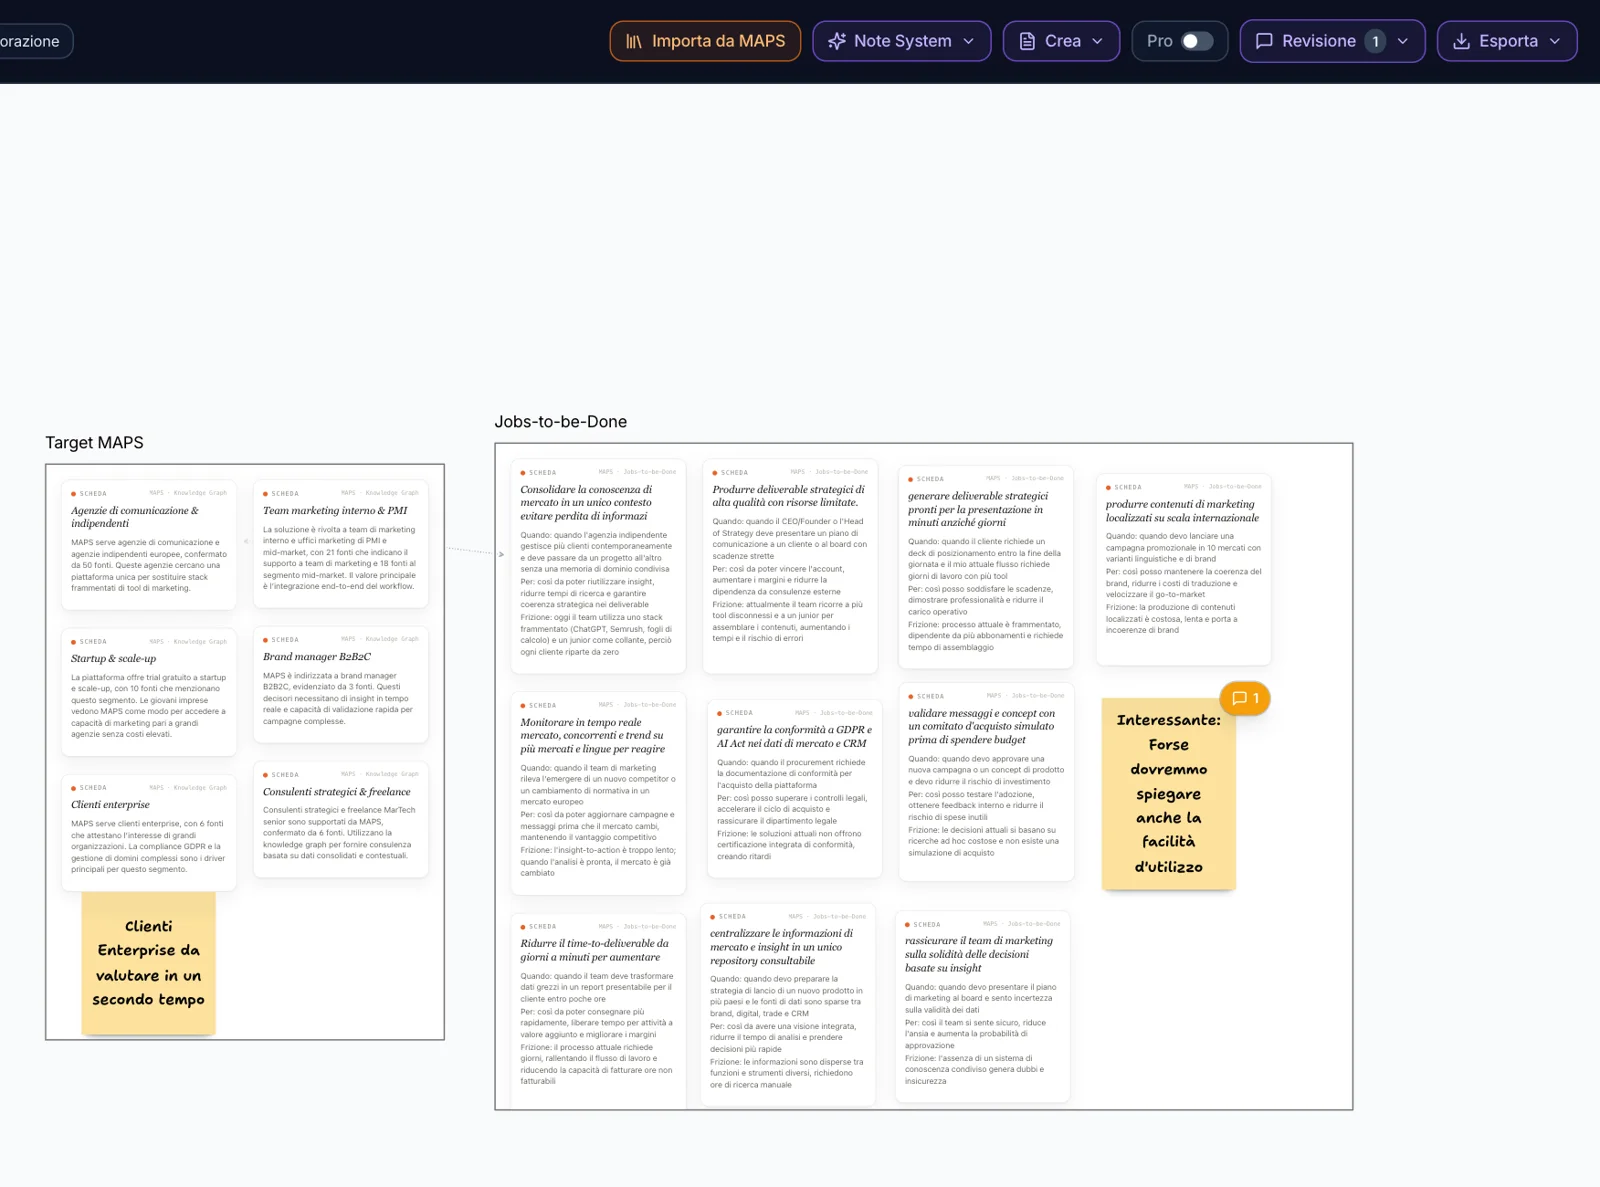
The Canvas is the space where analyses, ideas and decisions can meet.
You can bring in what you’ve discovered, connect elements, ask MAPS to develop a SWOT, a design thinking sprint or a campaign, and keep working together with the team or with a client invited as a guest.
Every block keeps its link to what it came from.
From click to customer.
Bring together exports from your media platforms, GA4 and CRM outcomes. MAPS rebuilds the chain from spend to click, from site to lead, from lead to customer — and helps you see where value is lost.
Don’t stop at cost per click when you can get to cost per customer.
The market outside. Your data inside.
CRM, orders, research, presentations, documents and ad spend can all come into the project. What MAPS observes outside the company is read together with what you already know inside.
Customer data is protected and is not used to train models.
Even the budget can become a conversation.
Import the annual plan. Check what MAPS has understood, spread the budget across the months, compare years and scenarios, write a hypothesis in plain words and see what it means for the numbers.
Multiple projects. The same workspace.
Tasks, projects, archive and shared styles live in the same workspace. You can search across different projects and keep working with the same context. And if part of your work already happens inside Claude or ChatGPT, MAPS can follow you there too.