
A score,
and the why in one sentence.
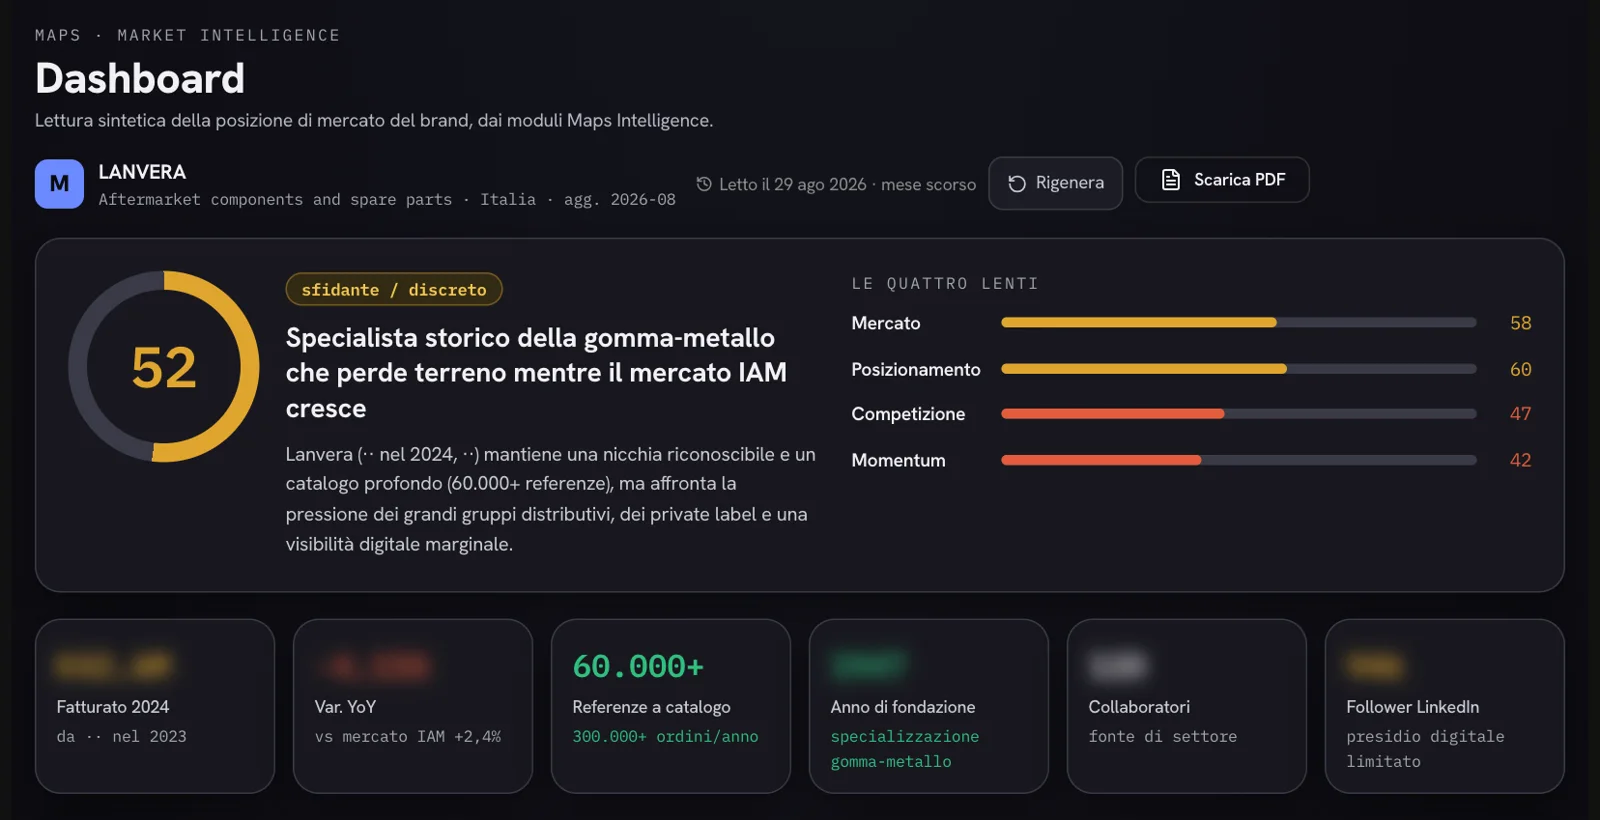
At the top, the summary: the overall score with its band — “challenger / fair,” “credible / strong” —, the headline that says where the brand stands, two lines that explain it. Next to it, the four lenses. Below, the key numbers, taken as they are from the modules.
Four questions,
with their answers.
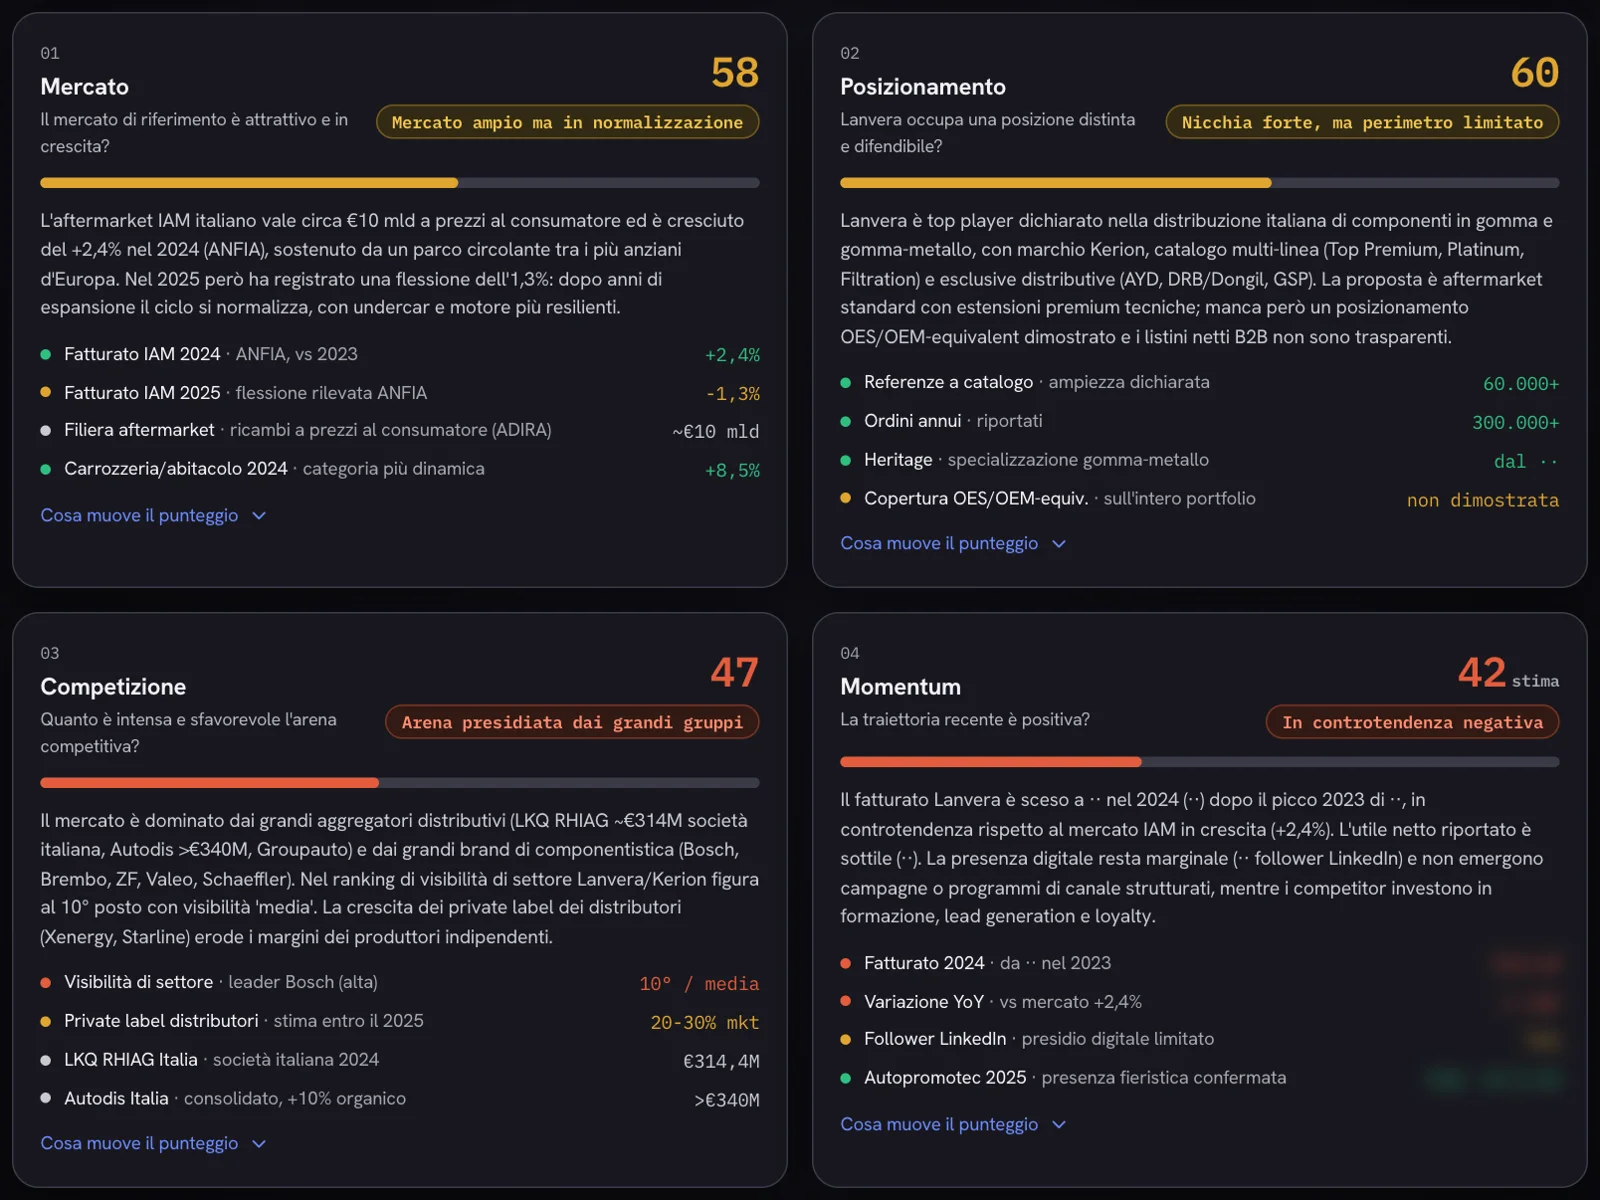
Each lens answers a question, with a score, a one-line verdict, the reasoning, the numbers that support it with their source, and “what moves the score.” Momentum is marked as an estimate: it’s a reading, not a data point.
Market
Is the target market attractive and growing?
Positioning
Does the brand hold a distinct, defensible position?
Competition
How intense, and how unfavorable, is the arena?
Momentum
Is the recent trajectory positive?
Where you stand,
compared with the others.
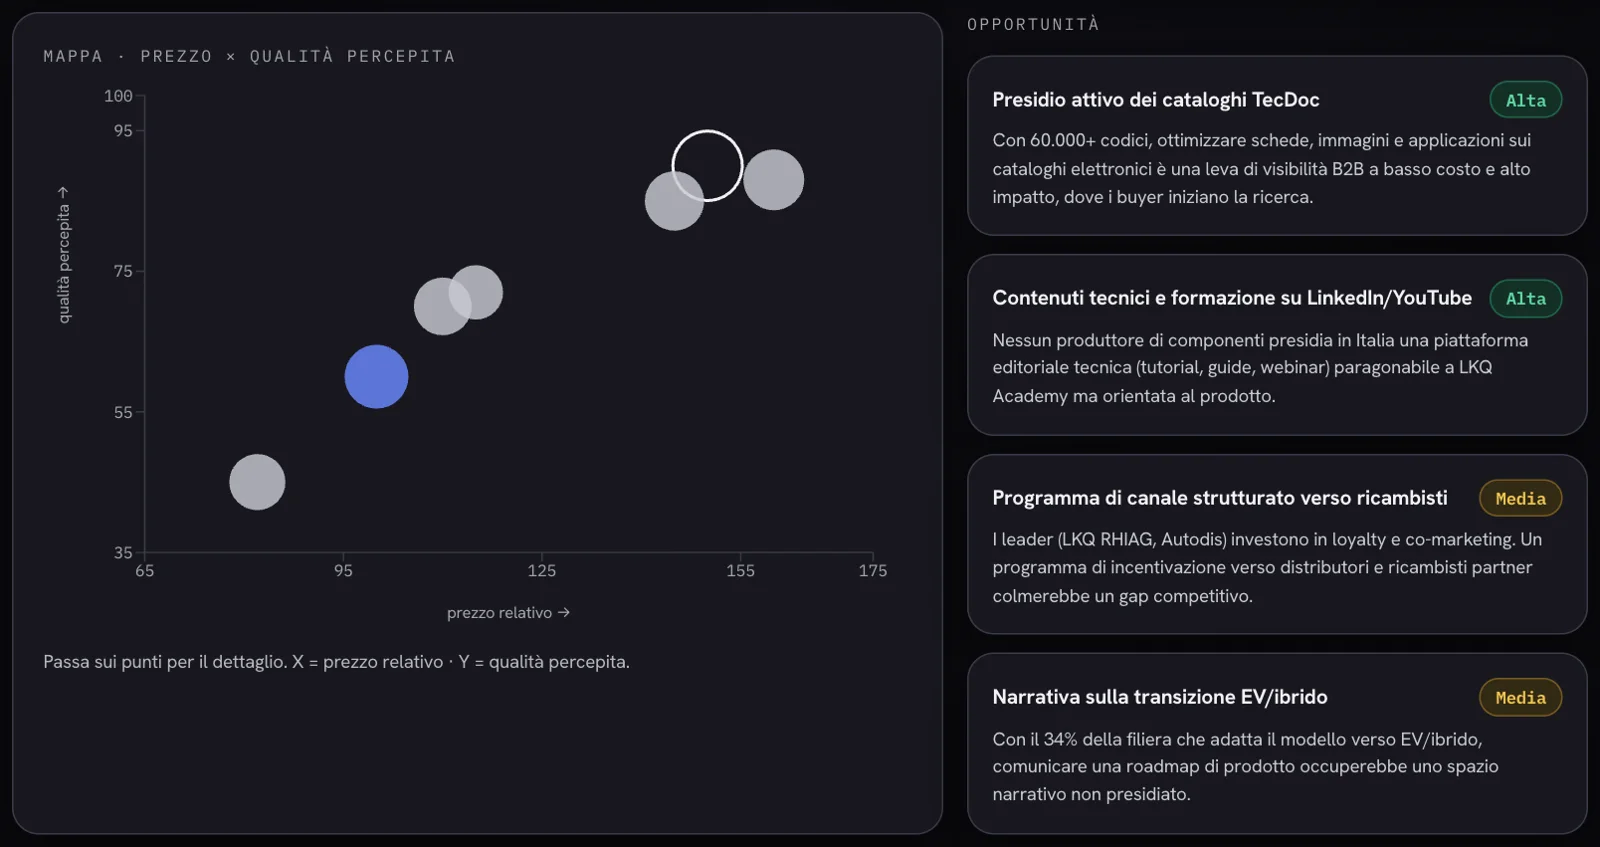
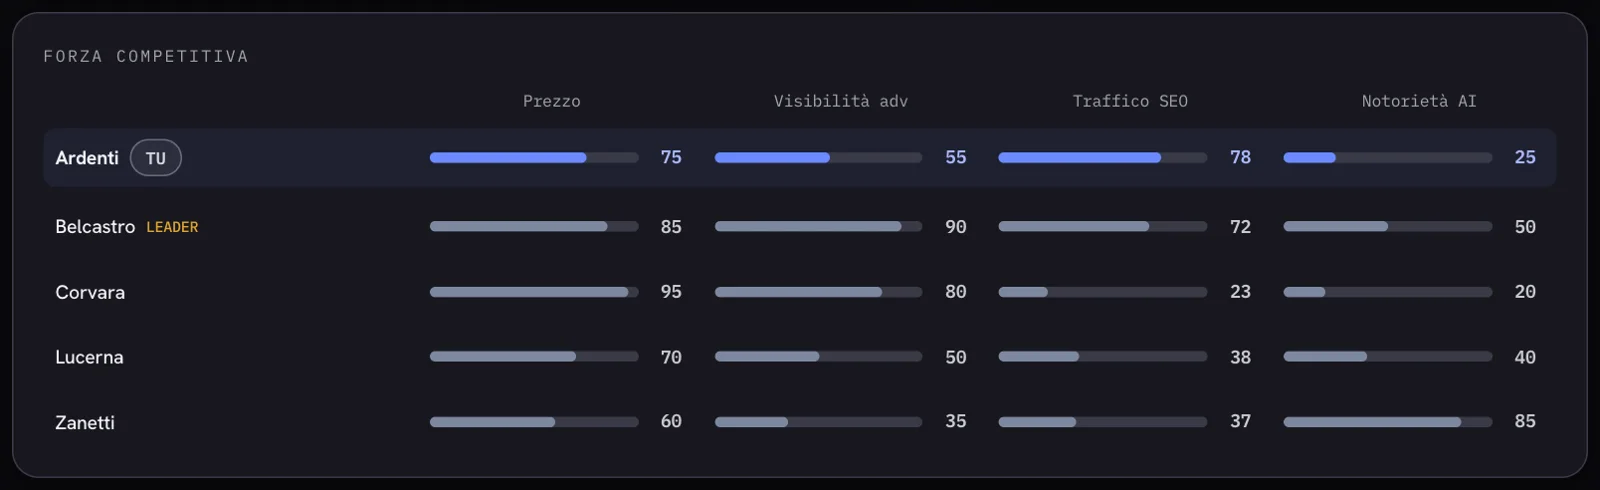
The price × perceived quality map places the brand among its competitors; next to it, the opportunities with their priority. Below, competitive strength: price, advertising visibility, organic traffic, awareness in AI assistants, brand by brand.
Customers, communication,
distribution.
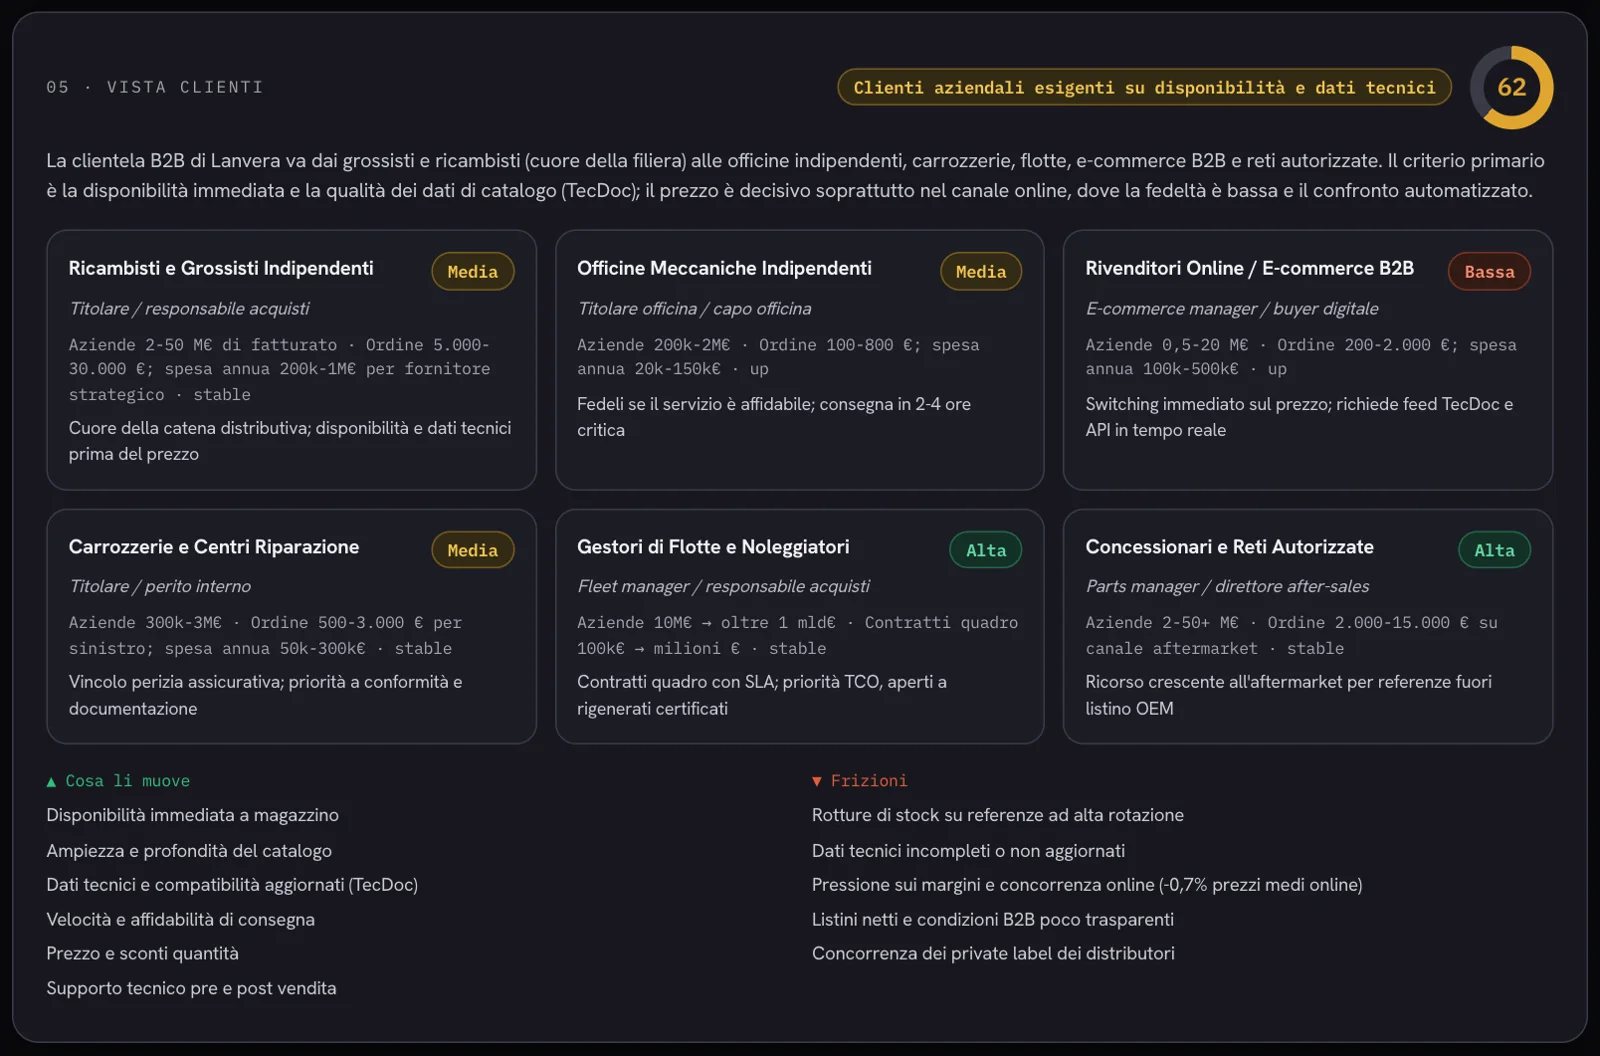
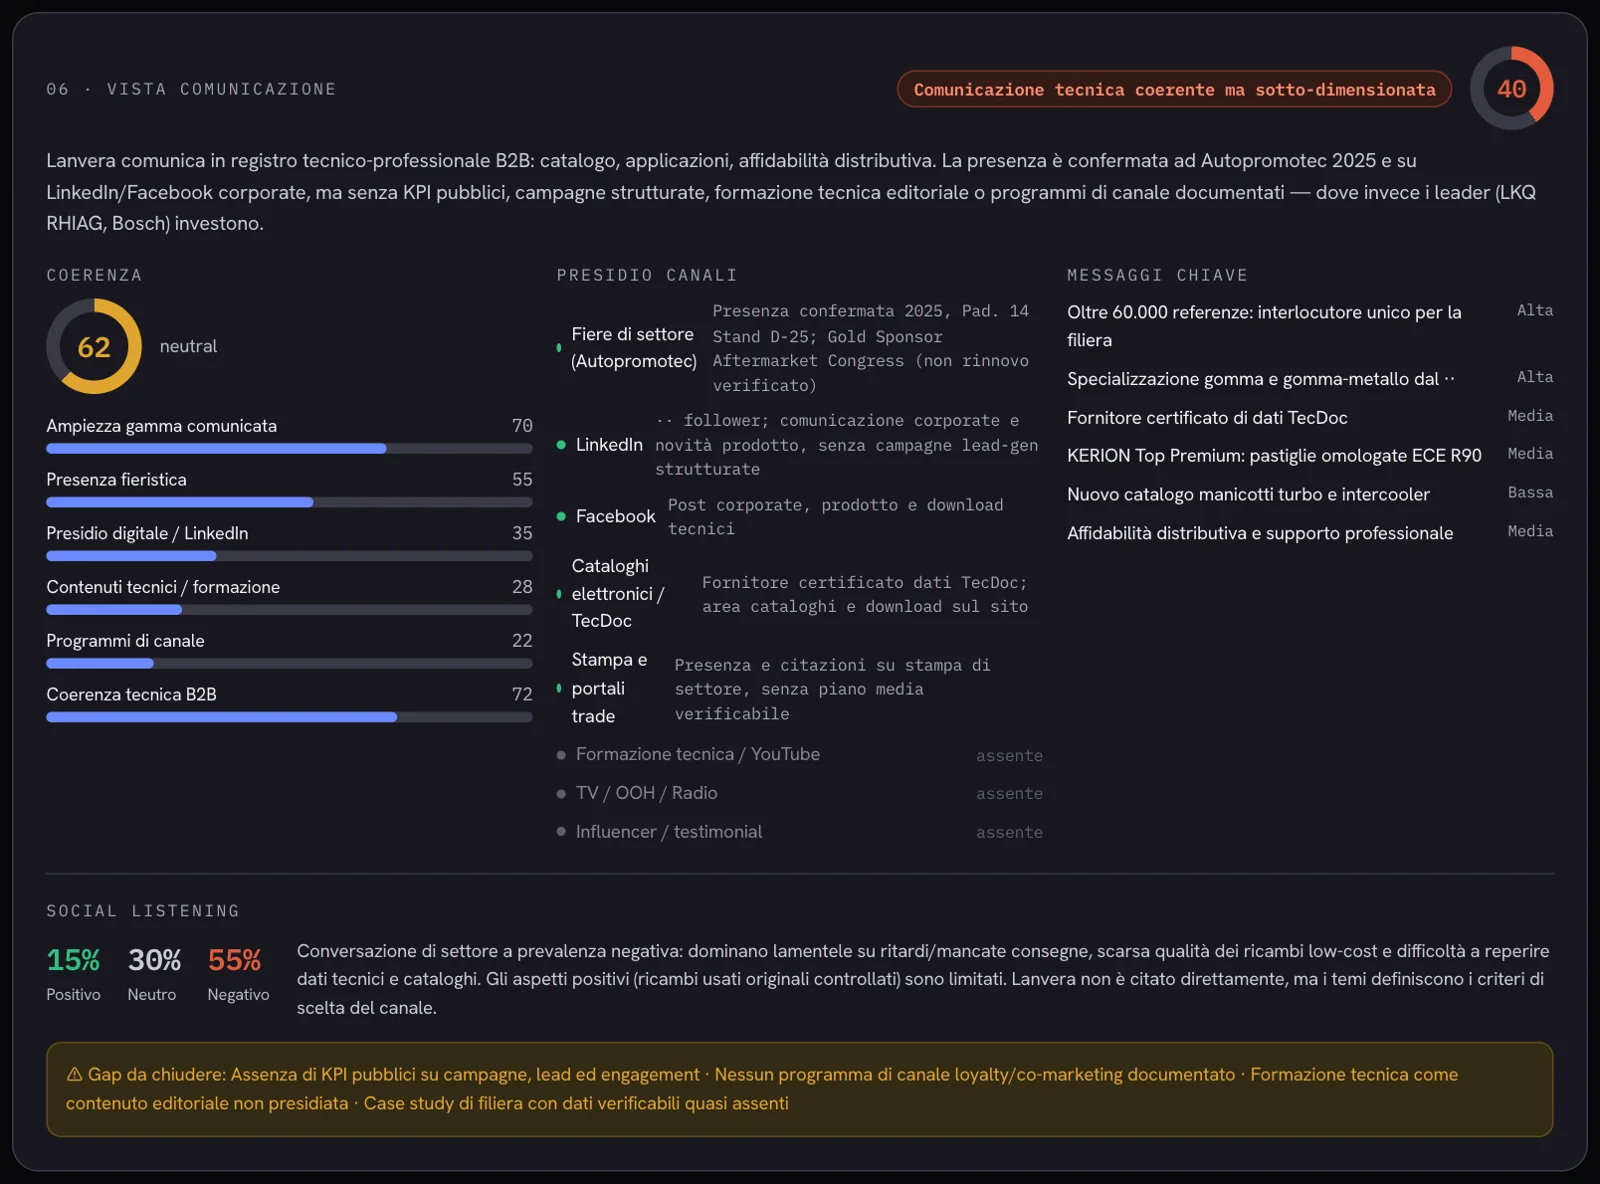
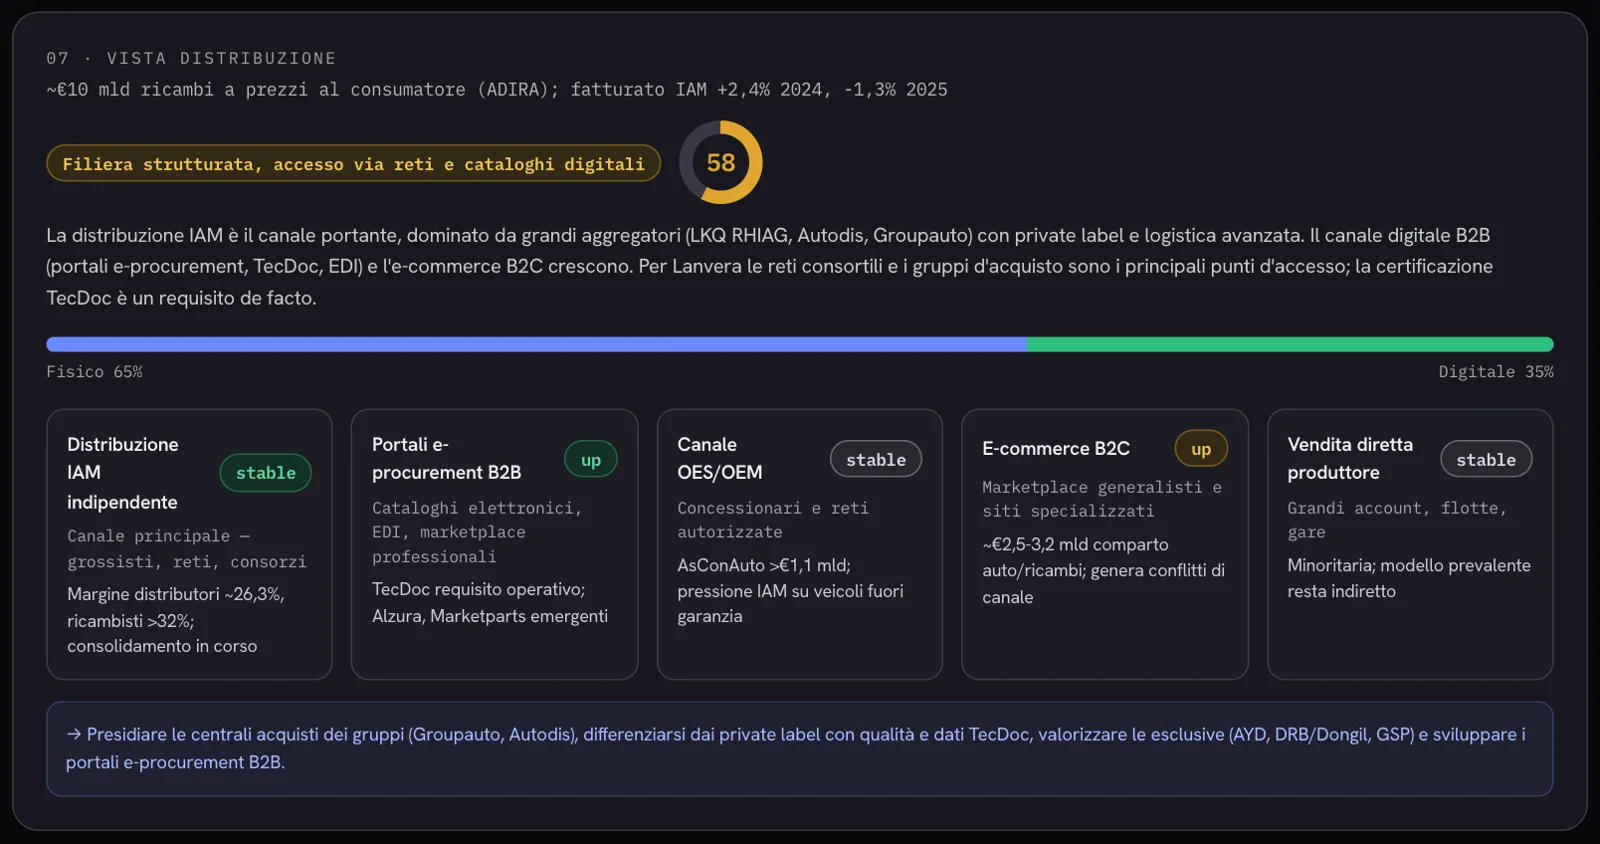
Then the views by area, each with its score and its verdict: who the customers are — in B2B, the companies, with role, size and what makes them choose —, what drives them and what holds them back; how the brand communicates and on which channels; how it goes to market.
On Google, yes.
And in AI assistants?
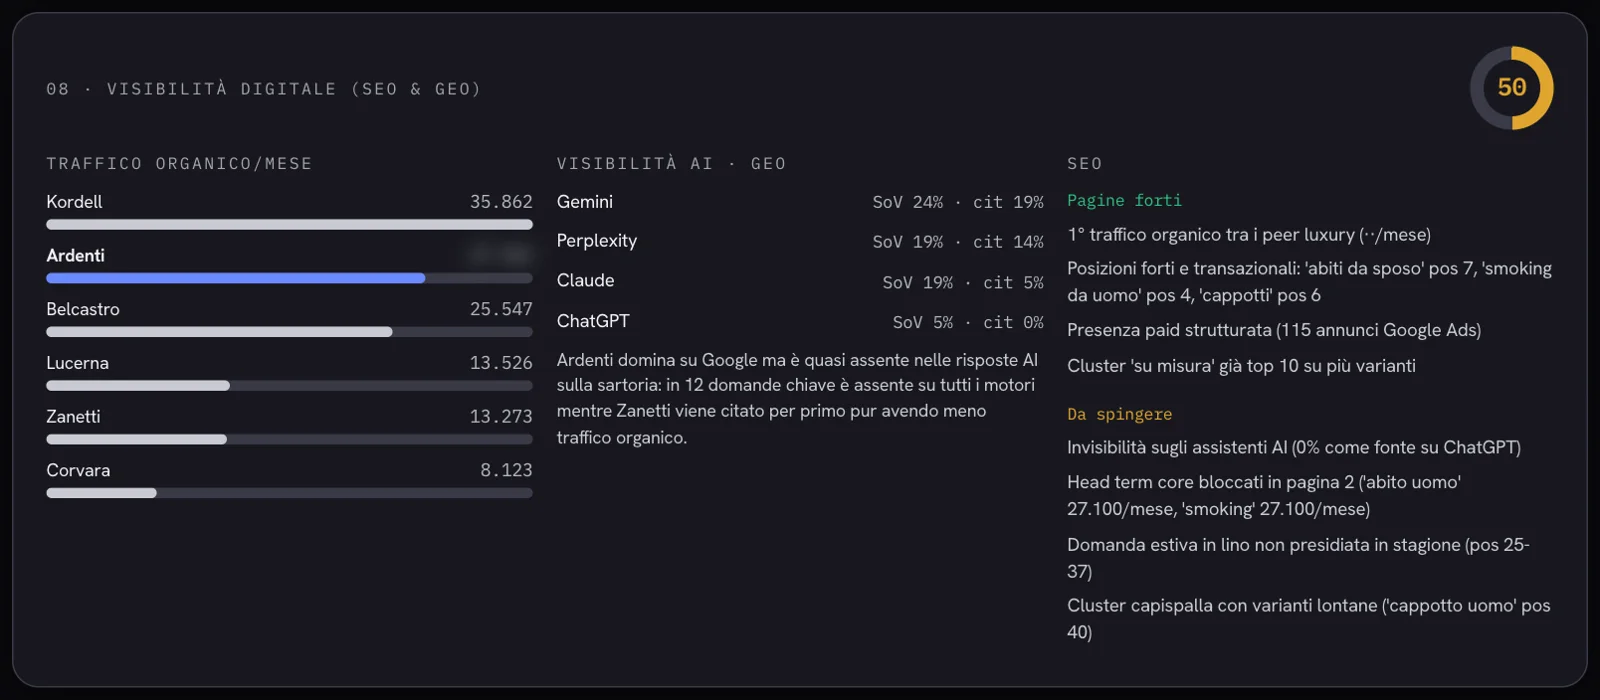
The last view brings two worlds together: the organic traffic of the brand and its competitors, and visibility in the answers of Gemini, Perplexity, Claude and ChatGPT — how much the brand is talked about (share of voice) and how often its site is cited as a source. Alongside, the strong pages and what needs a push.
In the example the reading is clear-cut: the brand is first for organic traffic among luxury tailors — only a digital-native competitor beats it —, but almost absent from AI answers — zero citations as a source on ChatGPT —, while a competitor with less traffic is cited first. It’s the kind of gap you don’t see by looking at Google alone.
Where the numbers come from
From the project’s SEO/GEO & Content Studio: traffic, rankings, ads, and the category questions put to the four AI assistants.
The detail
The questions, the answers, who gets cited and how to work on it live in the Studio, which we’ll cover in full with the Studios.
If data is missing,
it says so.
The Dashboard doesn’t fill in the gaps: the numbers come from the modules as they are, and where a module isn’t there, the section says so and takes you to generate it — like the spare-parts manufacturer’s digital visibility, still to be analyzed.

Regenerate
As the project grows — new research, new modules — the reading updates. Every version stays, with its date.
Download PDF
The Dashboard as a clean document, laid out to be printed or sent.
Next steps
Above the Dashboard, suggestions for what to do next to complete the picture.