Write the goal.
The AI chooses where to start.
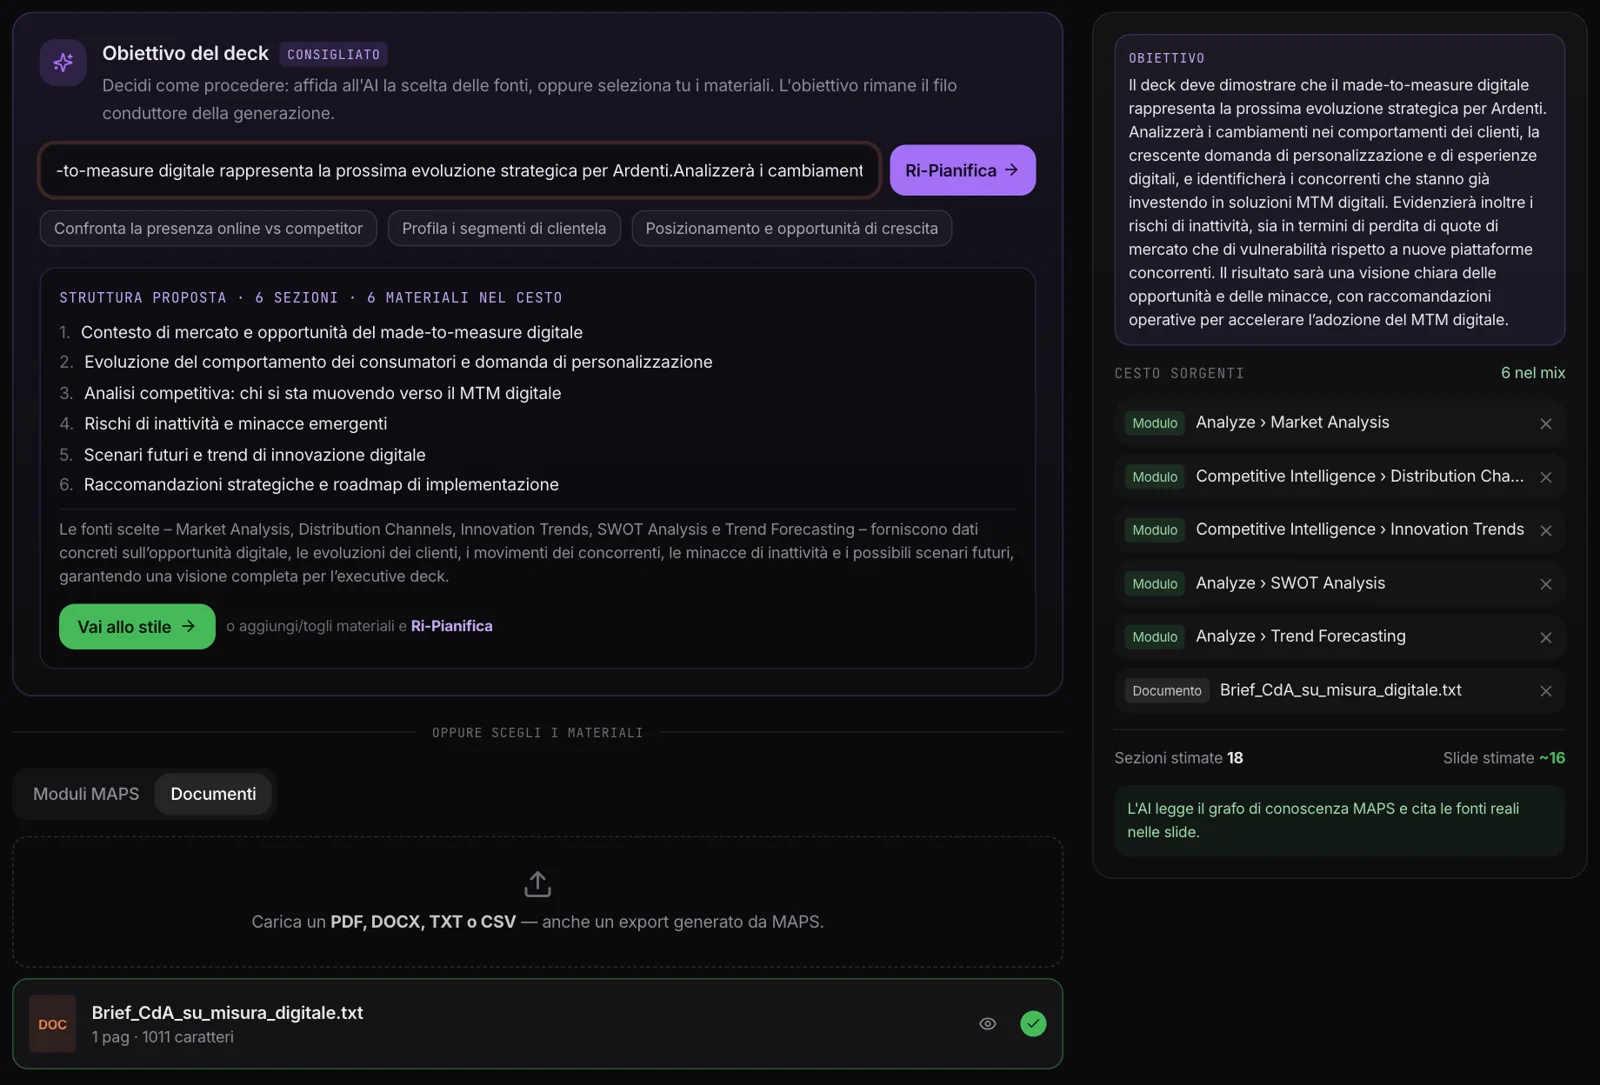
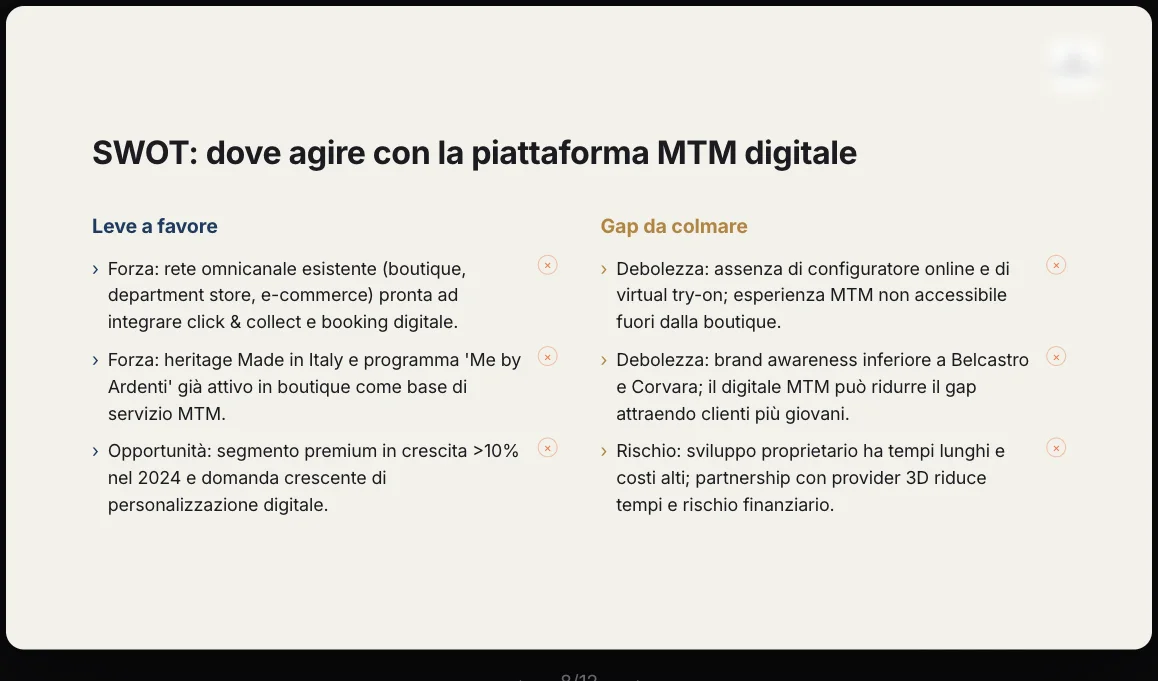
“Why digital made-to-measure is the next move: how customers are changing, which competitors are moving, what we risk by standing still.” With Plan, MAPS rewrites the goal into a sharper brief, picks the relevant modules — here market analysis, channels, trends, the SWOT — and proposes the deck’s structure, section by section, explaining why.
Not convinced? Add or remove material and plan again. Or do it all by hand: you choose the modules and sub-sources, down to a single channel or a single section of an analysis.
Your brief,
inside MAPS’s research.
In the Documents tab you upload PDFs, Word files, text or spreadsheets: the client’s brief, the meeting minutes, an external report. They go into the basket next to the MAPS modules, and the presentation uses them together.
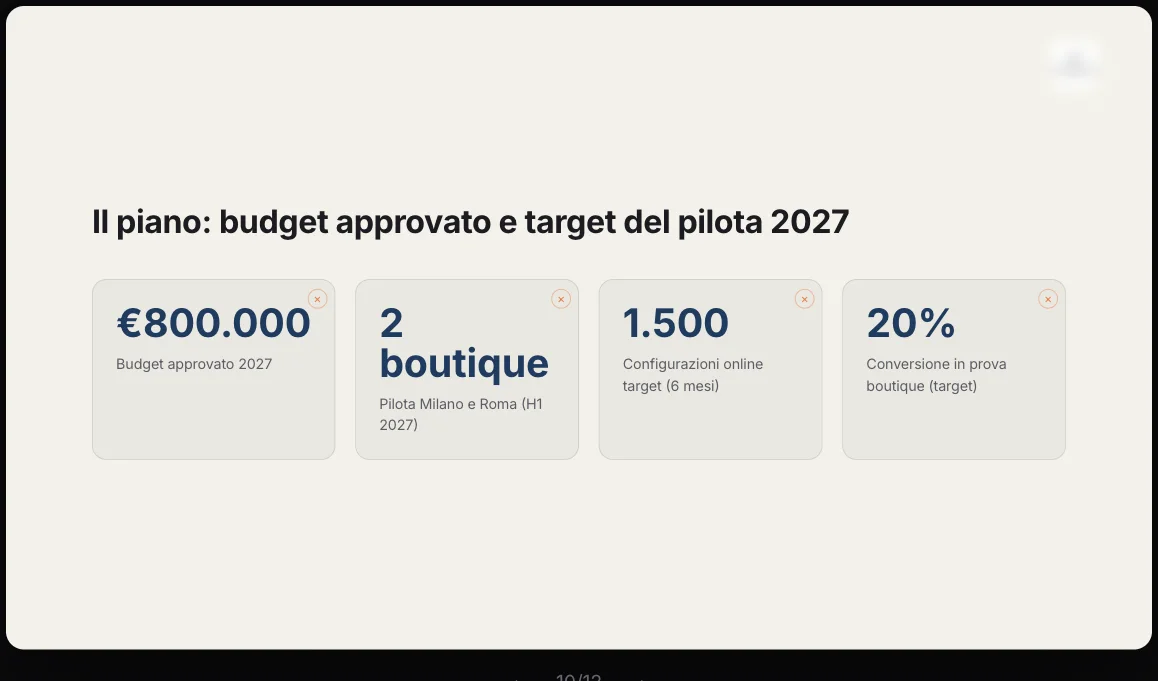
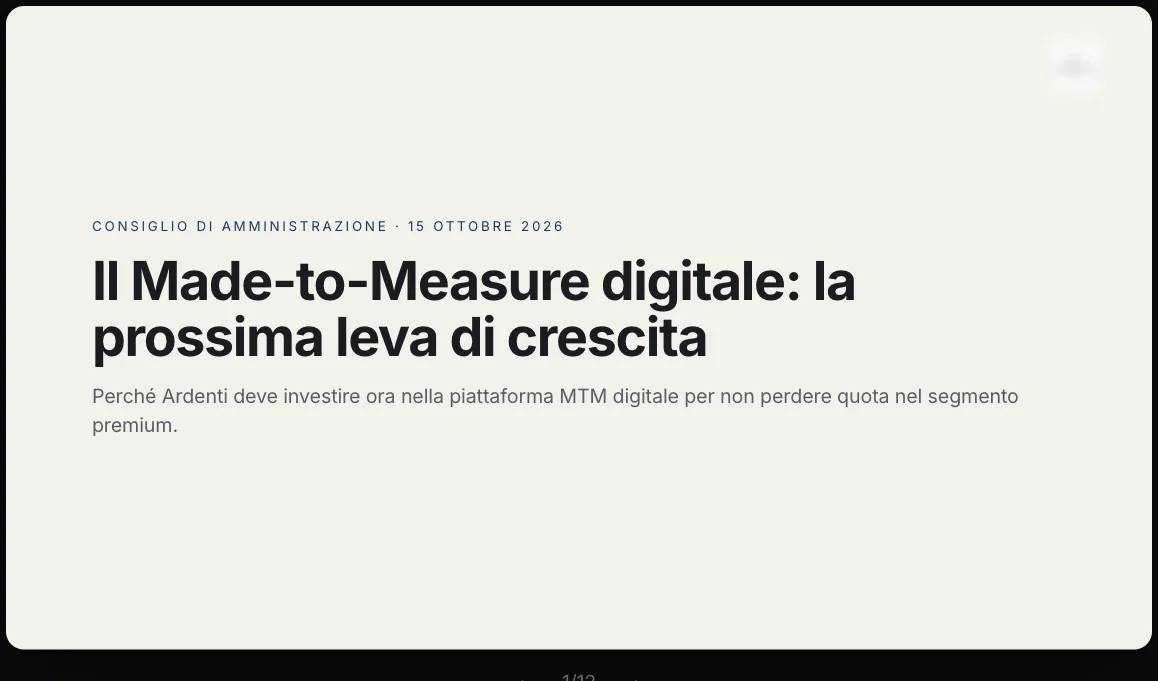
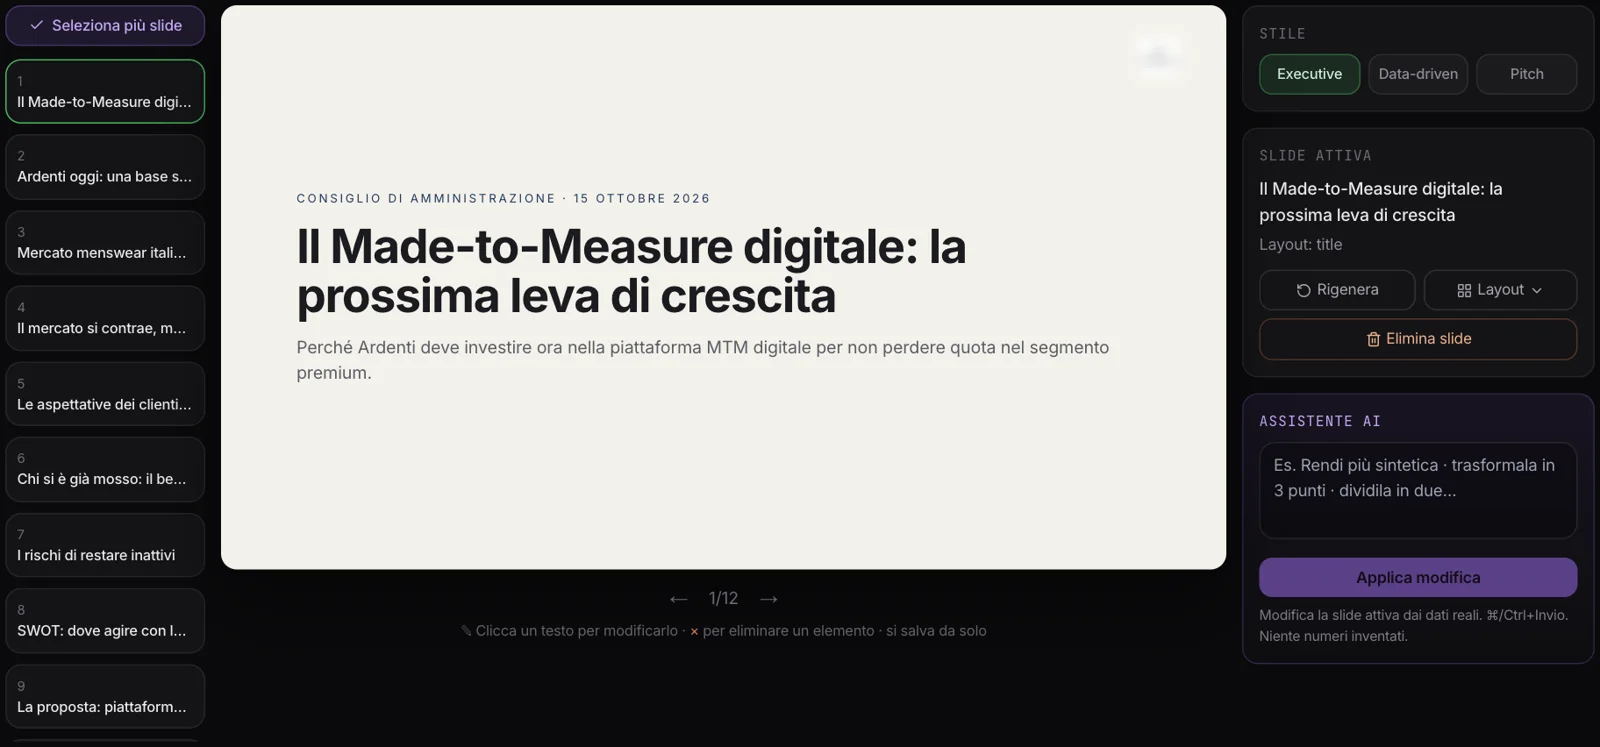
In the example we uploaded the brief for the Board: meeting date, approved budget, a pilot in two boutiques, numeric targets. The cover mentions the October 15 Board meeting and the plan slide shows the budget and targets — the research data comes from MAPS, the client’s data from their document.
Your brand,
not ours.
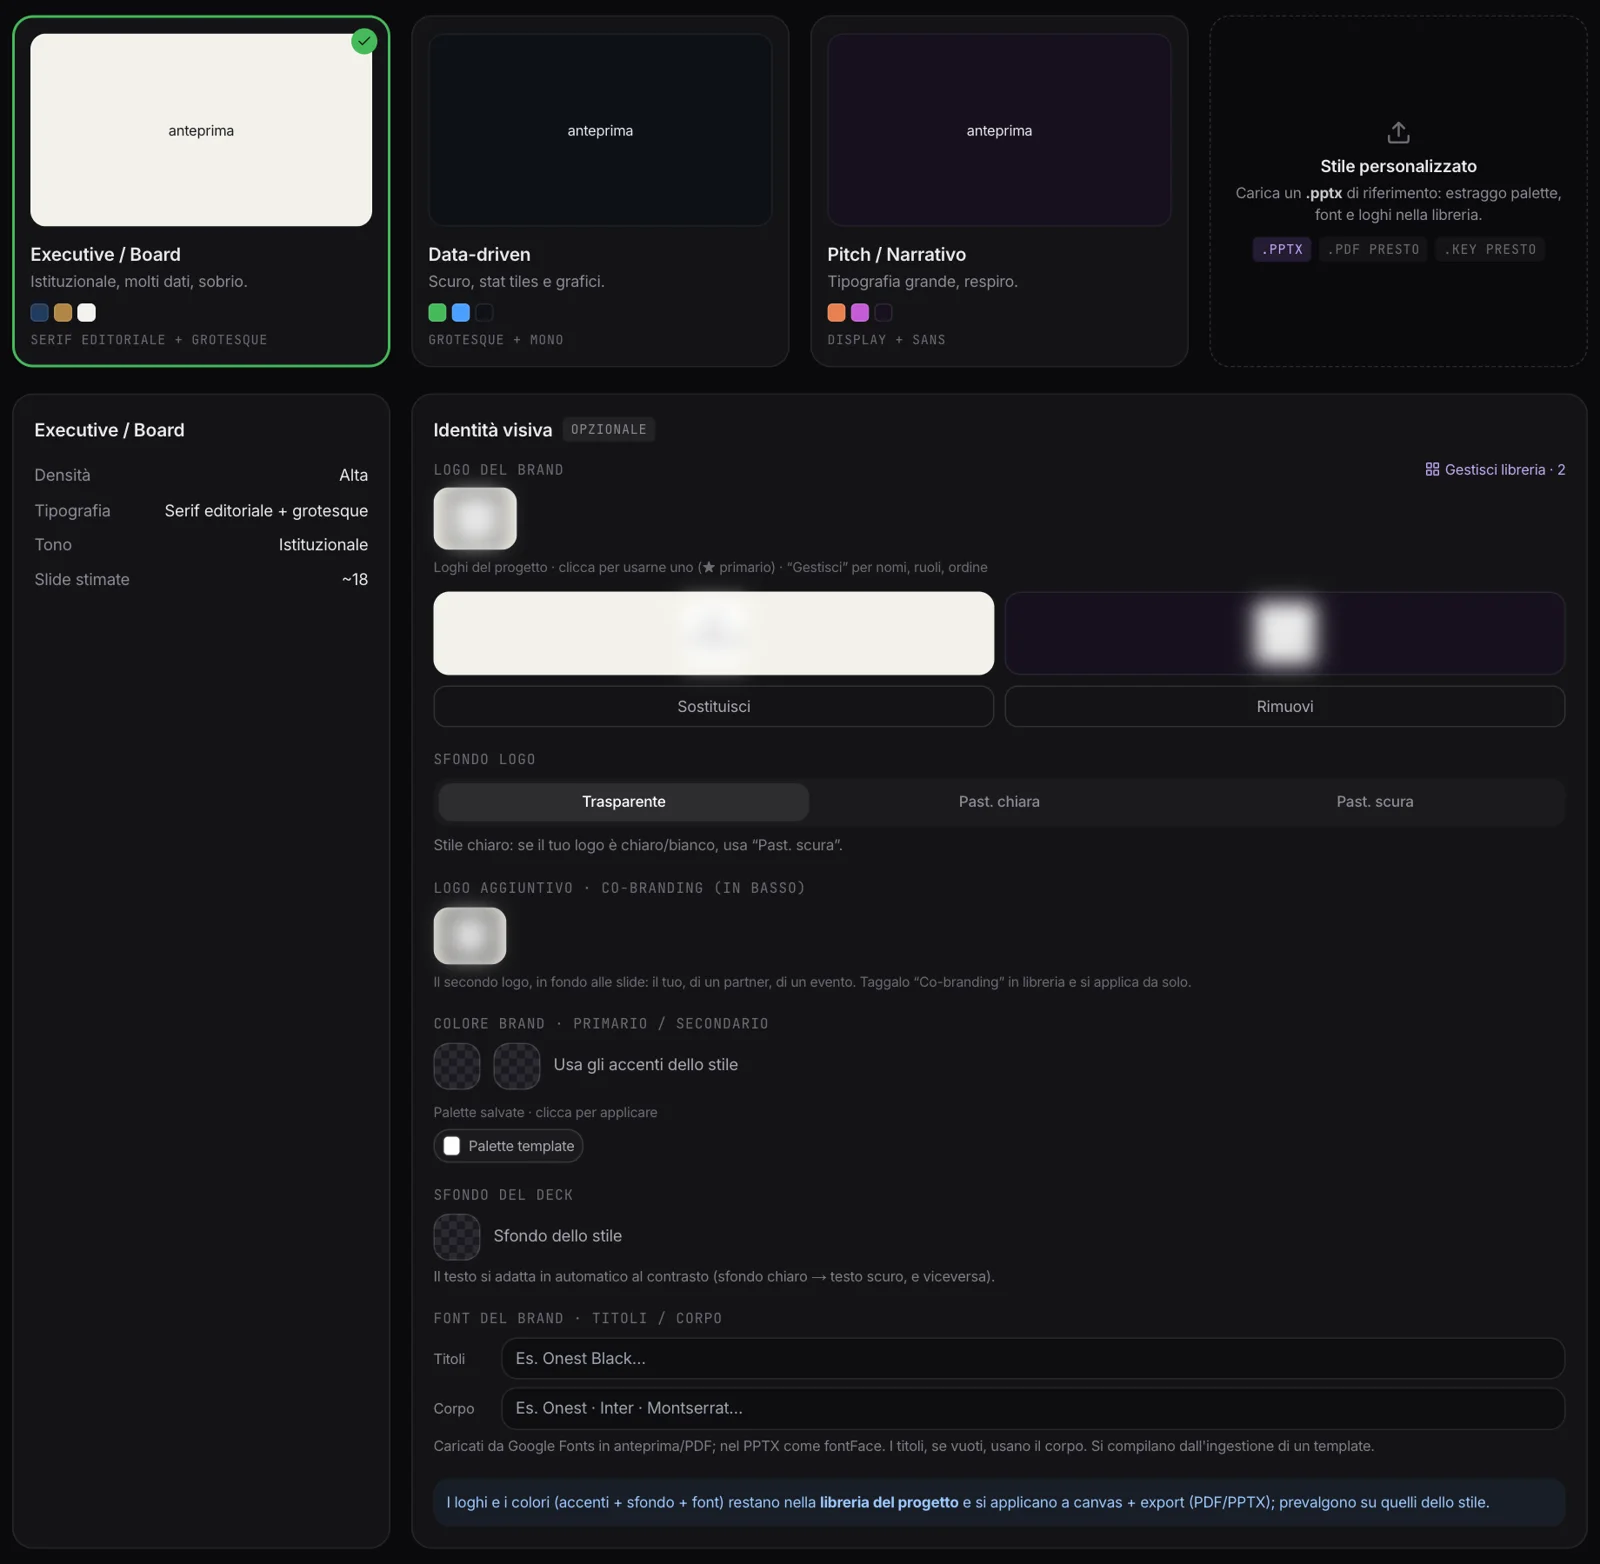
Three starting styles — Executive for the board, Data-driven for the numbers, Pitch for storytelling —, and your identity on top: the logo, a second logo for co-branding, colors, background, fonts. Everything stays in the project library, ready for the next deck.
Have a company template? Upload the .pptx: MAPS extracts its palette, fonts and logos, and the PowerPoint export comes out inside your template, with its layouts.
Twelve slides,
from the project’s data.
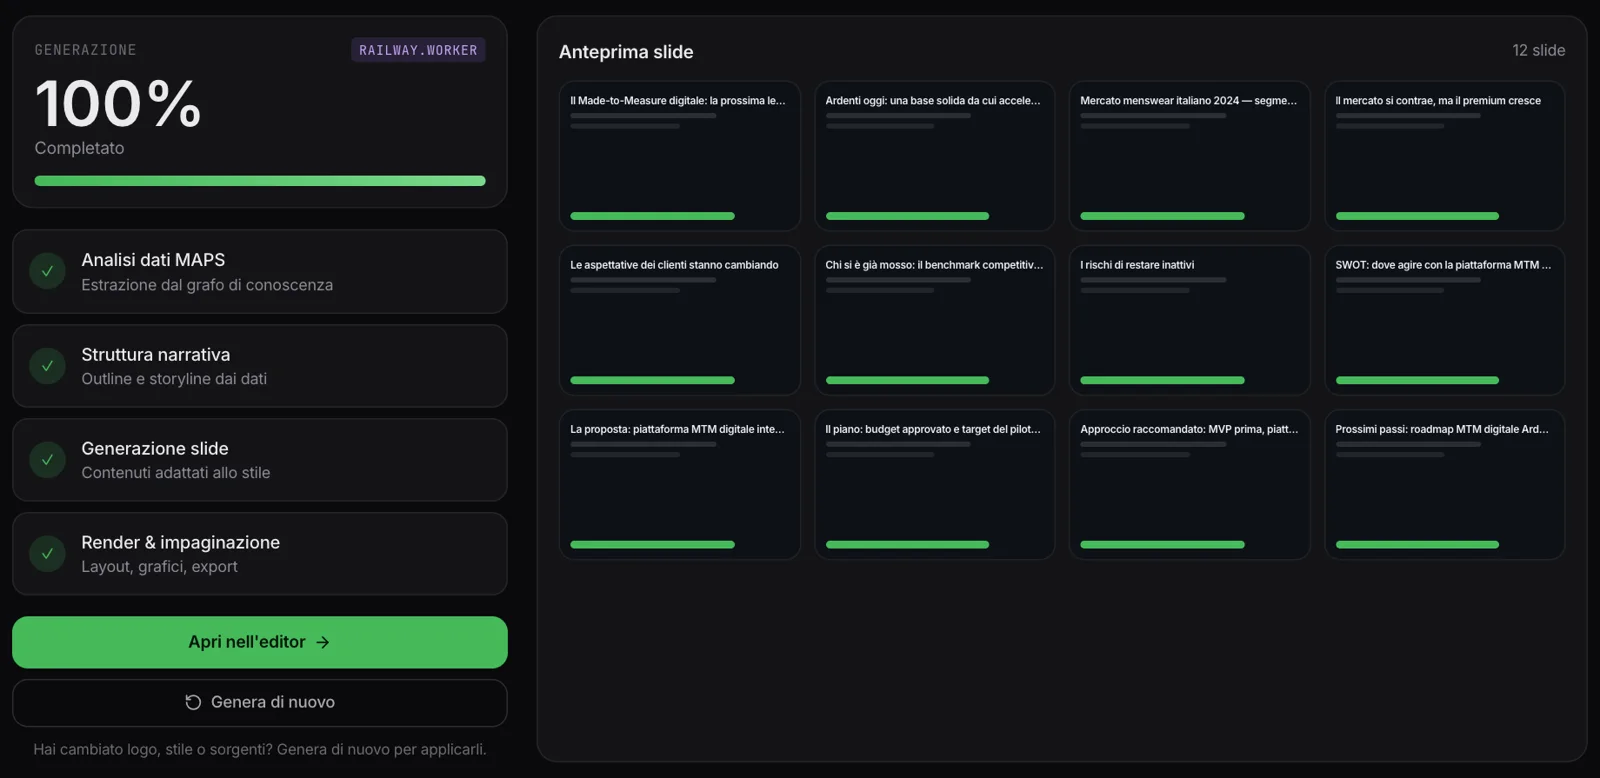
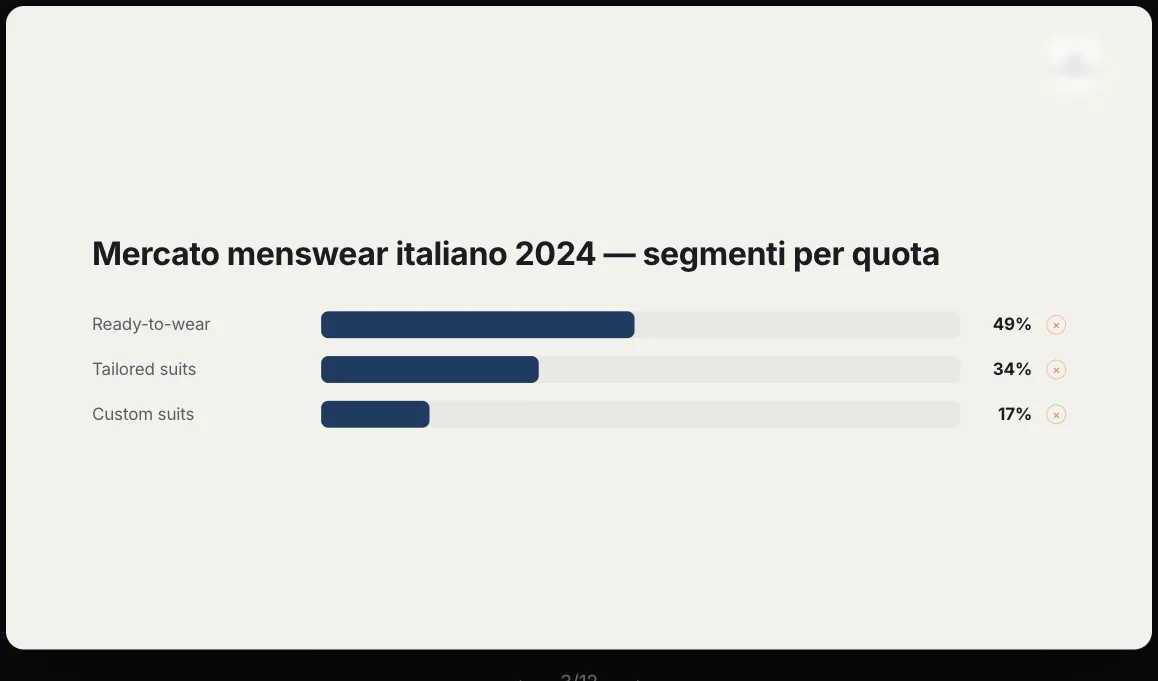
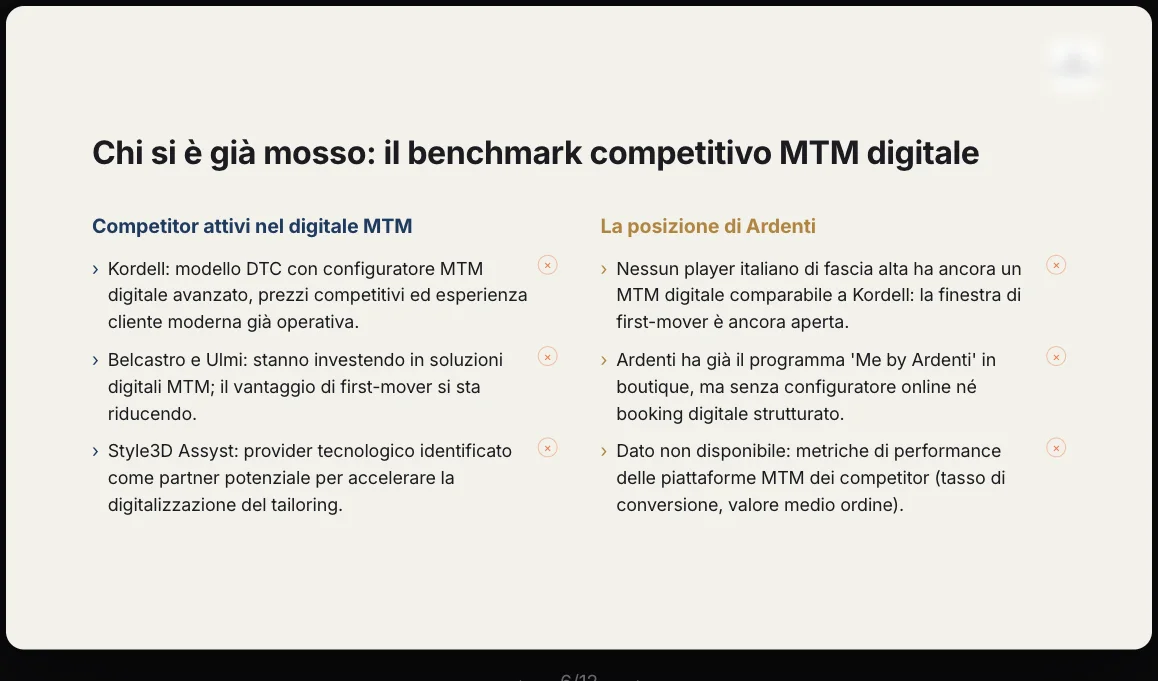
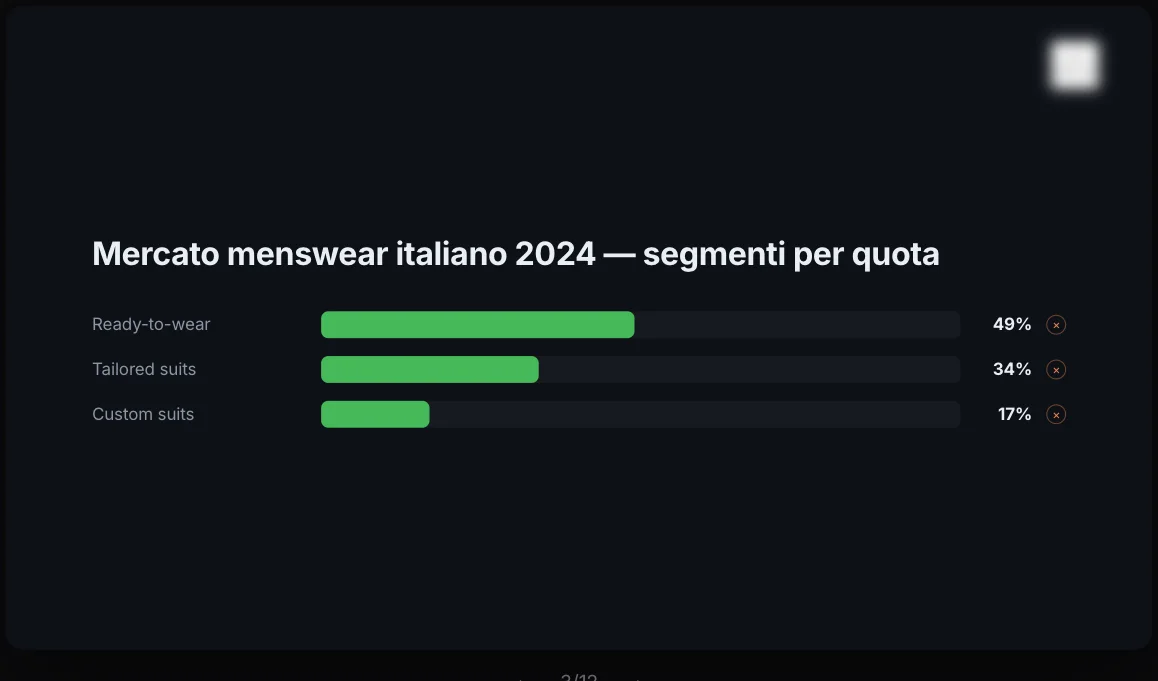
Generation runs in the background: data analysis, narrative structure, slides, layout. You can do something else and come back. The slides only cite numbers that exist in the sources: where a figure is missing, the slide says so.
Edit everything.
By hand or in words.
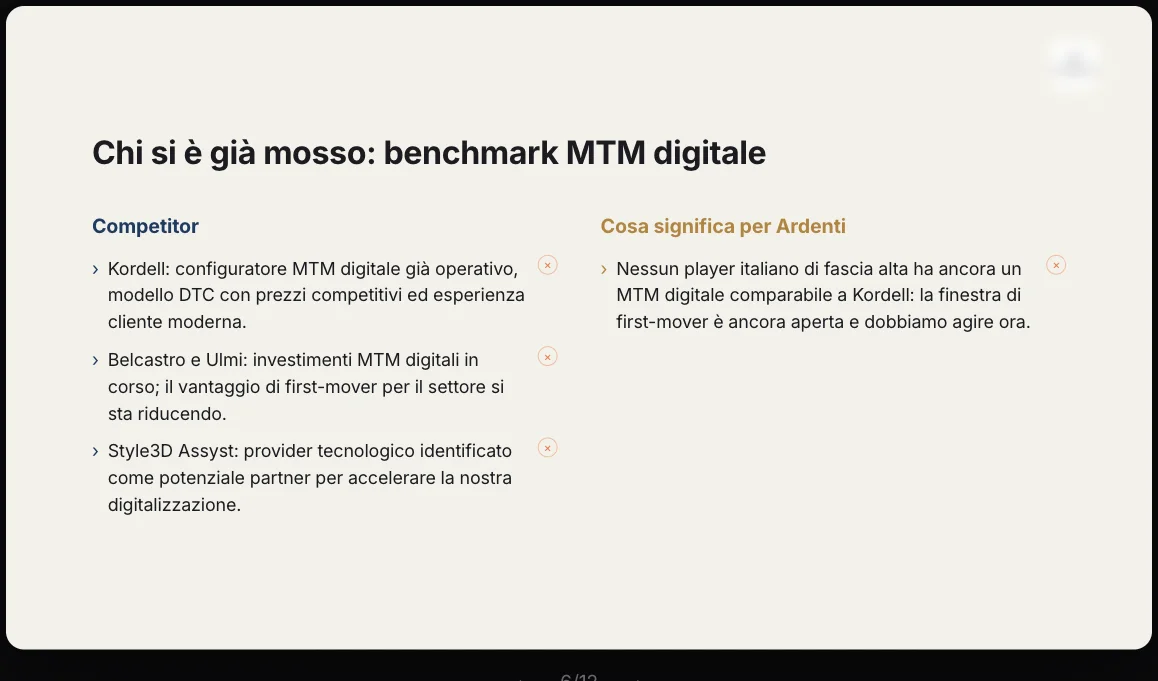
Click a piece of text and rewrite it; remove an element with the ×; change the layout; regenerate a single slide. And the AI Assistant works on the open slide, always with real data: “make it more concise”, “turn it into three points”, “split it in two”. Select several slides and ask it to merge them into a summary. Everything saves automatically.
Languages
The deck in Italian, German, French, Spanish — or for any market. Not a word-for-word translation: the country’s register and conventions.
Culture
A judgement of how the deck lands with an audience in a given country: what to explain, what sounds odd.
PDF and PowerPoint
A faithful export, with text that fits the space; in PowerPoint, inside your template if you’ve uploaded one.
Every deck,
in its place.
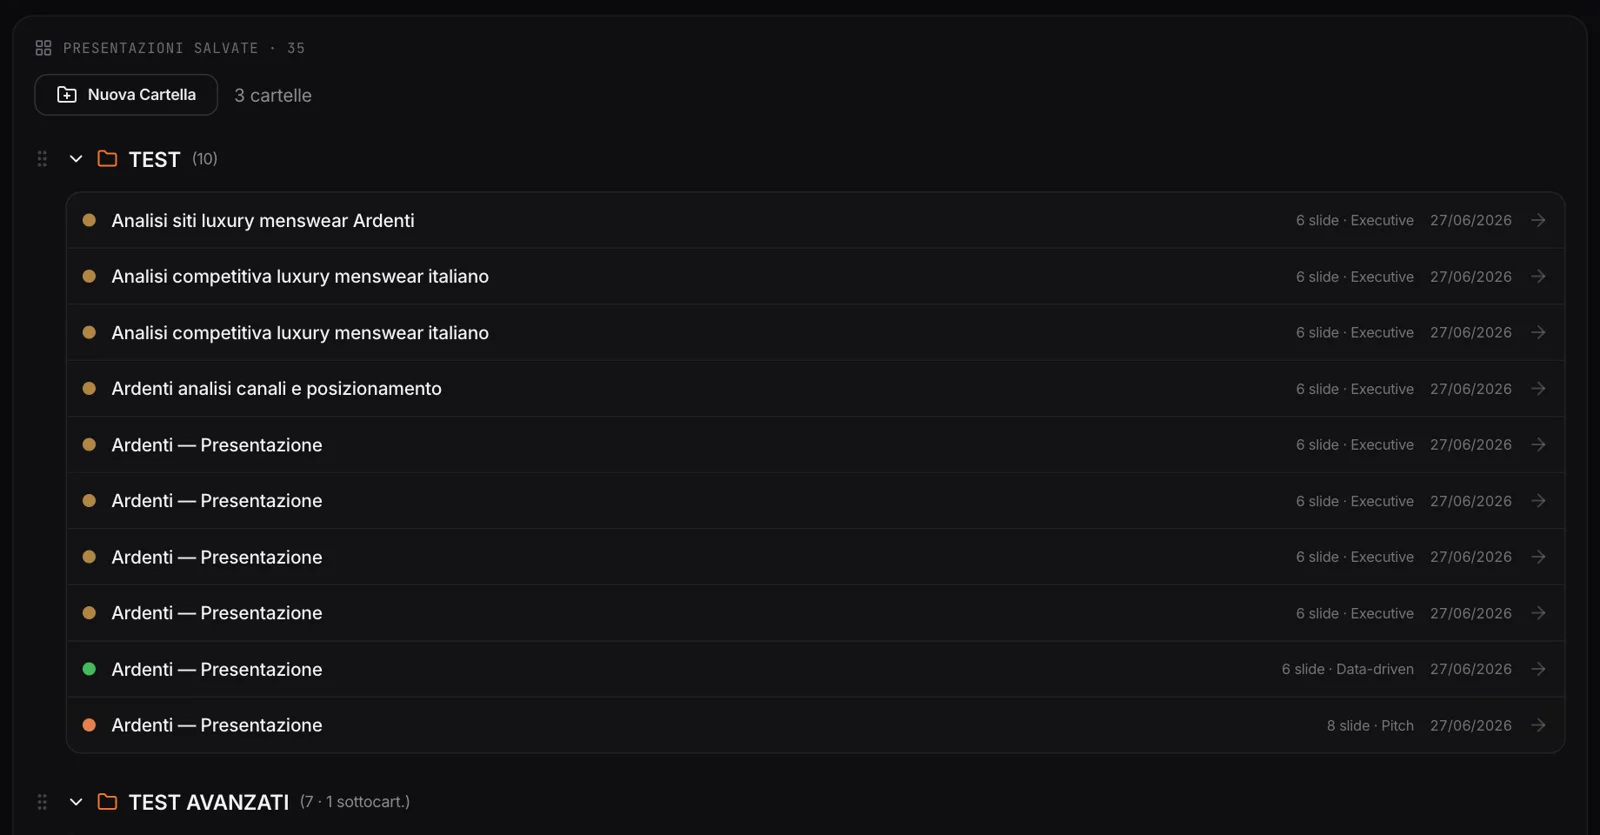
Presentations stay in the project, in folders and subfolders you organize by dragging. Reopen them, regenerate them in another style, translate them, export them again.