Three sources,
always declared.
What MAPS knows about a market comes from three places, and it doesn’t mix them up: the web, the platforms where the market talks and buys, and your materials.
The web, in the market’s language
Search engines and research agents read the press, websites, reports and industry sources. Questions are asked in the language of the country you are studying, not translated from another language: a market is read in its own words.
The platforms
Social media, online store reviews, Google Trends, search engine rankings, YouTube videos, ads in Meta’s public library: the market where it expresses itself, read directly.
Your materials
Research, presentations, PDFs (scanned ones too), spreadsheets, files from Google Drive, contacts from your CRM, Nielsen data, Google Analytics exports. They become the project’s memory, alongside everything else.
Every piece of information
says where it comes from.
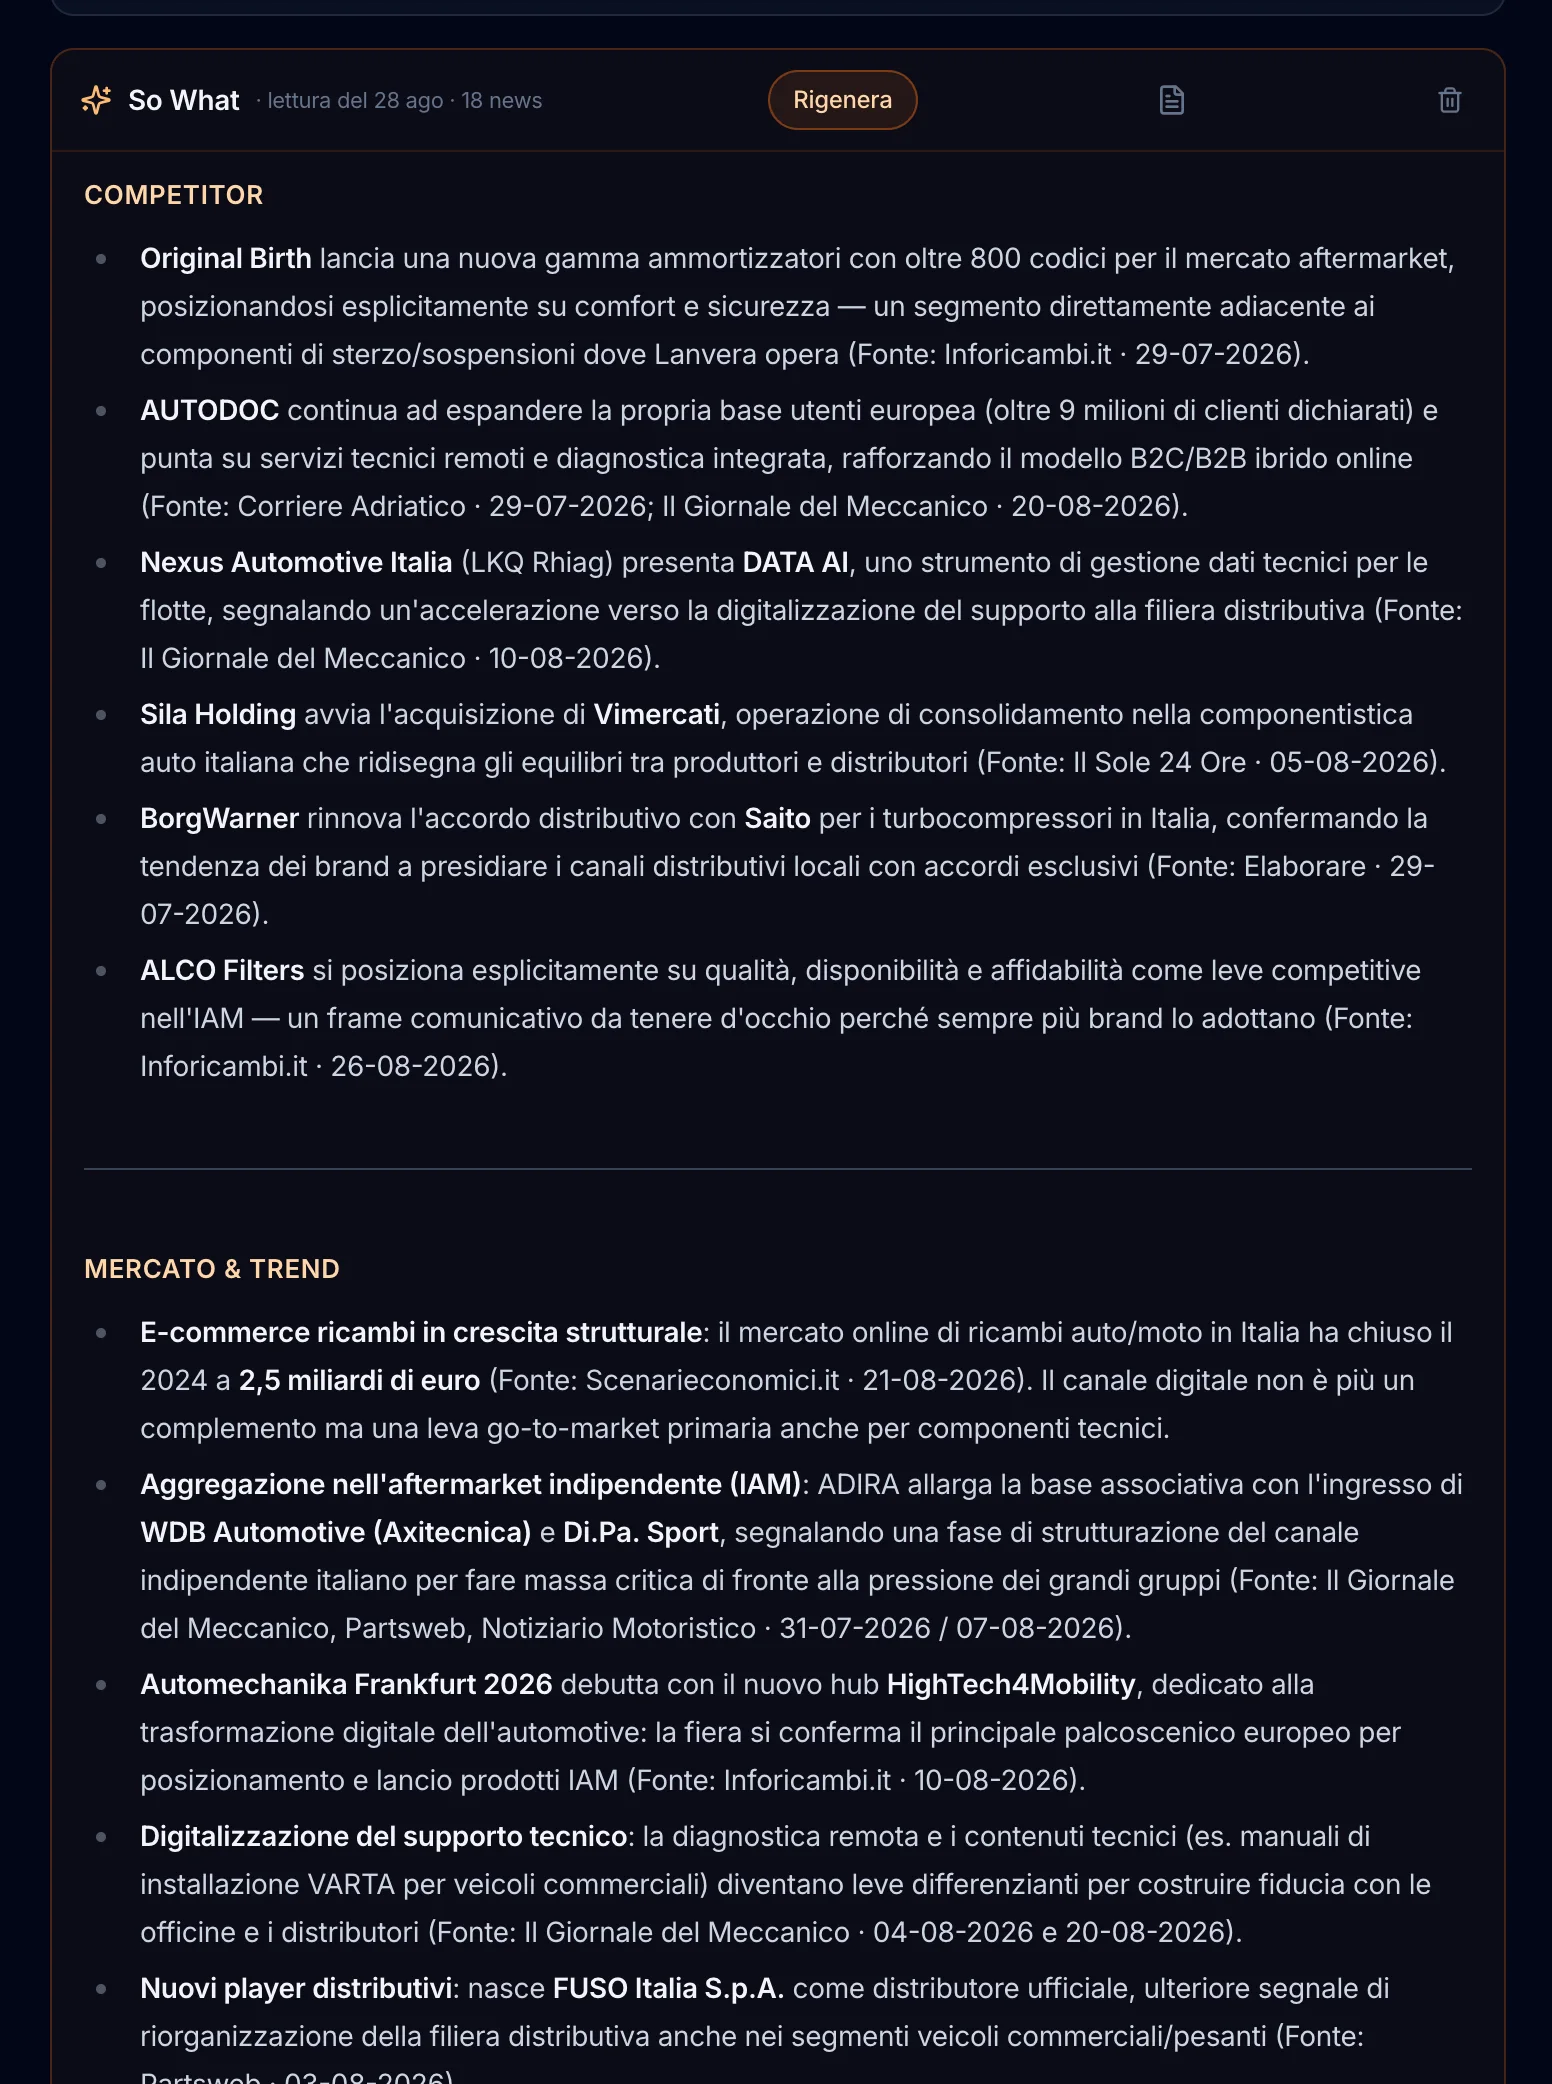
News readings cite the source and date of every statement. In the chat, every fragment the AI reasons on carries the module it comes from and the day it was produced, and the answer cites them.
MAPS distinguishes the nature of what it knows: a fact (panel data, a number of yours, a news item) is not an analysis, and an analysis is not an opinion read on social media. When two sources disagree, panel data and your own data weigh more than the web; and an analysis is never presented as a fact.
It says so.
It doesn’t make it up.
If a piece of information isn’t in the materials, the answer says it isn’t there: no plausible-sounding numbers, names or shares to fill the gap.
The numbers that matter are calculated by code, not by the model: scanner data analyses and budget figures are calculations, and the AI comments on them without changing them. Old data is flagged as such, and when something changes upstream — a country, a module — the report says it needs to be regenerated.
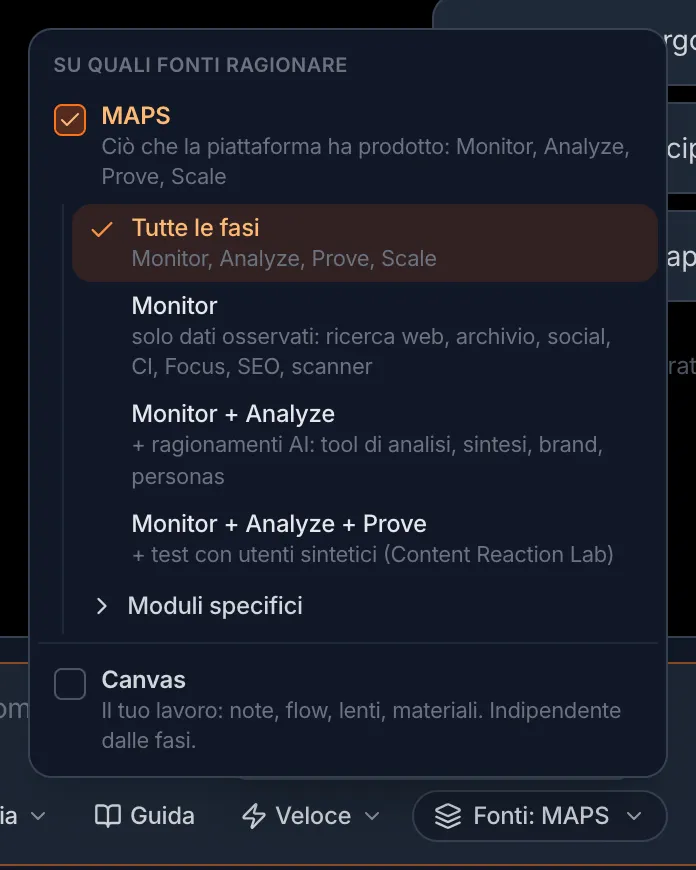
And you choose what to reason on: only observed data, analyses too, synthetic user tests too.
A second look,
before it reaches you.
Where a piece of research can go wrong, MAPS double-checks it.
An agent that verifies
In the communication and competitor analyses, an agent rereads the work, finds the weak points and runs targeted searches to confirm or correct them.
A judge on the syntheses
Social listening syntheses are evaluated for completeness, specificity, consistency and usefulness before they are used.
Judges that don’t rewrite
A country’s cultural judge, the synthetic users’ reaction, brand consistency: they place a verdict next to the content, with their confidence level, and leave it untouched.
Declared simulations
Synthetic users and the buying committee are simulations anchored to the project’s data, and they say so: they help you prepare, not predict.
The right model
for each job.
We don’t use a single model for everything. Strategic reasoning — positioning, identity, SWOT, scenarios, campaign strategy — goes to the deepest models; text production and long syntheses to the ones best suited to writing; data structuring and research to the fastest models. If a model doesn’t respond, the work moves to another one instead of stopping.
Powered by Claude (Anthropic) · GPT-OSS-120B on Groq · OpenAI · Perplexity · Exa · Bright Data · Apify · DataForSEO · Firecrawl · Jina · YouTube Data API · Meta Ad Library
Not just similar text.
Relationships, over time.
A classic RAG — the technique an AI uses to answer questions about your documents — looks for the passages most similar to the question and reads them. It works well when the answer is in one place. It works less well when the answer lies in the connections: who competes with whom, on which channel, for which audience.
MAPS adds a Graph RAG: from every piece of research and analysis it extracts the entities and the relationships between them, and keeps them in a graph. When you name a competitor, the chat doesn’t just read the passages that resemble it: it follows its relationships — the channels it operates in, the audiences it serves, the risks it exposes you to — and puts them next to the text.
“Competitor A is strengthening its presence on marketplaces. The online channel is growing, especially among younger customers.”
Three true facts, lined up. But the question was a different one: where are you exposed? You have to make the connection yourself.
“You’re exposed on marketplaces. It’s the channel where Competitor A operates — confirmed by 4 sources, from March to September —, it’s where the young urbanites are, and it’s where your presence is weakest. The risk: losing that audience exactly where Competitor A is growing.” (Sources: Distribution Focus, Consumer Focus, SWOT)
An answer to your question, with the reasoning that connects the dots, the sources, and how solid the evidence is.
Illustrative example, with made-up names.
You know how much to trust it
Every relationship says how many distinct sources support it and over what period it was reconfirmed: a link confirmed by four sources over six months weighs more than one seen once.
You know what changed
Market readings stay with their date, and the chat can tell you what has changed since last time.
No made-up connections
The graph comes only from what is written in the research: every relationship points back to the notes it comes from.
It speaks the language of marketing
An ontology we built for marketing and communication: brands, competitors, segments, channels, categories, context, phenomena, measures, assessments, recommendations — and eleven ways to relate them.
The vocabulary is closed — always the same types and the same relationships, so the graph stays queryable — but the content is open: no market, channel or industry decided in advance. The SWOT, for example, isn’t a separate table: every assessment carries its pole (internal or external) and its sign, so strengths, weaknesses, opportunities and threats connect to everything else.
It stays yours,
and it stays separate.
Each organization sees only its own projects, and every request checks this on the server. When a chat reasons across several clients or several countries at once, every piece of information carries the label of where it comes from, and the AI doesn’t carry data over from one client or country to another.
CRM contacts
Each contact’s email becomes a code. The AI never sees the contact rows: it works on aggregates, and CRM data doesn’t enter the chat’s memory.
Readable emails, if you want
If you need them back for your campaigns, you encrypt them with a secret passphrase you choose: we can neither read them nor recover it.
Where they are stored
The database is in Frankfurt, in the European Union. To generate analyses and answers, text goes through the AI model providers, which may also process it outside the EU; CRM contacts don’t.
No training
The model providers MAPS sends your text to — Anthropic, Groq, OpenAI — receive it via API, and by contract do not use it to train their models.
The final word
is always yours.
Every text can be edited right where you read it. Before every regeneration MAPS keeps the previous version, and you can go back to it. Content for clients goes through an approval round, item by item.
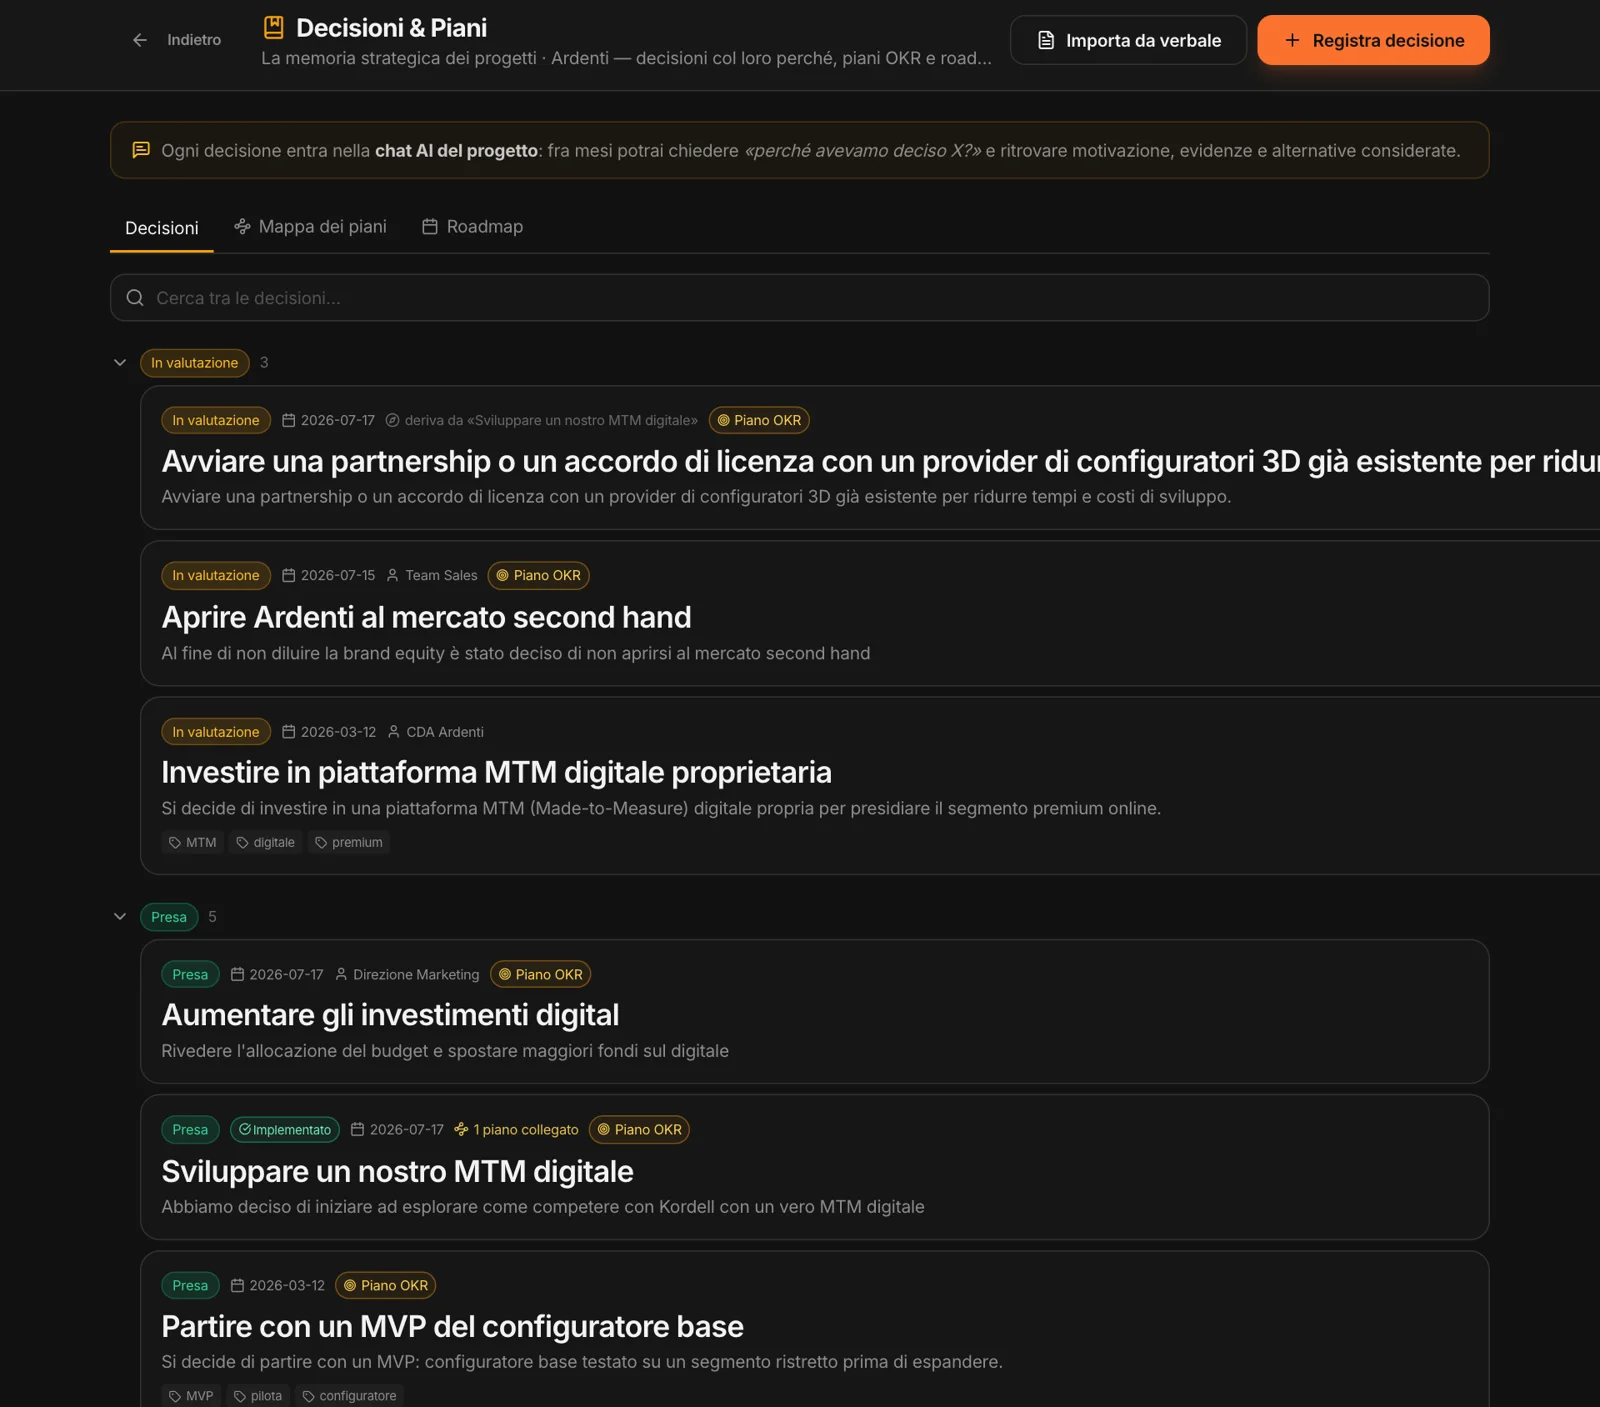
Important choices go into the decision memory: what you decided, why, on what evidence, what you ruled out. So six months from now the chat can answer “why did we decide this?”.
And throughout the app a notice reminds you that the content is AI-generated: it’s meant to be read, not just used.