
Every tool already knows
what the project knows.
It reads the project
The brand context, everything the Monitor has gathered and the documents you uploaded: the tool pulls what it needs from the project’s memory.
It builds the tool
A SWOT, a positioning map, a launch plan: built on your competitors, your customers, your market.
It puts it back in memory
The result enters the project’s memory: the chat uses it, and the next tools start from there too.
The same tools.
Read for your market.
A startup’s SWOT isn’t an established company’s. A B2B journey isn’t a supermarket shopper’s. Every tool reinterprets its fields according to the project profile.
All the tools. And you can bring your own data: sales (Nielsen, Circana), media investment, CRM, web campaigns.
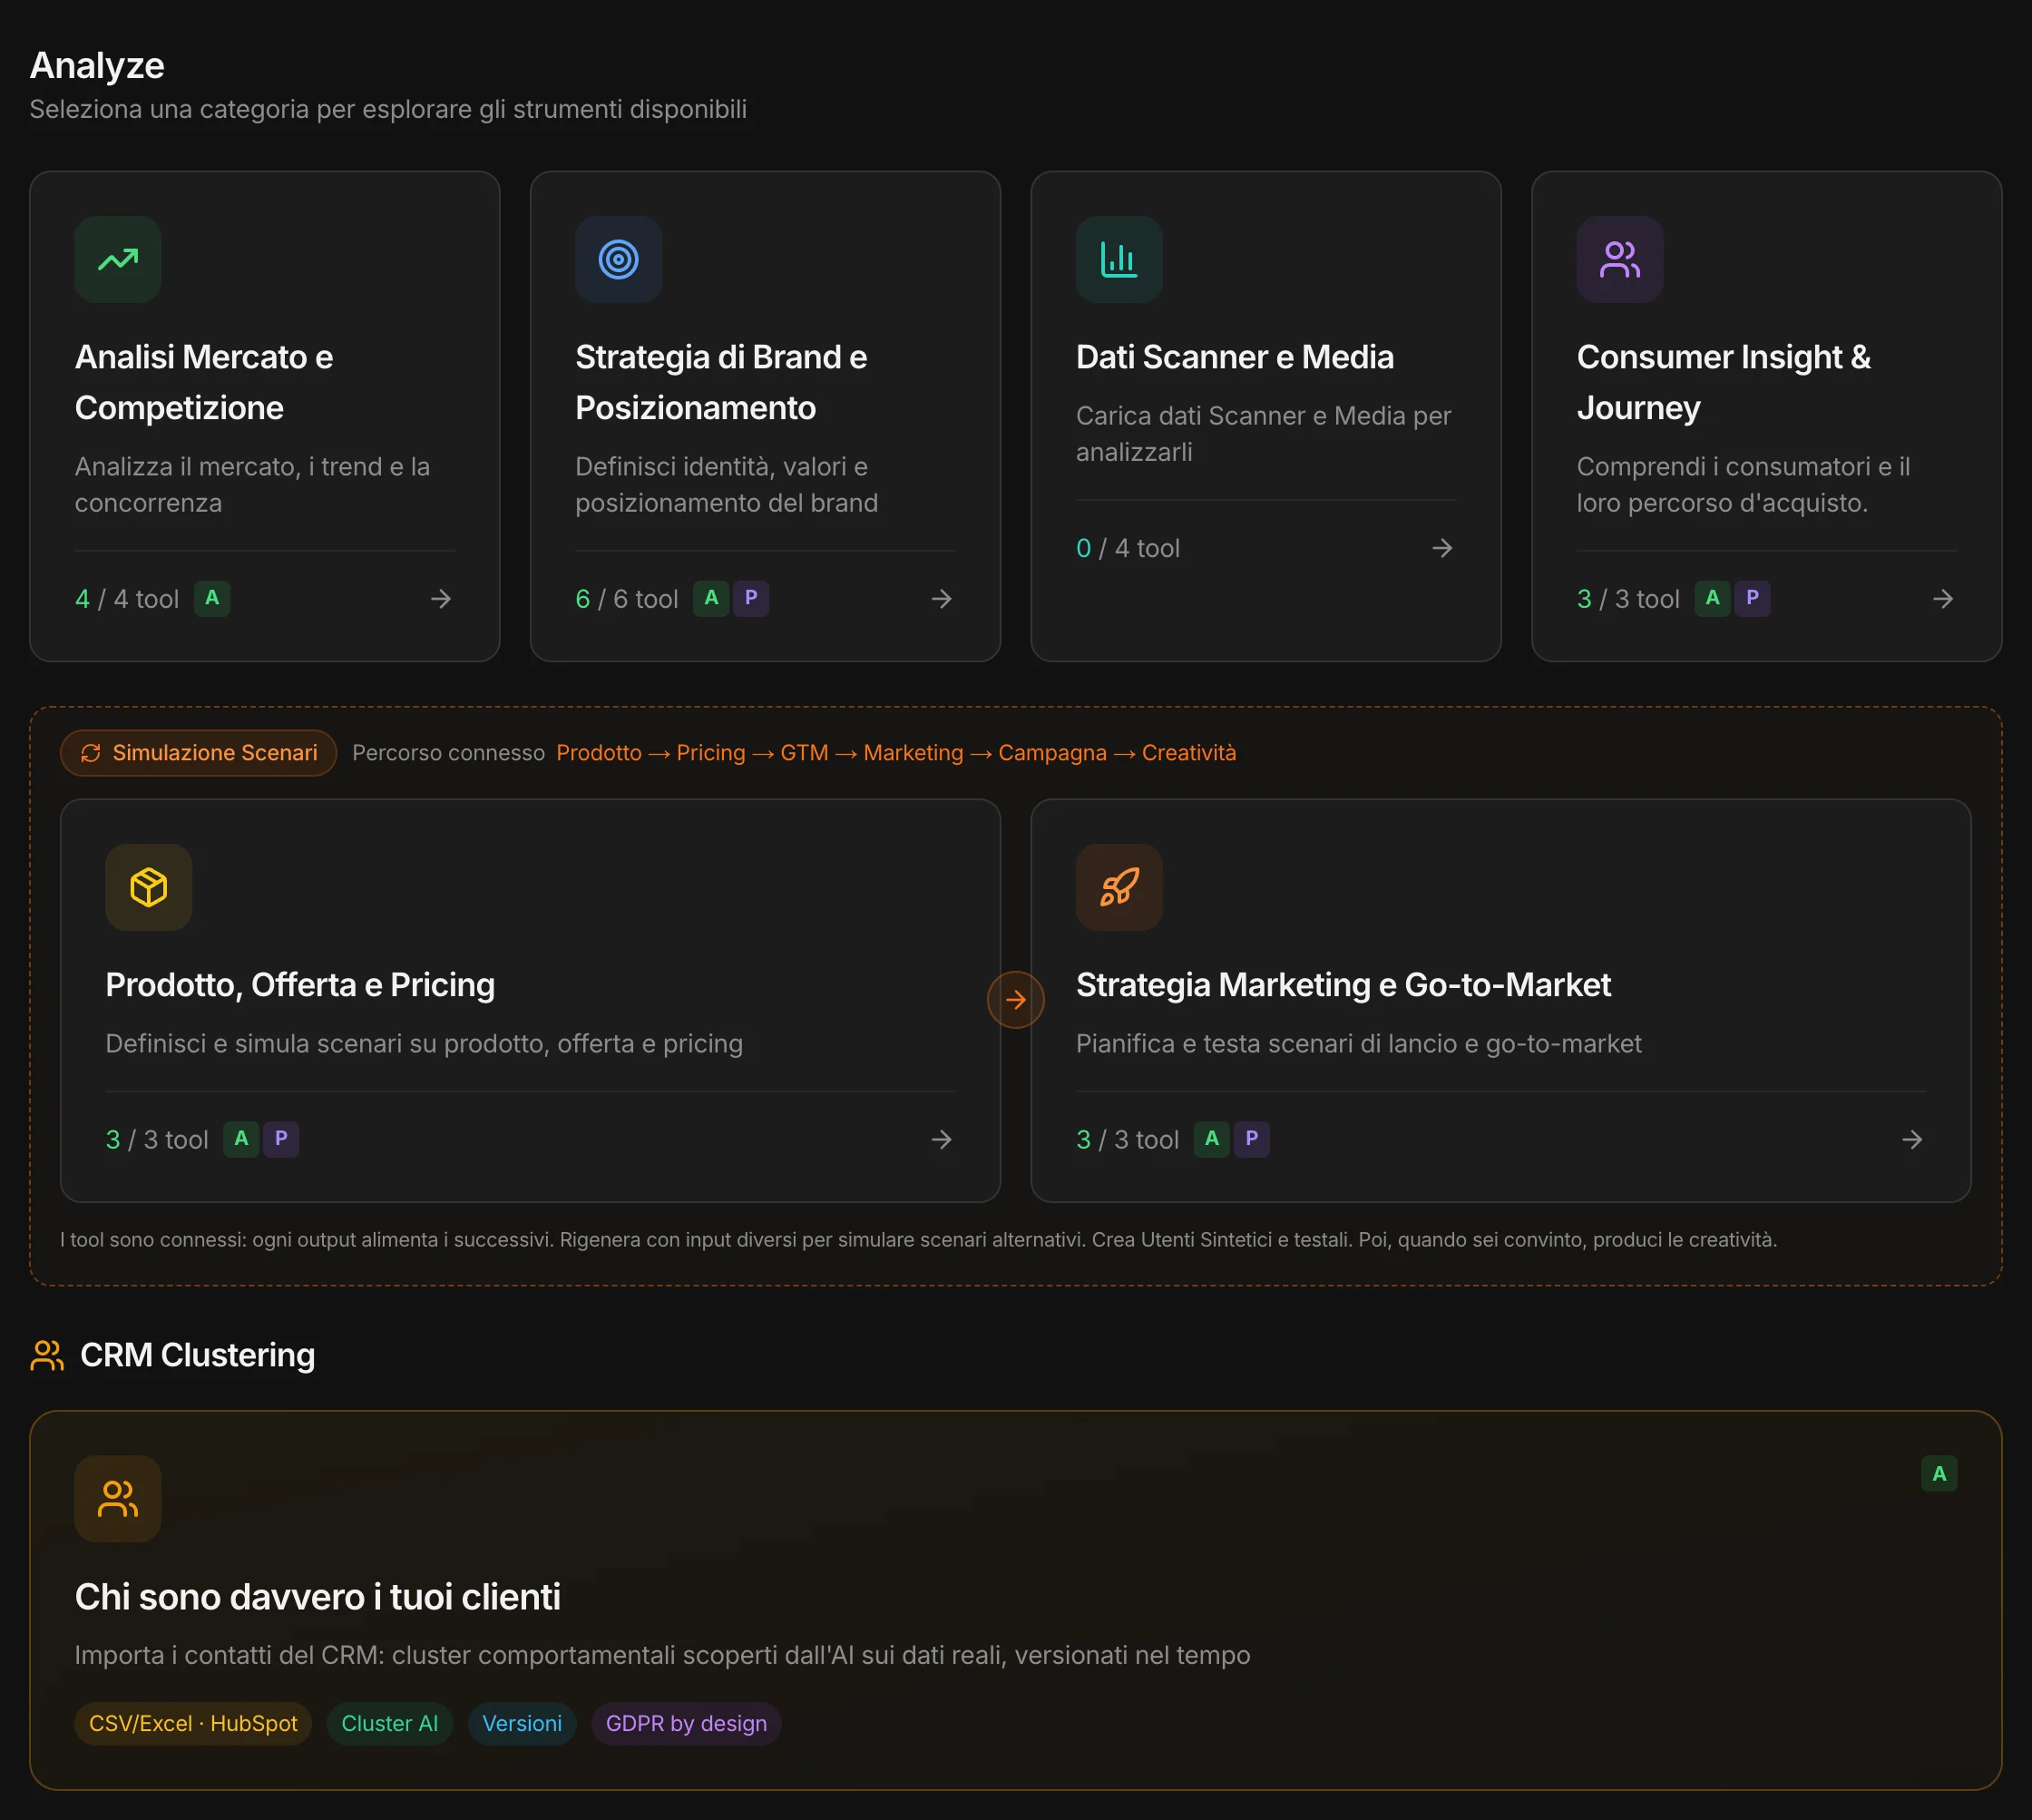
Six categories.
A tool for every decision.
Market and Competition Analysis
The market in one dashboard — size, segments, trends, channels, opportunities —, the competitor map, the SWOT with cross strategies, and three scenarios for the future with the signals to watch.
Know where you stand, before deciding where to go.
Inside the category →Brand Strategy and Positioning
Mission, values and tone of voice; the value proposition; the positioning, and the maps that put you next to your competitors; the business model. They can all be generated together.
Say who you are, and why they should choose you.
Inside the category →Consumer Insight & Journey
The purchase journey channel by channel, what buyers think and feel, and the category’s deep codes.
Speak to the right people, at the right moment.
In B2B · Customers, Decision-Makers & Journey: the procurement journey and the decision-makers at client companies
Inside the category →Product, Offer and Pricing
Scenario simulationThe product and how it can evolve, its features compared with competitors’, the pricing strategy with market benchmarks.
Decide what you sell, and at what price.
Inside the category →Marketing and Go-to-Market Strategy
Scenario simulationThe launch plan, the four Ps, the campaign: objectives, audience, messages, channels, timing and budget.
Turn the strategy into a plan.
Inside the category →Scanner and Media Data
You upload the data you already have — sales from Nielsen or Circana, media investment, exports from ad platforms and GA4 — and MAPS reads it, with a chat that answers with the numbers.
Make your data talk.
In B2B · Media Data: Media Planner and Web Investment
CRM Clustering
You import your CRM contacts, from a file or from HubSpot: MAPS finds the customer groups that really exist, enriches them with your research, NPS and market data, and turns them into synthetic users you can interview. The AI never sees individual contacts.
Inside the tool →Pivot Lab
StartupUp to six positioning hypotheses, tested on up to six markets: for each one, what the customer gets out of it, the proof you need, who they compare you with.
Inside the tool →MAPS reads the market.
You bring your own numbers.
You upload the data you already have, and MAPS puts it next to what it knows about the market. It answers your questions with the real numbers.
Media investment
Nielsen AdQuest exports (Italy, today): how much the category invests, who, where. With a chat that answers on the data.
Learn more →Your CRM
Contacts and orders, from a file or from HubSpot: MAPS finds the real customer groups. Then it enriches them with your research, NPS, surveys and what it knows about the market: the result is in-depth synthetic users you can interview, and campaigns for each group. The AI never sees individual contacts.
Learn more →Sales
ConsumerNielsen or Circana data: market, prices, distribution, the retailer’s shelf.
Learn more →From spend to customer
NewExports from Meta, Google, TikTok and LinkedIn, GA4 and outcomes from the CRM. MAPS tells you what the data allows you to read — and what it doesn’t.
Learn more →Try one path.
Then try the other.
Product, pricing, go-to-market, marketing and campaign are connected: each result feeds the next. Change an assumption — a price, an audience, a channel — and regenerate: you see where it leads. Previous versions stay in the history.