
The AdQuest export,
as it is.
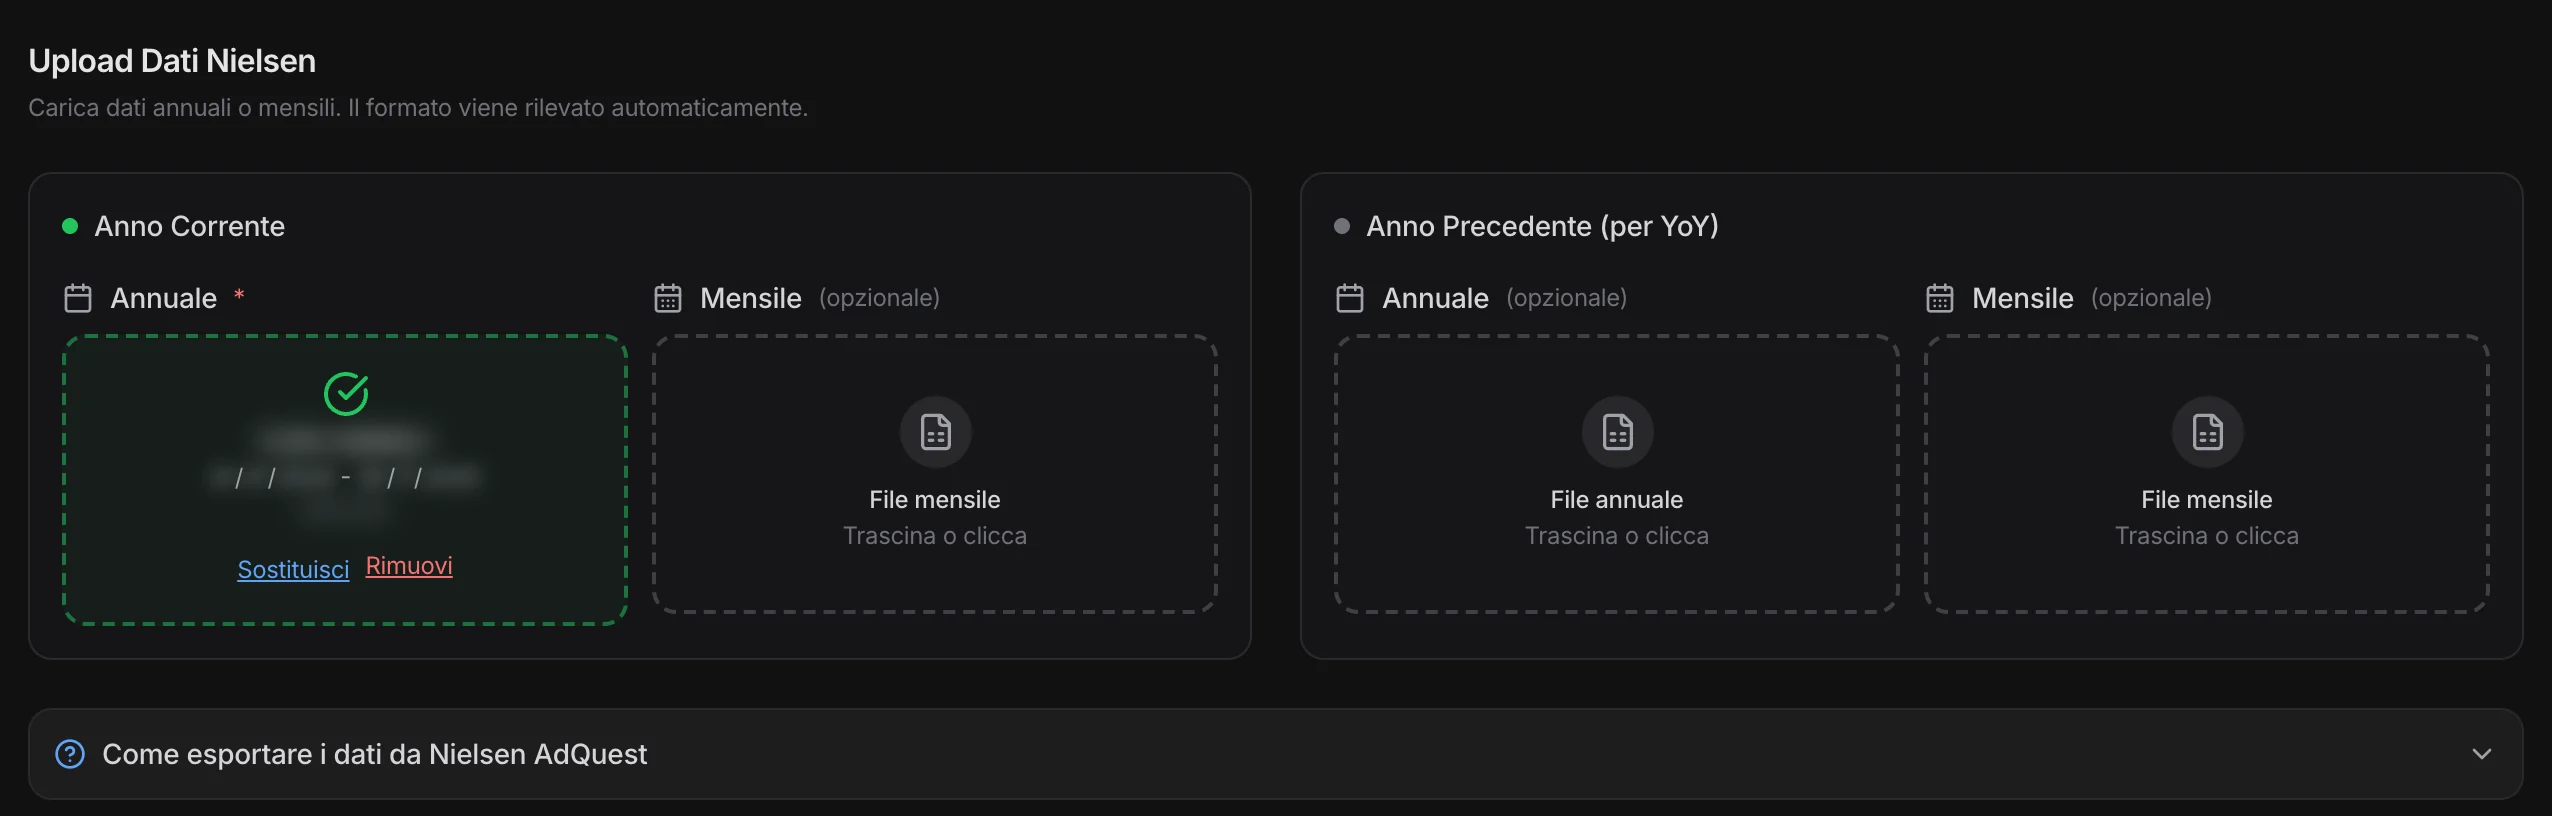
You upload the annual file — and if you like the monthly one, and last year’s files for comparison. MAPS recognizes the format on its own; and if you don’t know how to export it, the step-by-step guide is right there.
How much the category spends,
and in which media.
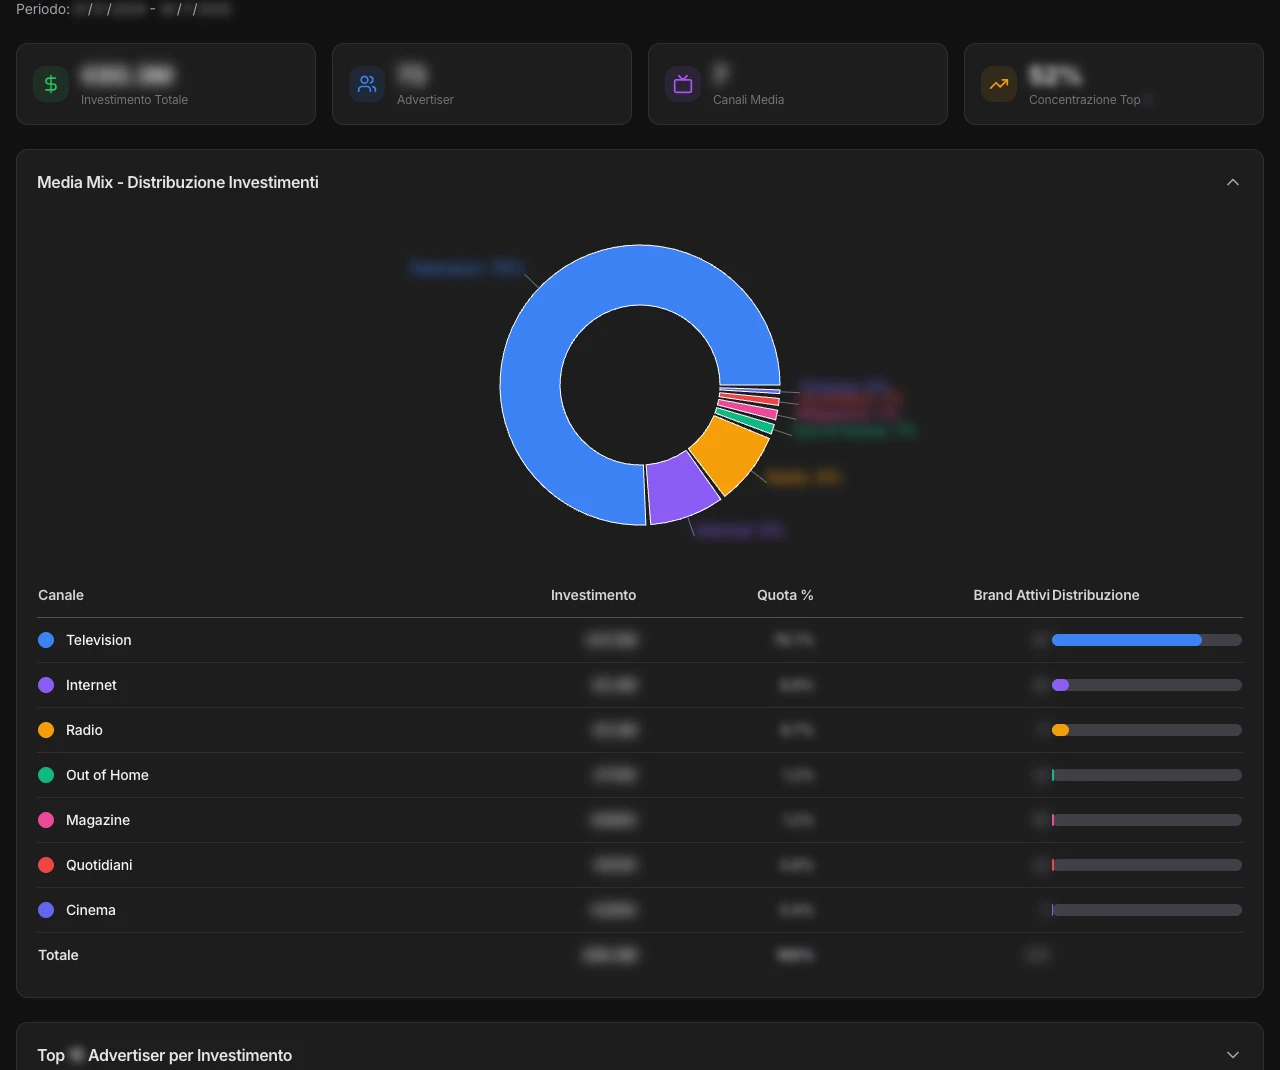
Total spend, how many advertisers, how many media, how concentrated the spending is. Then the media mix: TV, internet, radio, out-of-home, print, cinema — how much each one weighs and how many brands use it. And the rankings of companies and brands by spend.
Every competitor,
and its mix.
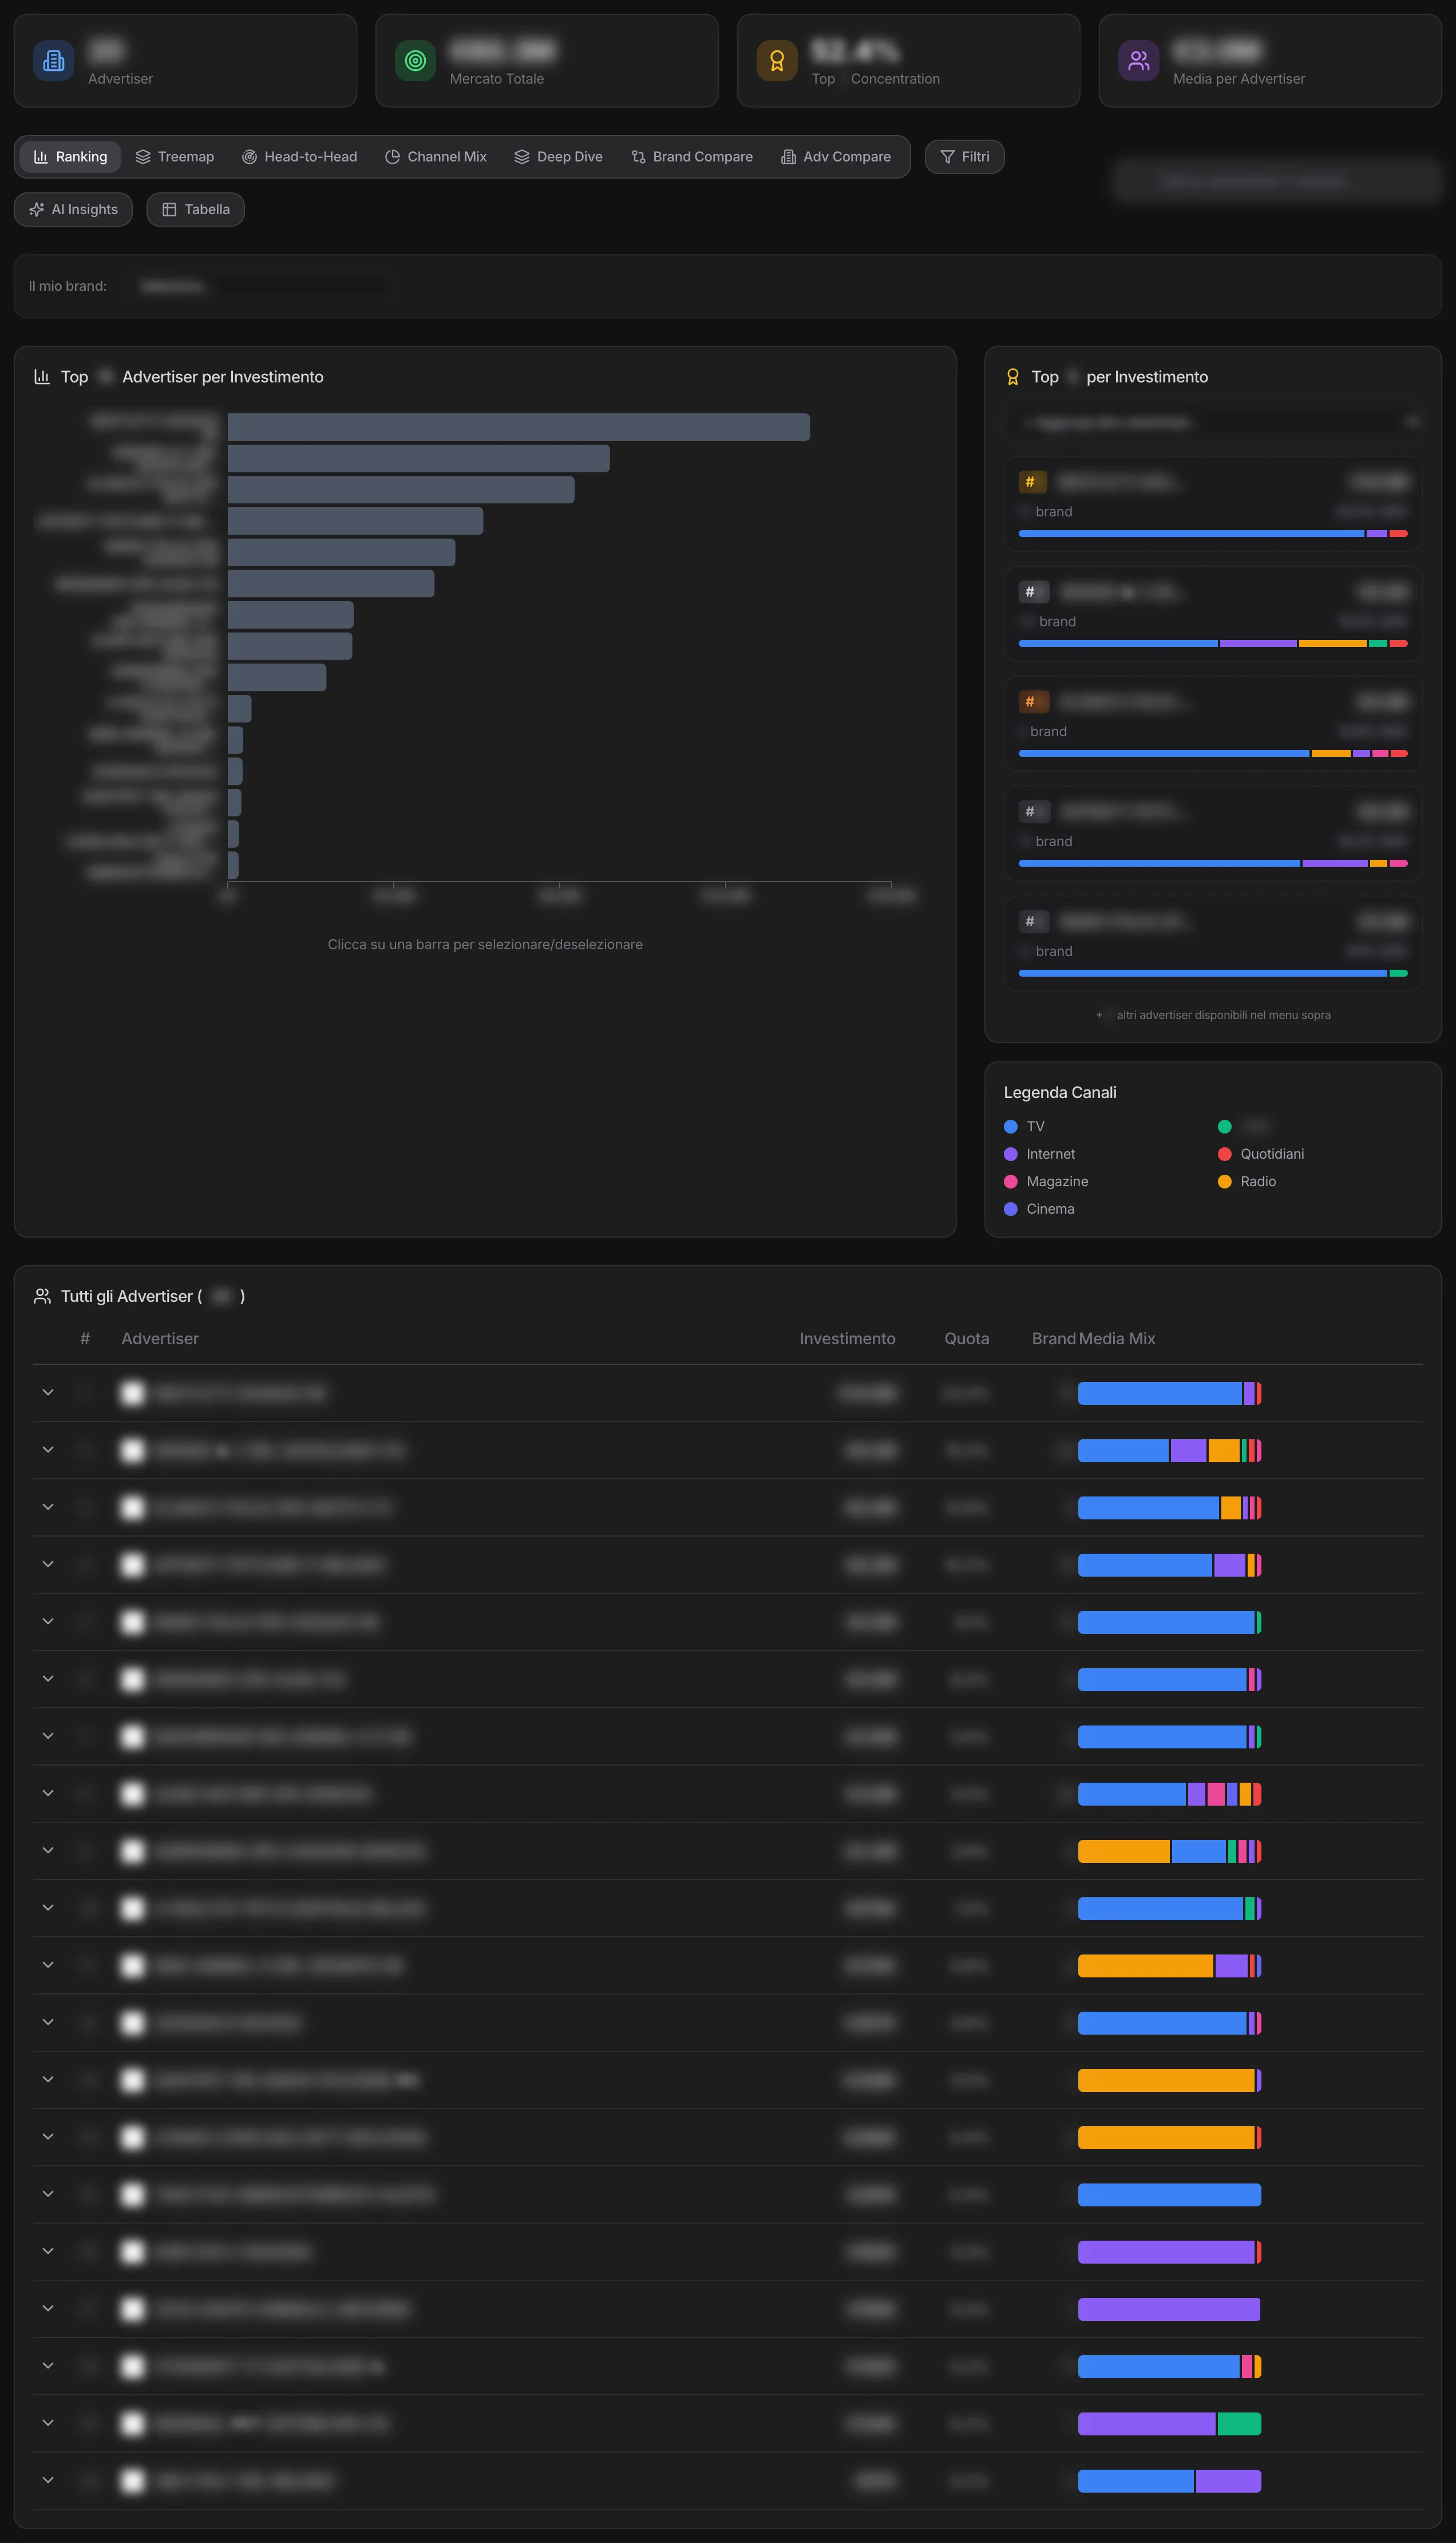
The advertiser ranking, the share map, the head-to-head comparison, each one’s media mix, the detail of a company and its brands. You see at a glance who bets everything on TV and who has diversified.
When they spend.
And where the open windows are.
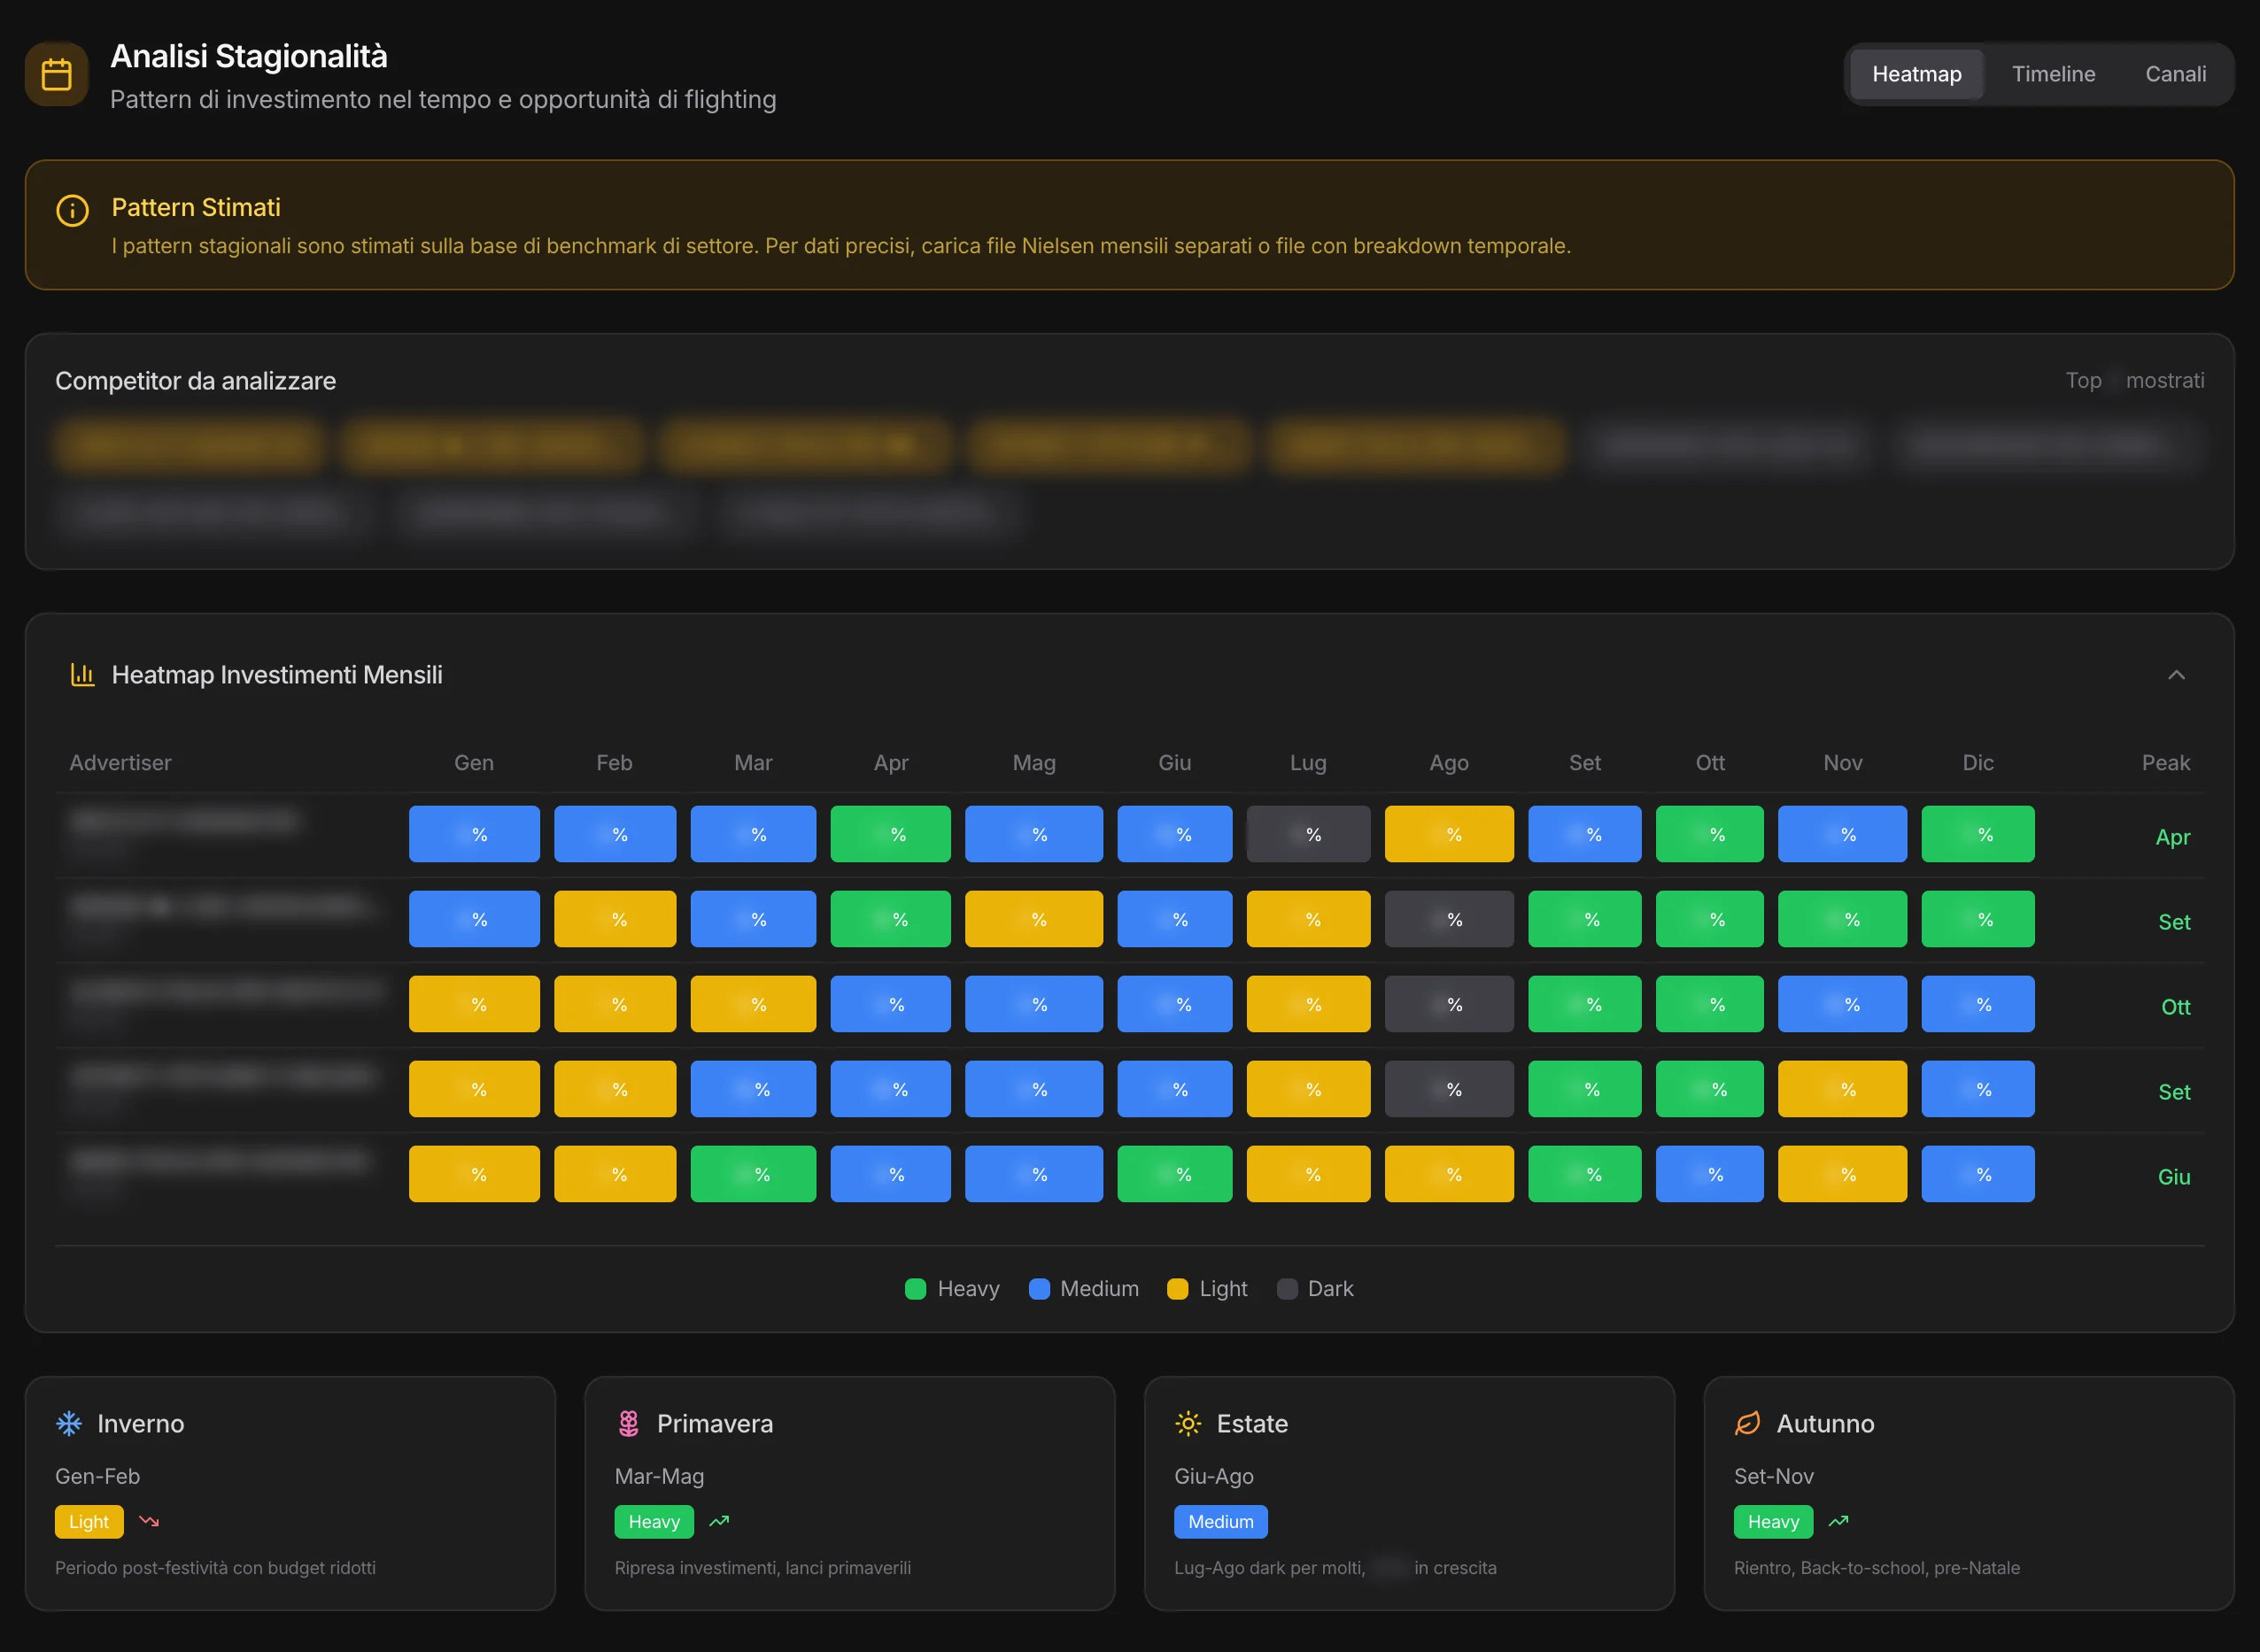
The month-by-month map of the main advertisers, the peaks, the high-pressure seasons and the quiet ones: where a campaign risks getting lost, and where it would have room. With the monthly files it’s the real data; without them, MAPS estimates it from industry benchmarks — and says so.
From the market
to your plan.
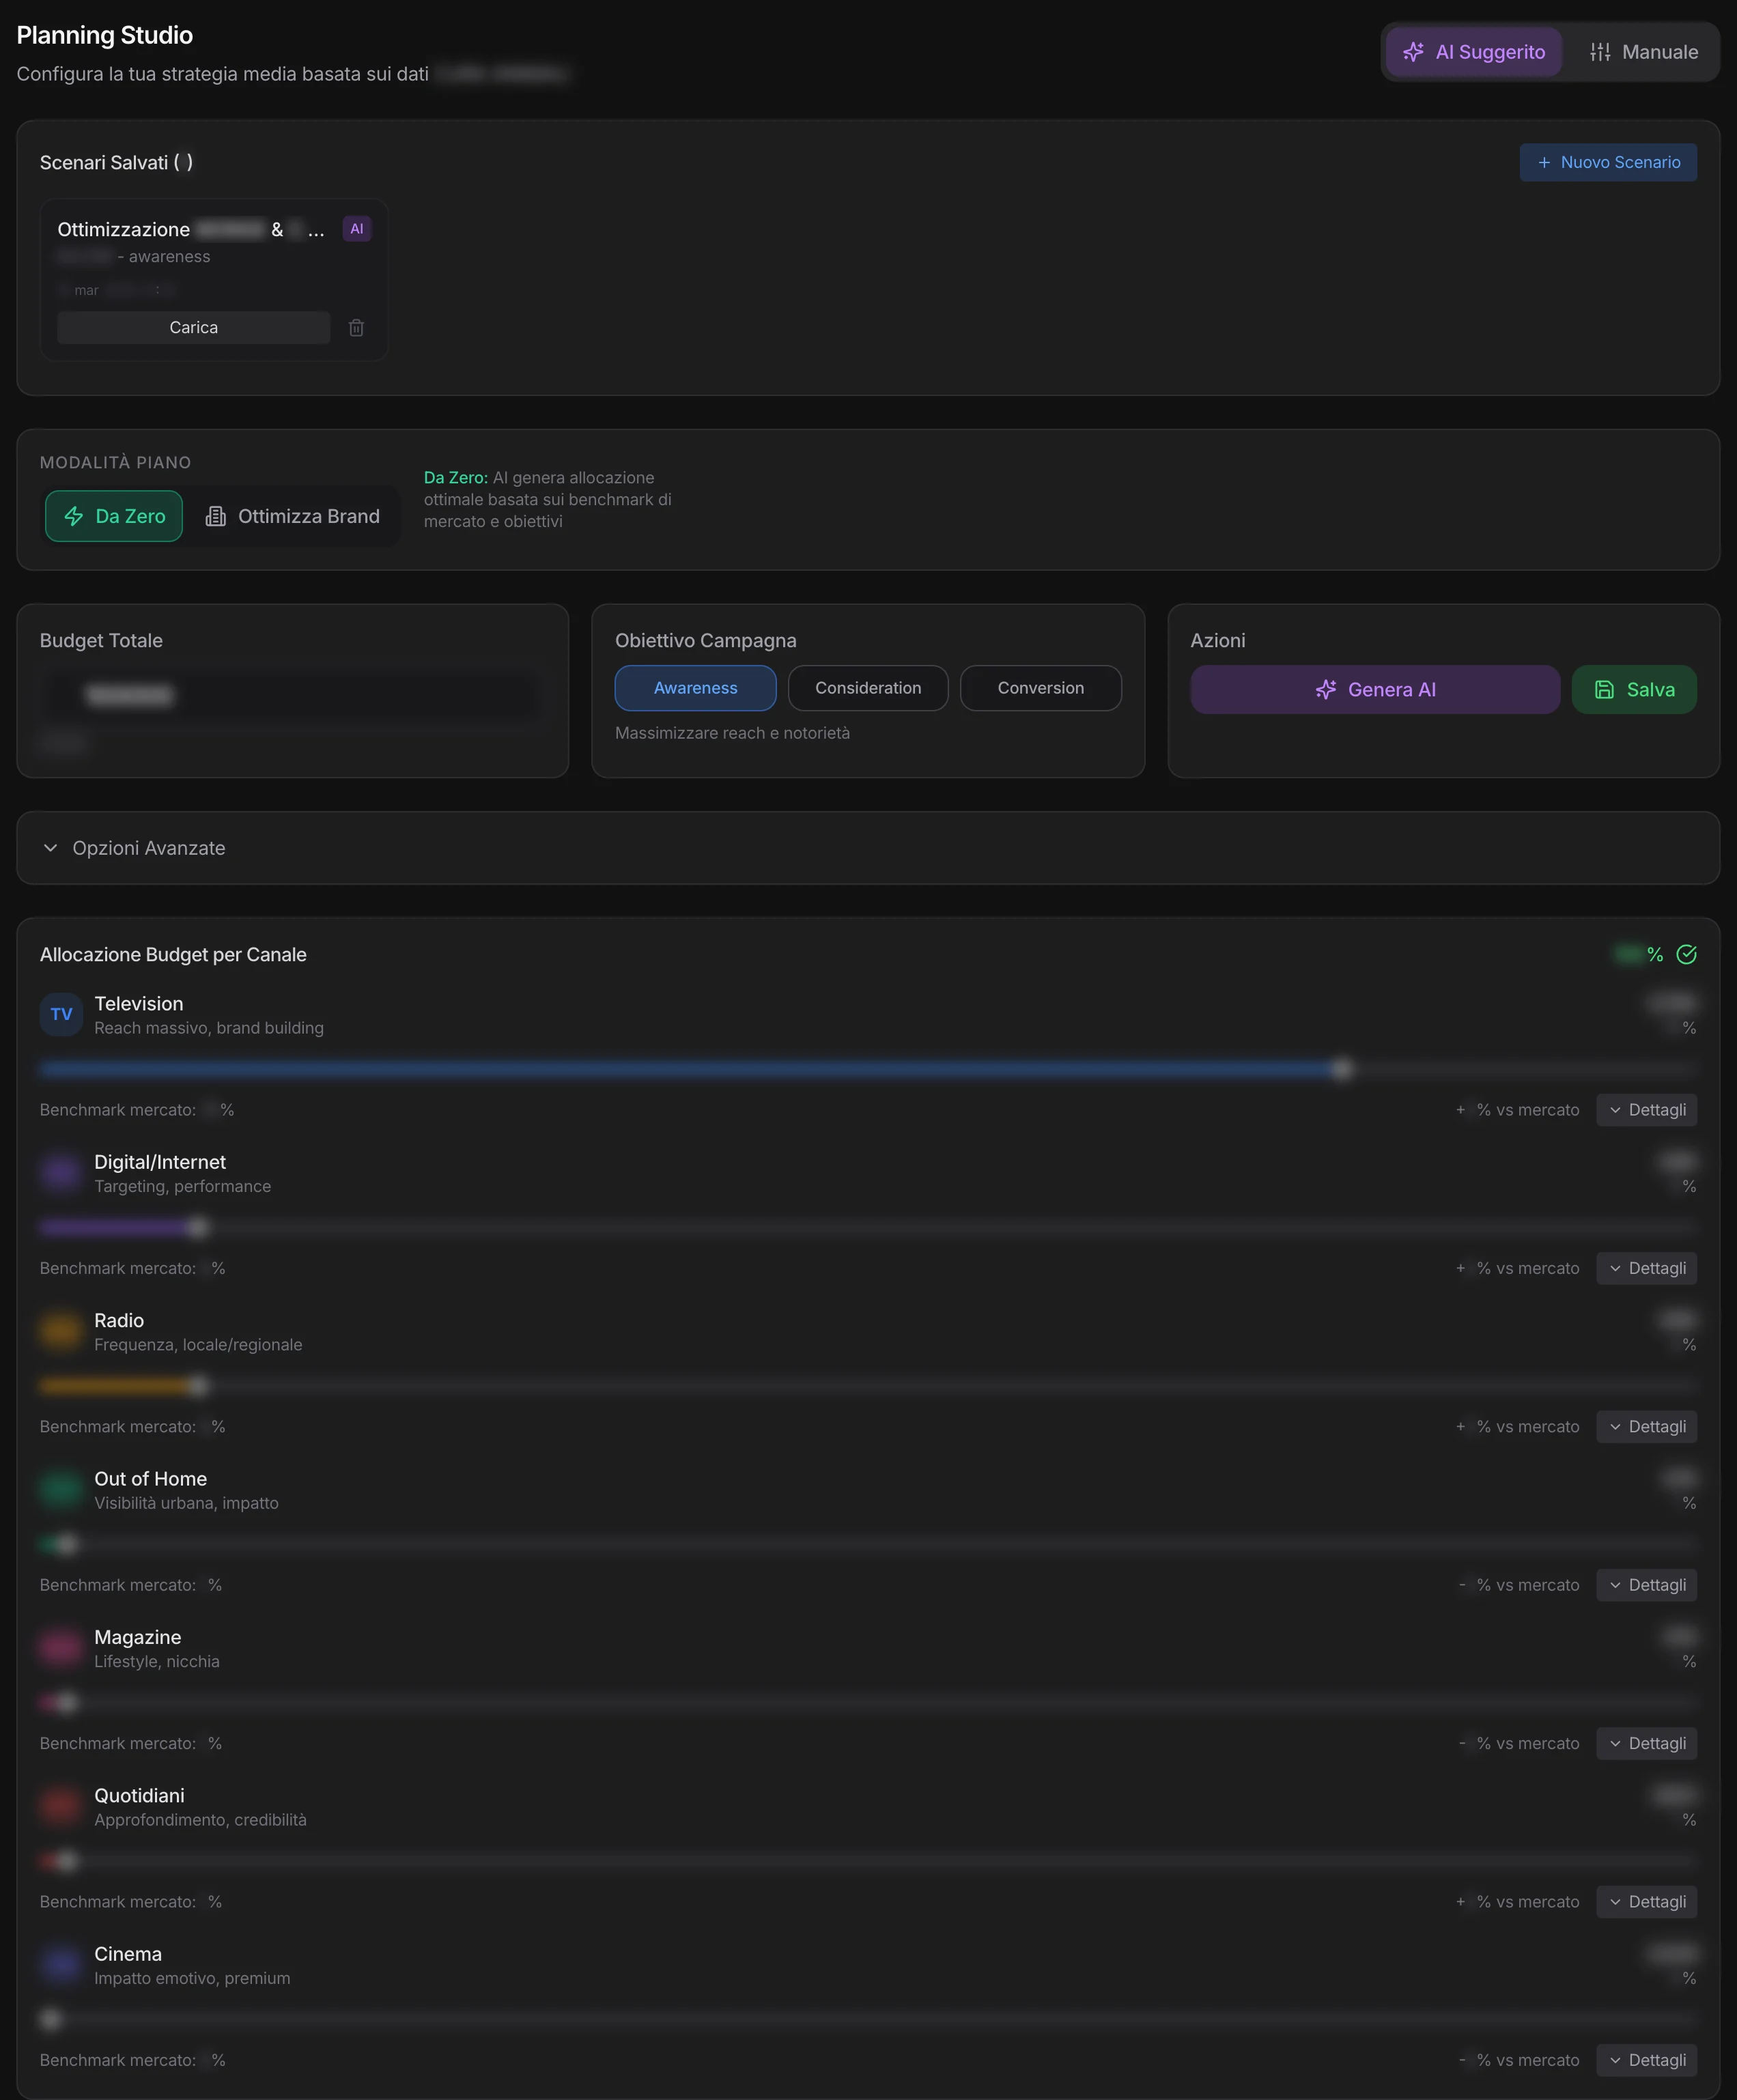
You give the budget and the objective — awareness, consideration, conversion. MAPS proposes how to split it across media, next to what the market does: for each medium, your share and the category benchmark. Start from scratch, or take a brand’s current plan and have it optimized for the new budget.
Ask
what you need to know.
As with sales data, here too you ask in plain words and the answer does the math on the AdQuest data. A real example: “analyze the media mix of the top five competitors and find the opportunities”. The answer puts each one’s mix next to the category’s, finds who relies too heavily on TV, who lags behind on digital, which media nobody covers — and proposes, competitor by competitor, how to rebalance.
From the question to the plan.
Comparison with the category, insights, opportunities for each competitor, the media left open, an overall recommendation. Conversations are saved and can be picked up again.

In B2B too.
Media Planner is also available in B2B projects, next to Web Investment: if your category spends on advertising and you have the AdQuest data, you read it the same way.