
The files you already have.
Or straight from HubSpot.
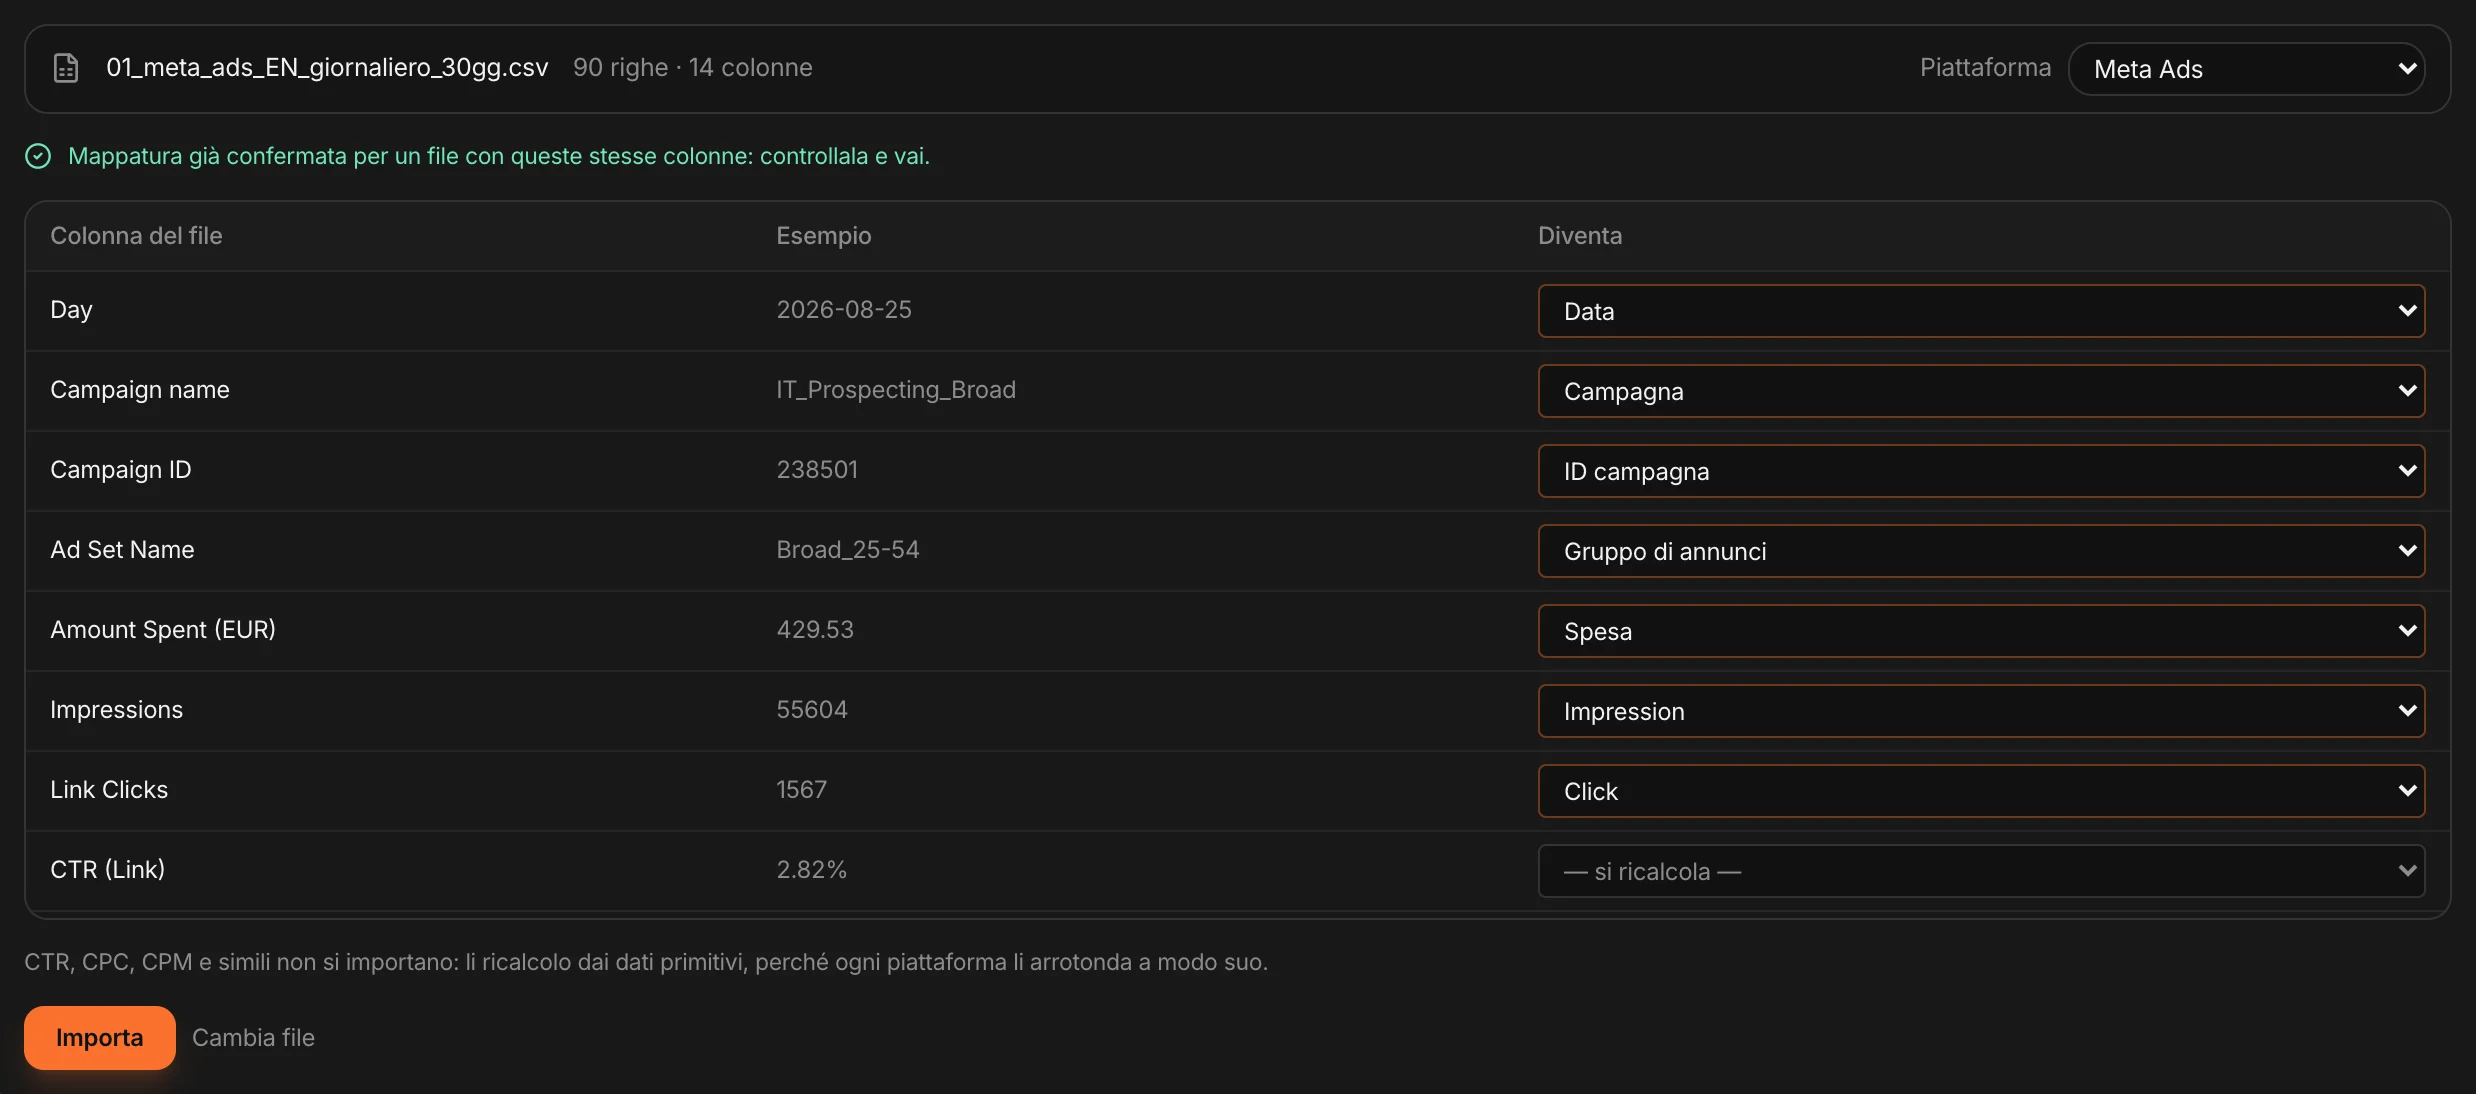
There is no standard export: every platform, every language, every view has its own columns. MAPS recognizes them and suggests what they correspond to; you confirm once, and the mapping is remembered for the next files. CTR, CPC and CPM aren’t imported: they are recalculated from the base data, because every platform rounds them its own way.
What’s in the project.
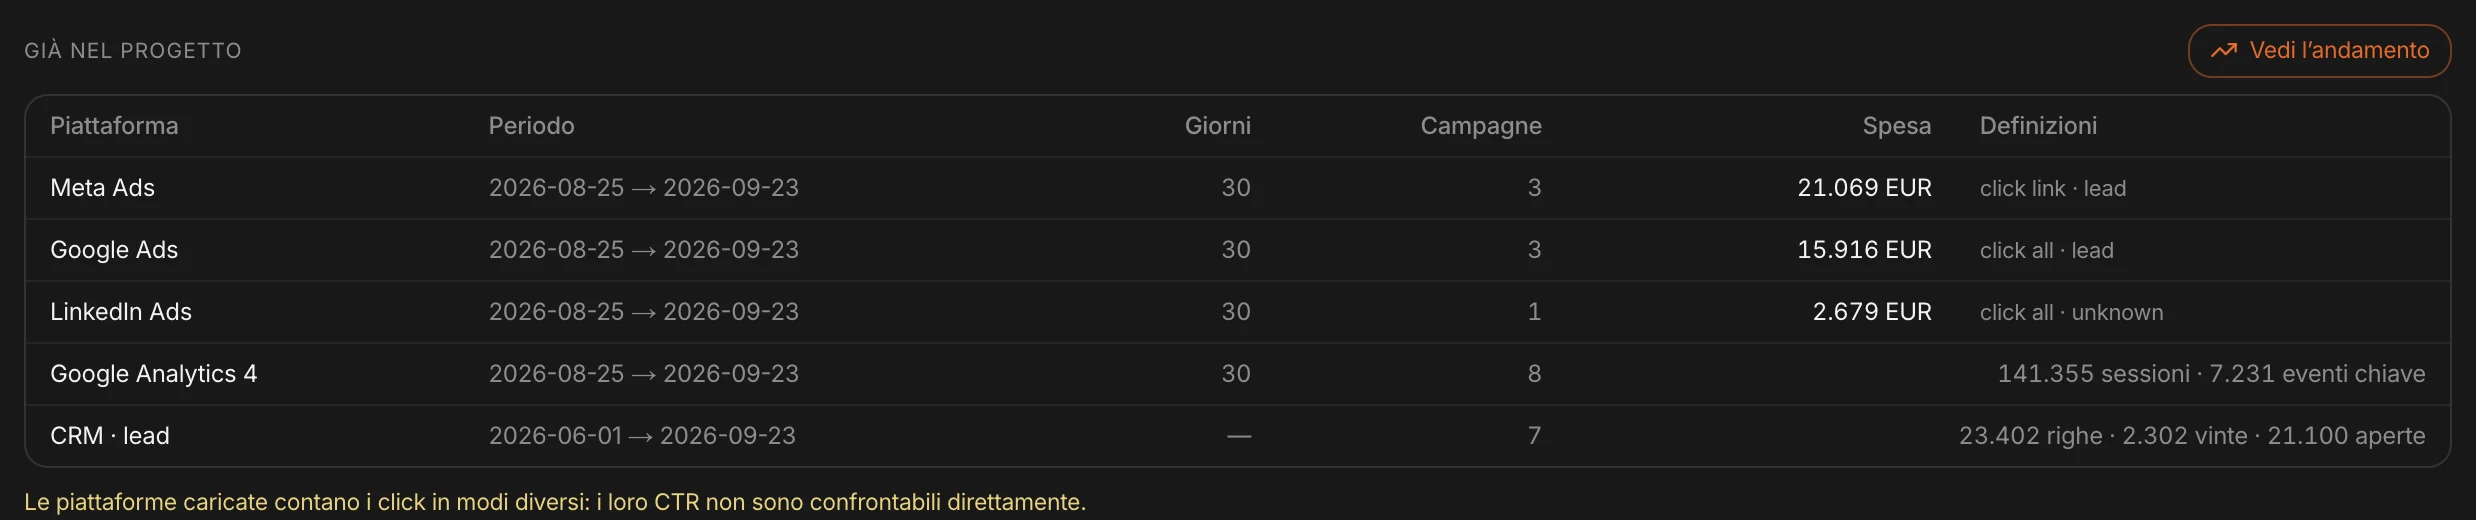
For each source the period, the campaigns, the spend, and how it counts clicks and results. If two platforms count clicks differently, MAPS tells you before you compare them. If you upload the same period again, the most recent data wins — and reattributed conversions are visible.
Outcomes, from HubSpot.
Lead outcomes — who became a customer, who closed a deal — come from the CRM file or straight from HubSpot. MAPS reads only dates, status, source and value: emails and names are never requested. Outcomes are linked to campaigns, never to people.


Why it changed.
Not just how much.
Choose the period and the platform: MAPS compares with the previous period and, when the cost per result really moves, breaks it down — how much comes from the cost per click, how much from conversion; whether campaign performance changed or only where the budget goes. These are mathematical identities, not estimates. And below 5% it tells you it’s noise, and not to touch anything.
After the click.
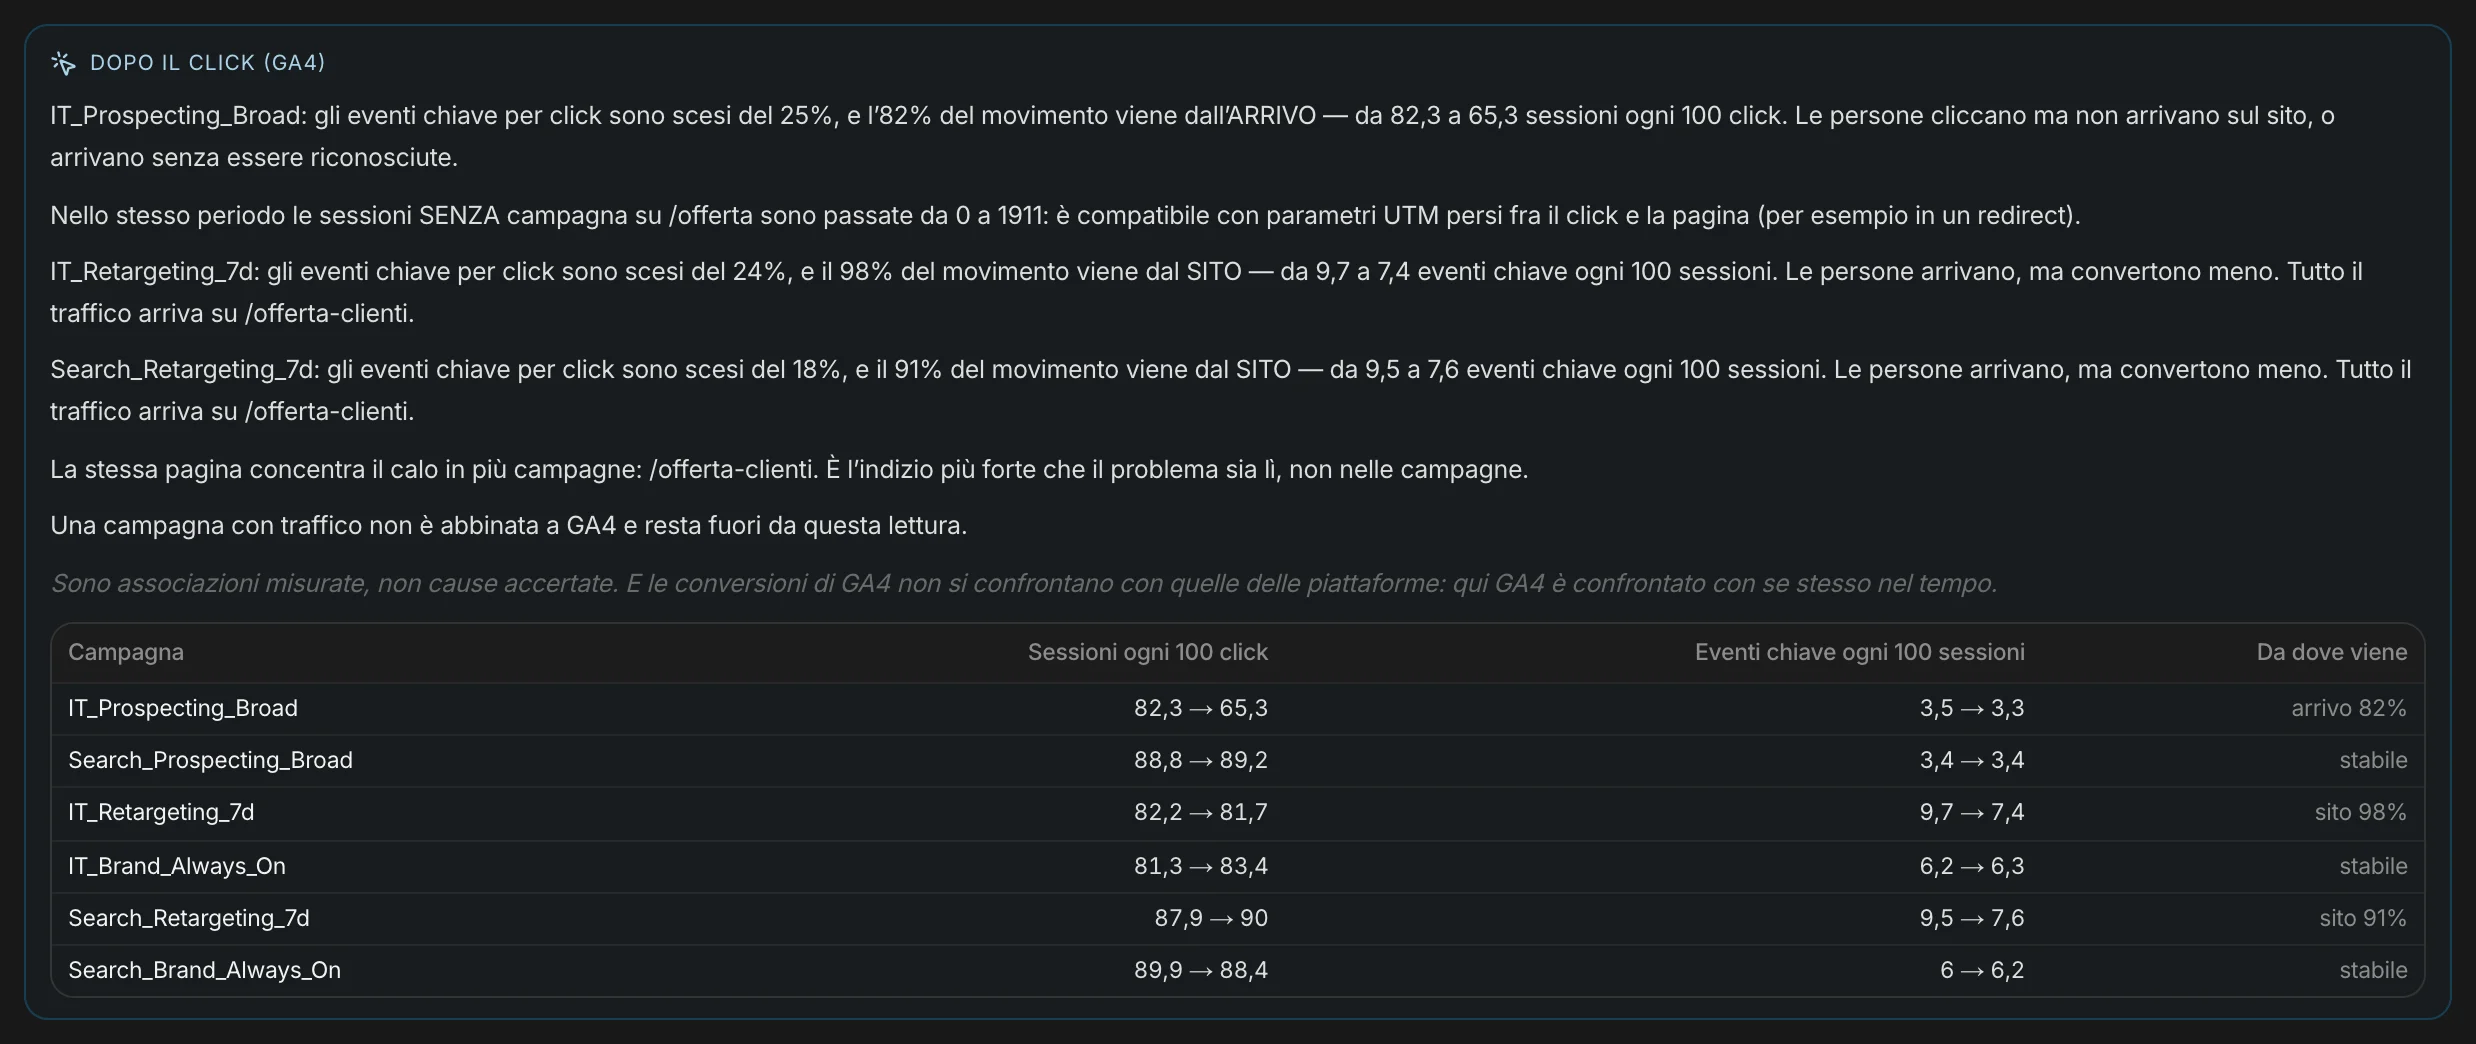
With GA4, MAPS follows people beyond the ad and separates two opposite problems: those who click and never reach the site — often parameters lost in a redirect — and those who arrive and don’t convert. If the drop is concentrated on one page, it points to it.
“These are measured associations, not established causes”: MAPS says so itself.
The cheapest lead
isn’t the cheapest customer.
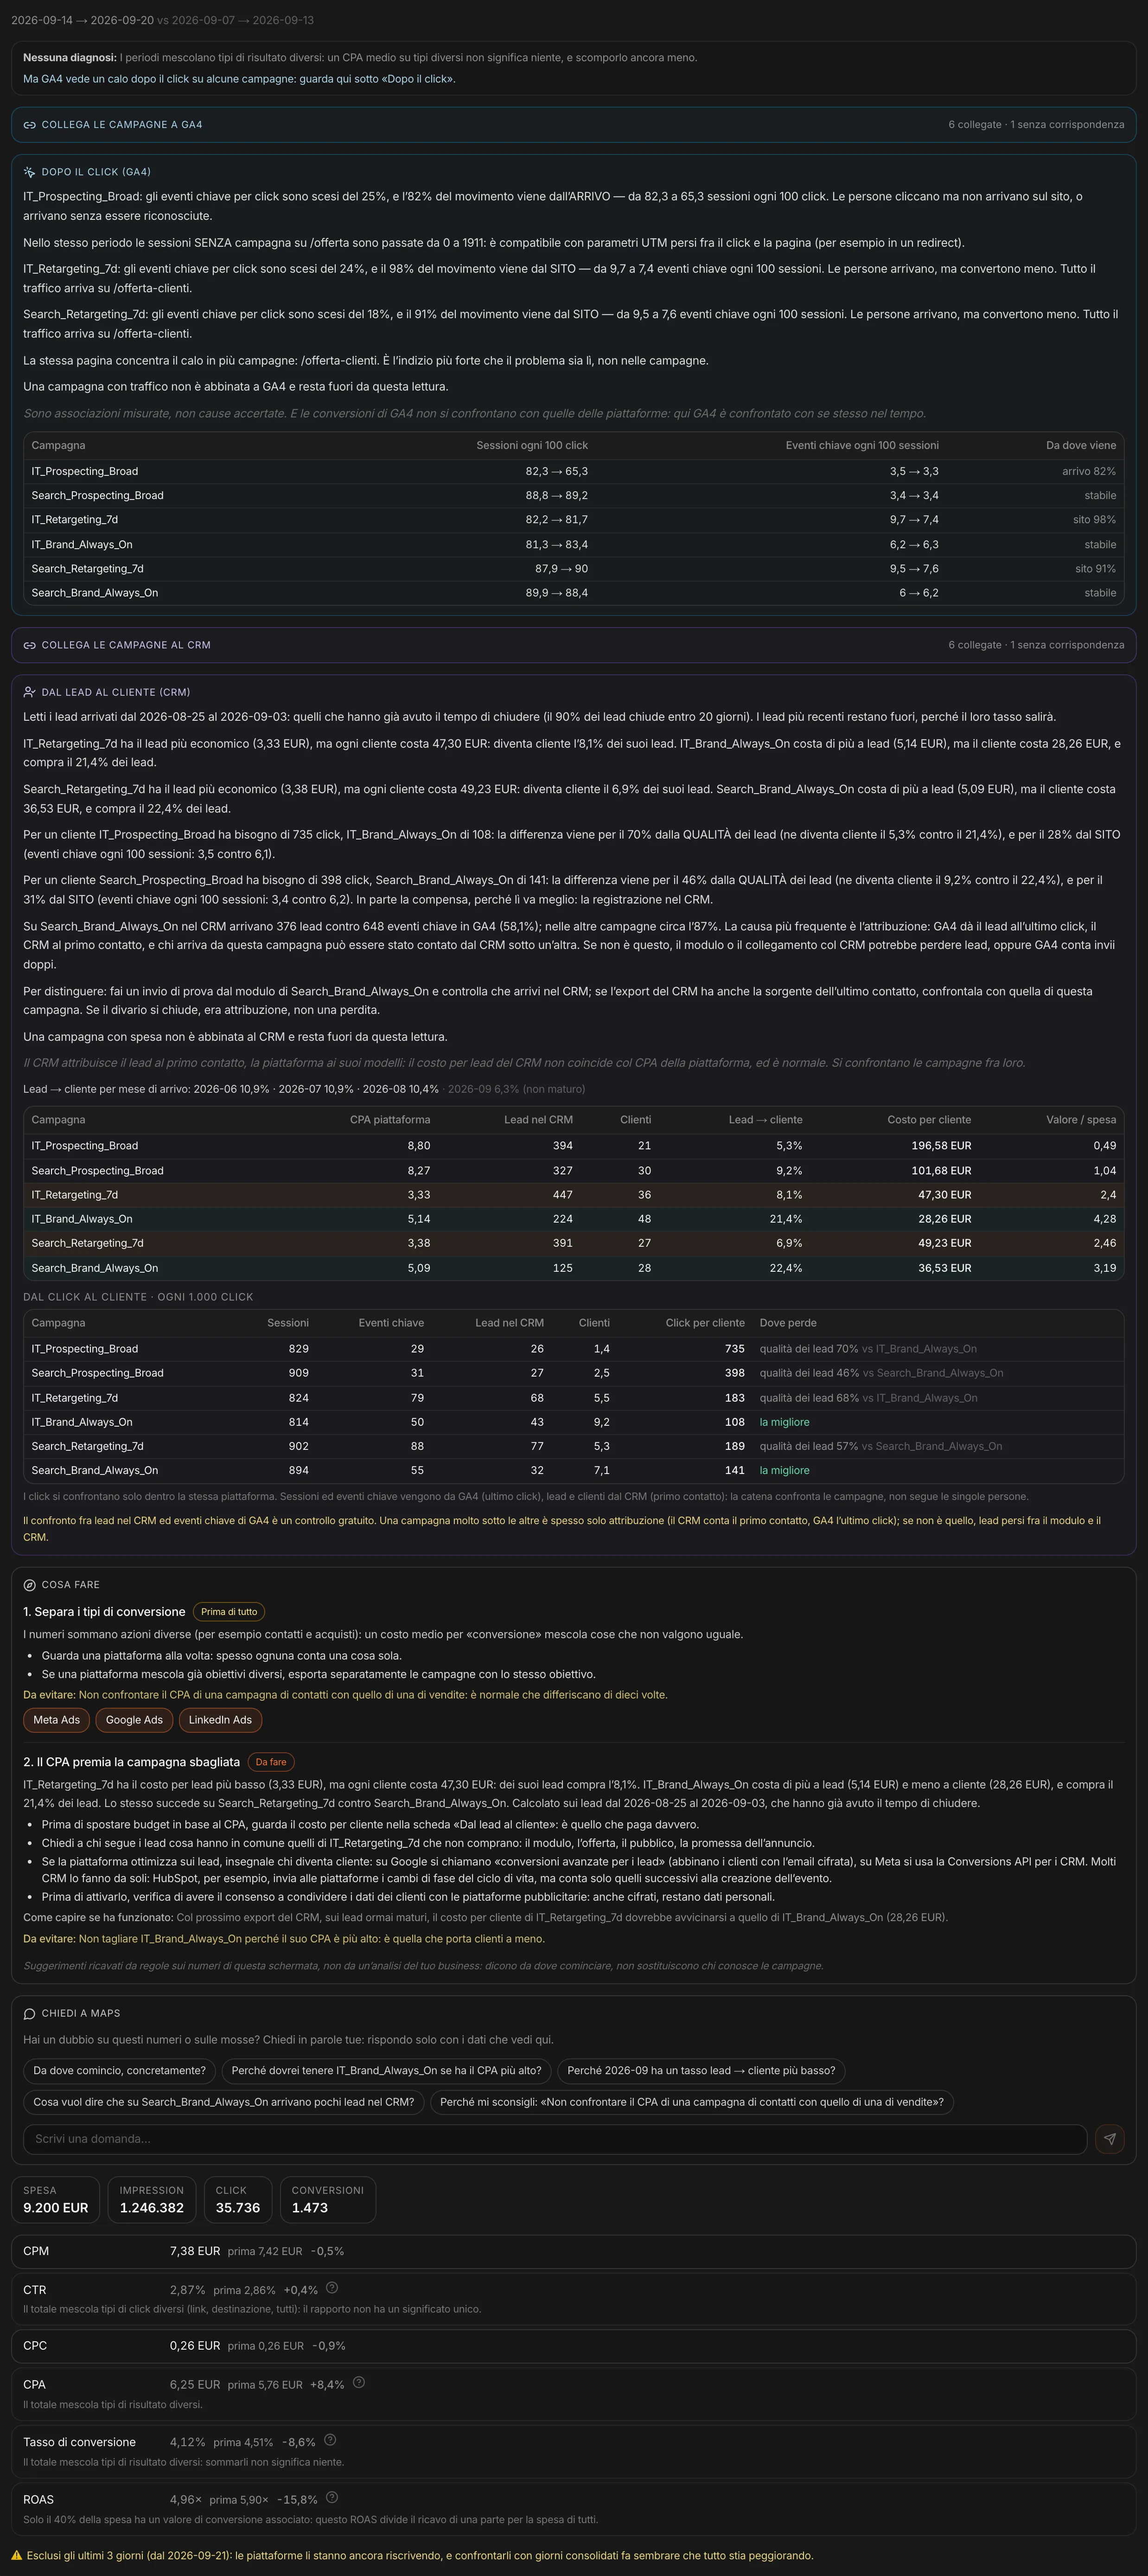
With CRM outcomes, MAPS looks at what a customer really costs, campaign by campaign — only on leads that have had time to close. And for every thousand clicks it follows the chain: sessions, actions on the site, leads, customers, and where each campaign loses ground compared with the best one.
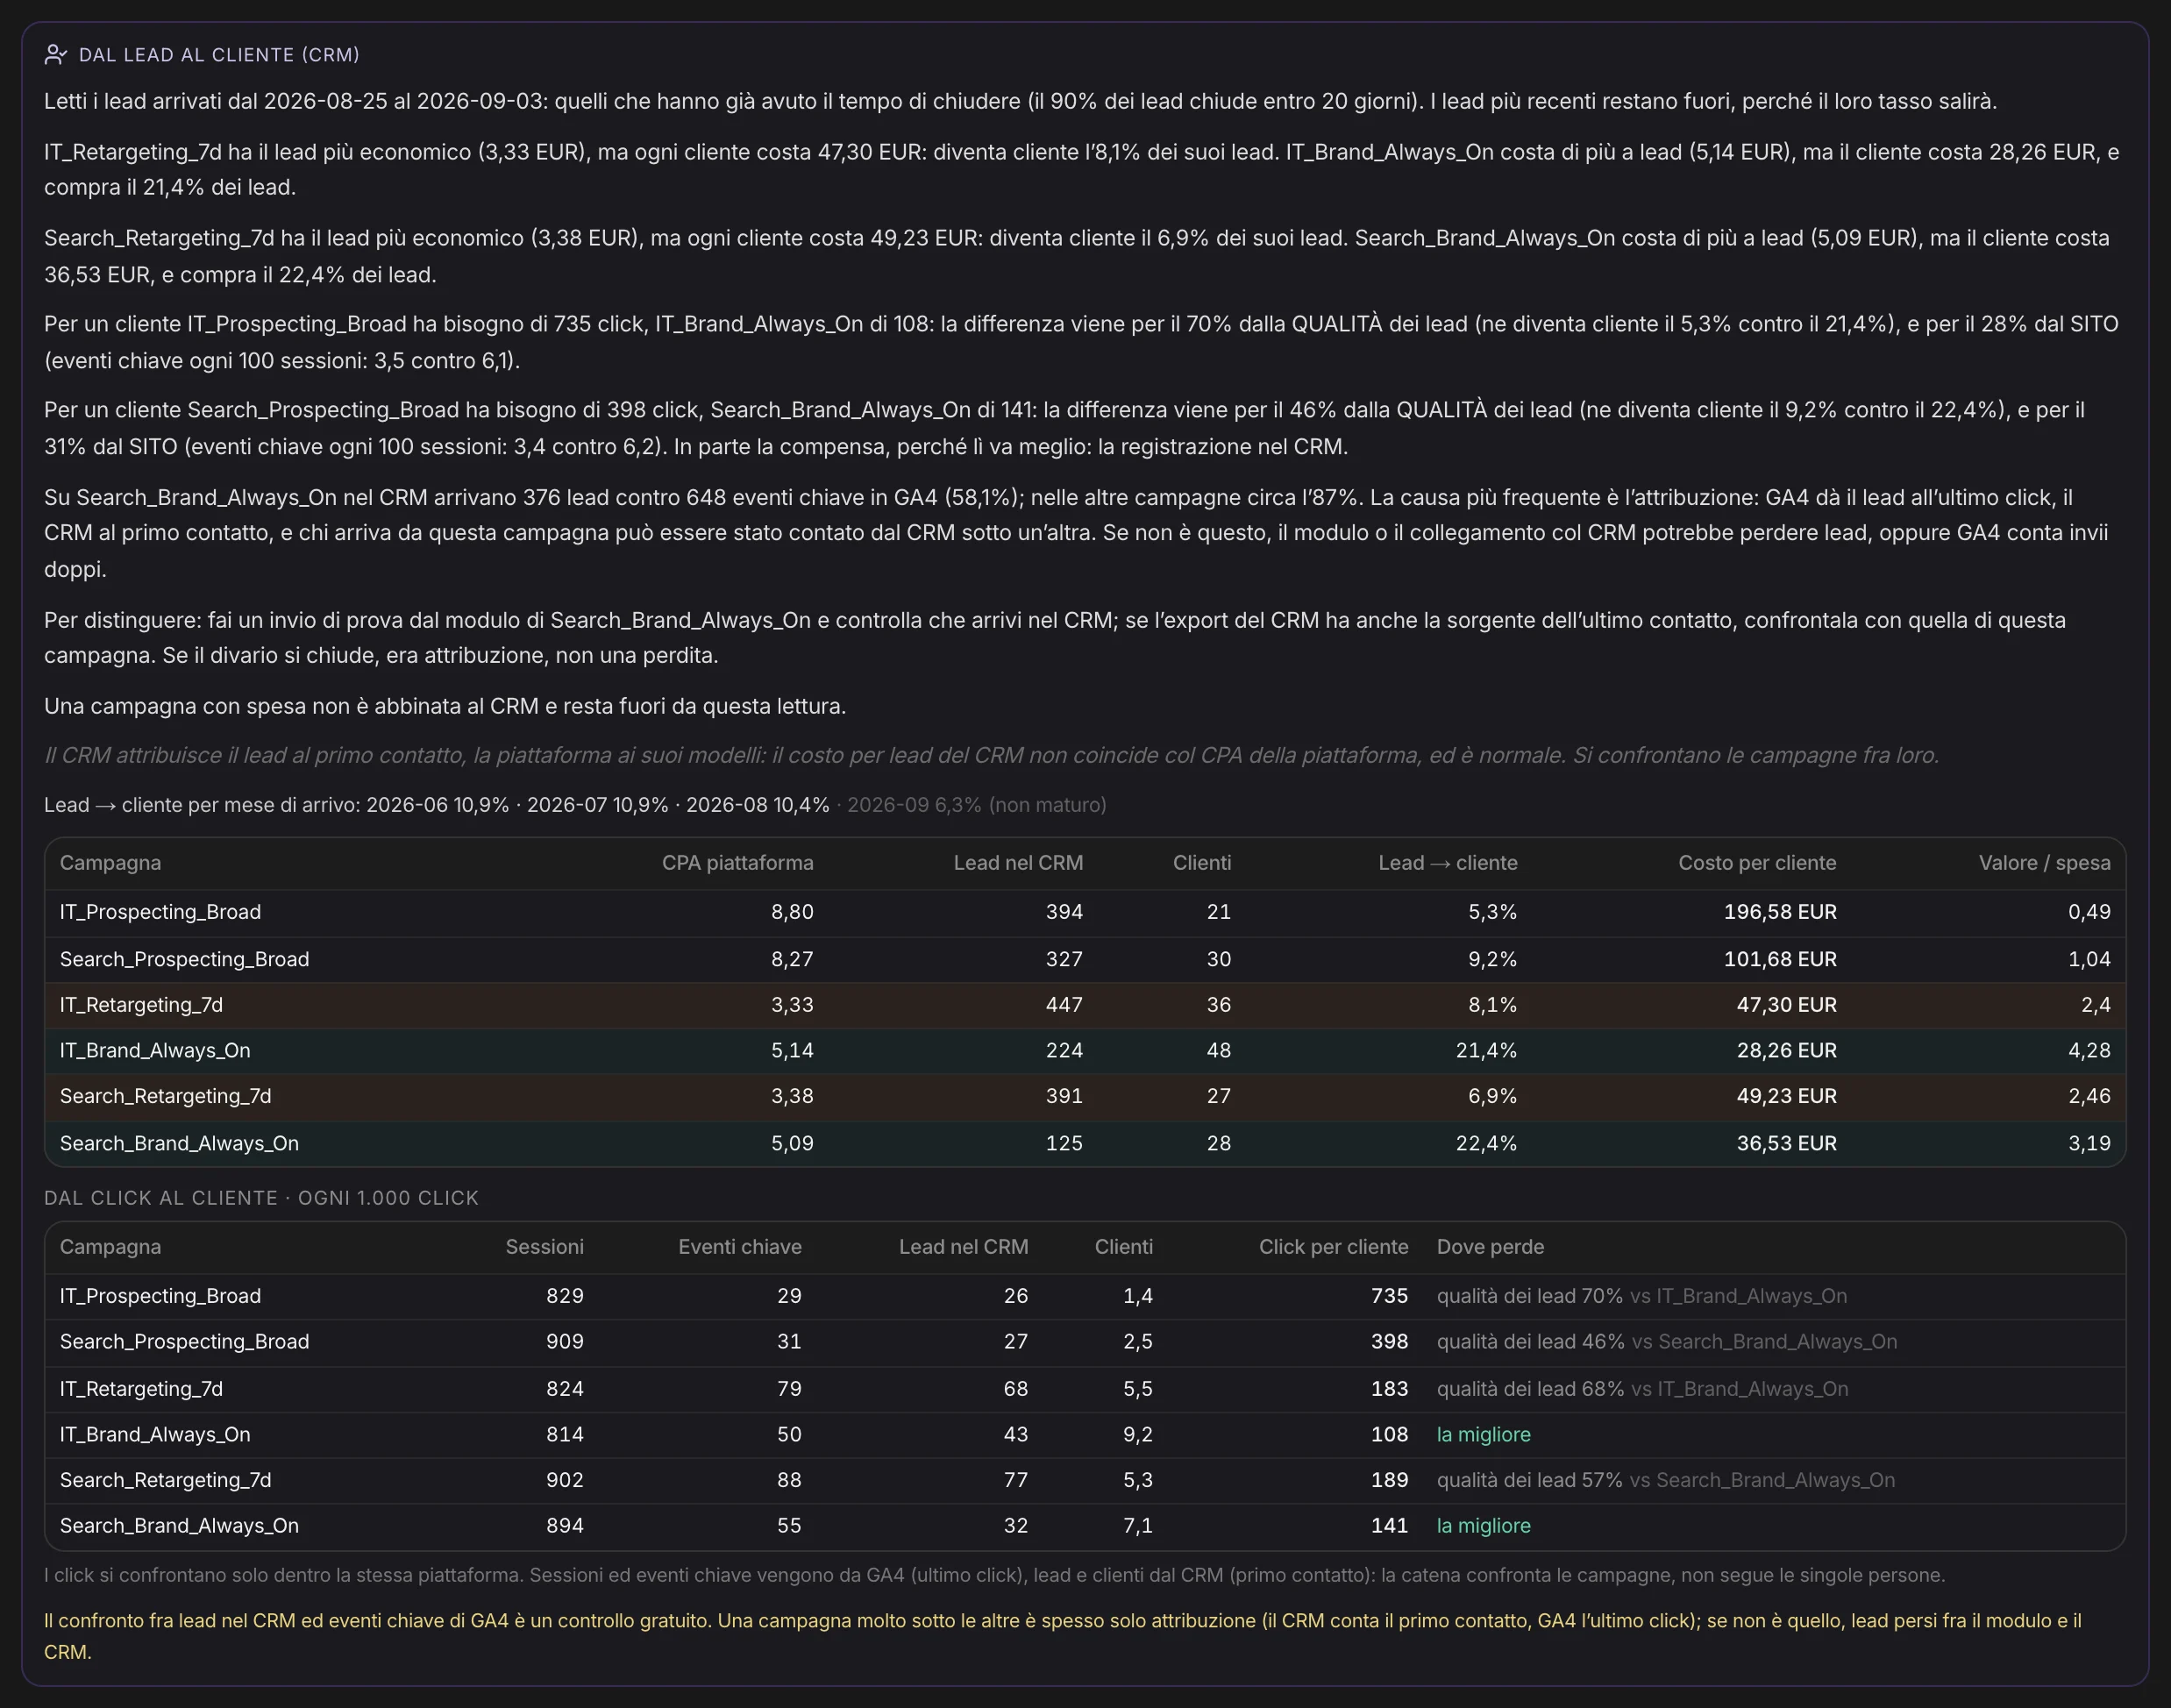
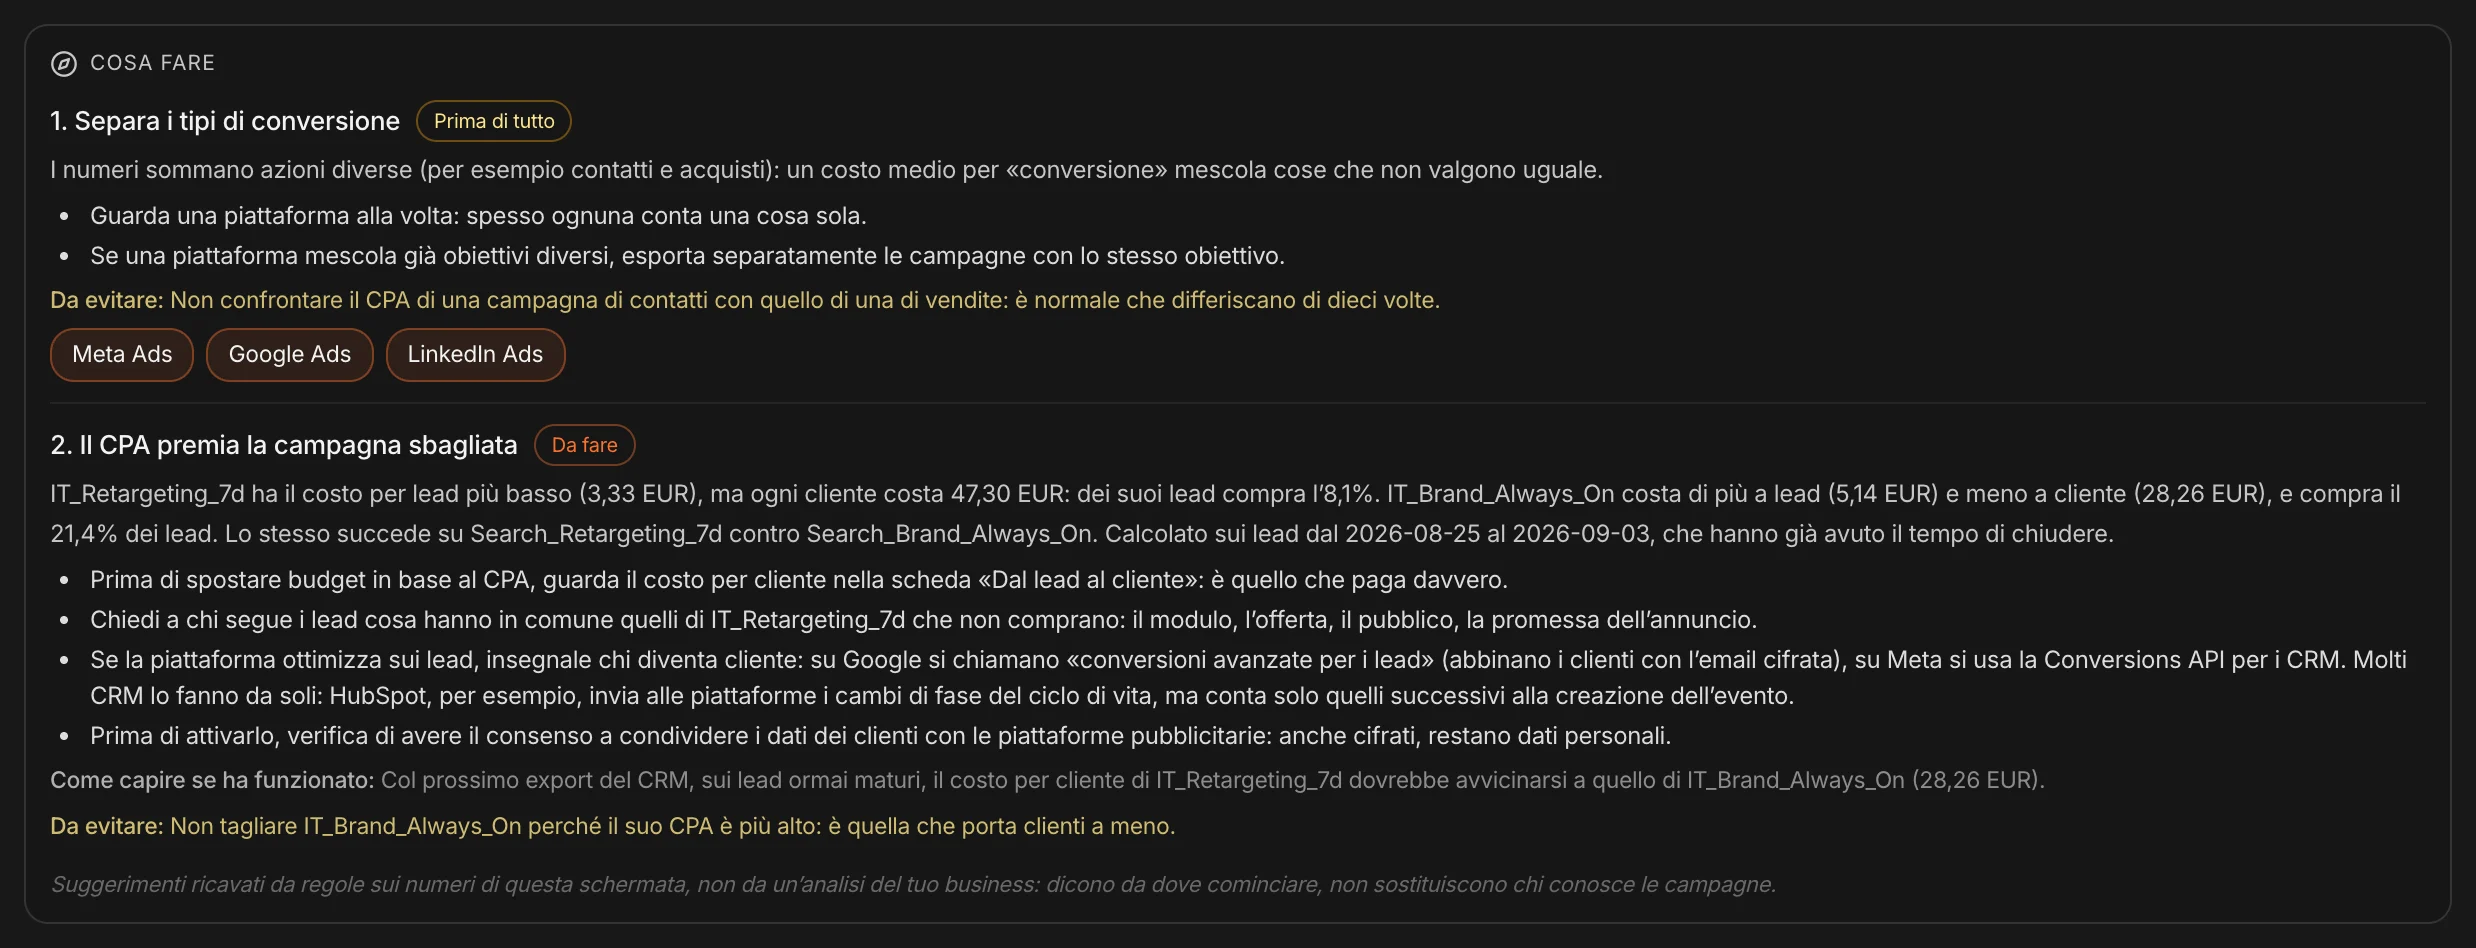
In the example, the campaign with the cheapest lead has a customer almost twice as expensive as the one that looked costly. Optimizing on cost per lead, you would cut exactly the campaign that brings customers.
Three moves at most.
With a way to check them.
For people who aren’t campaign experts: what to do first, why, the concrete steps, how to tell if it worked, and what to avoid. The moves come from rules applied to the numbers on screen, and they say so: they show where to start, they don’t replace someone who knows campaigns.
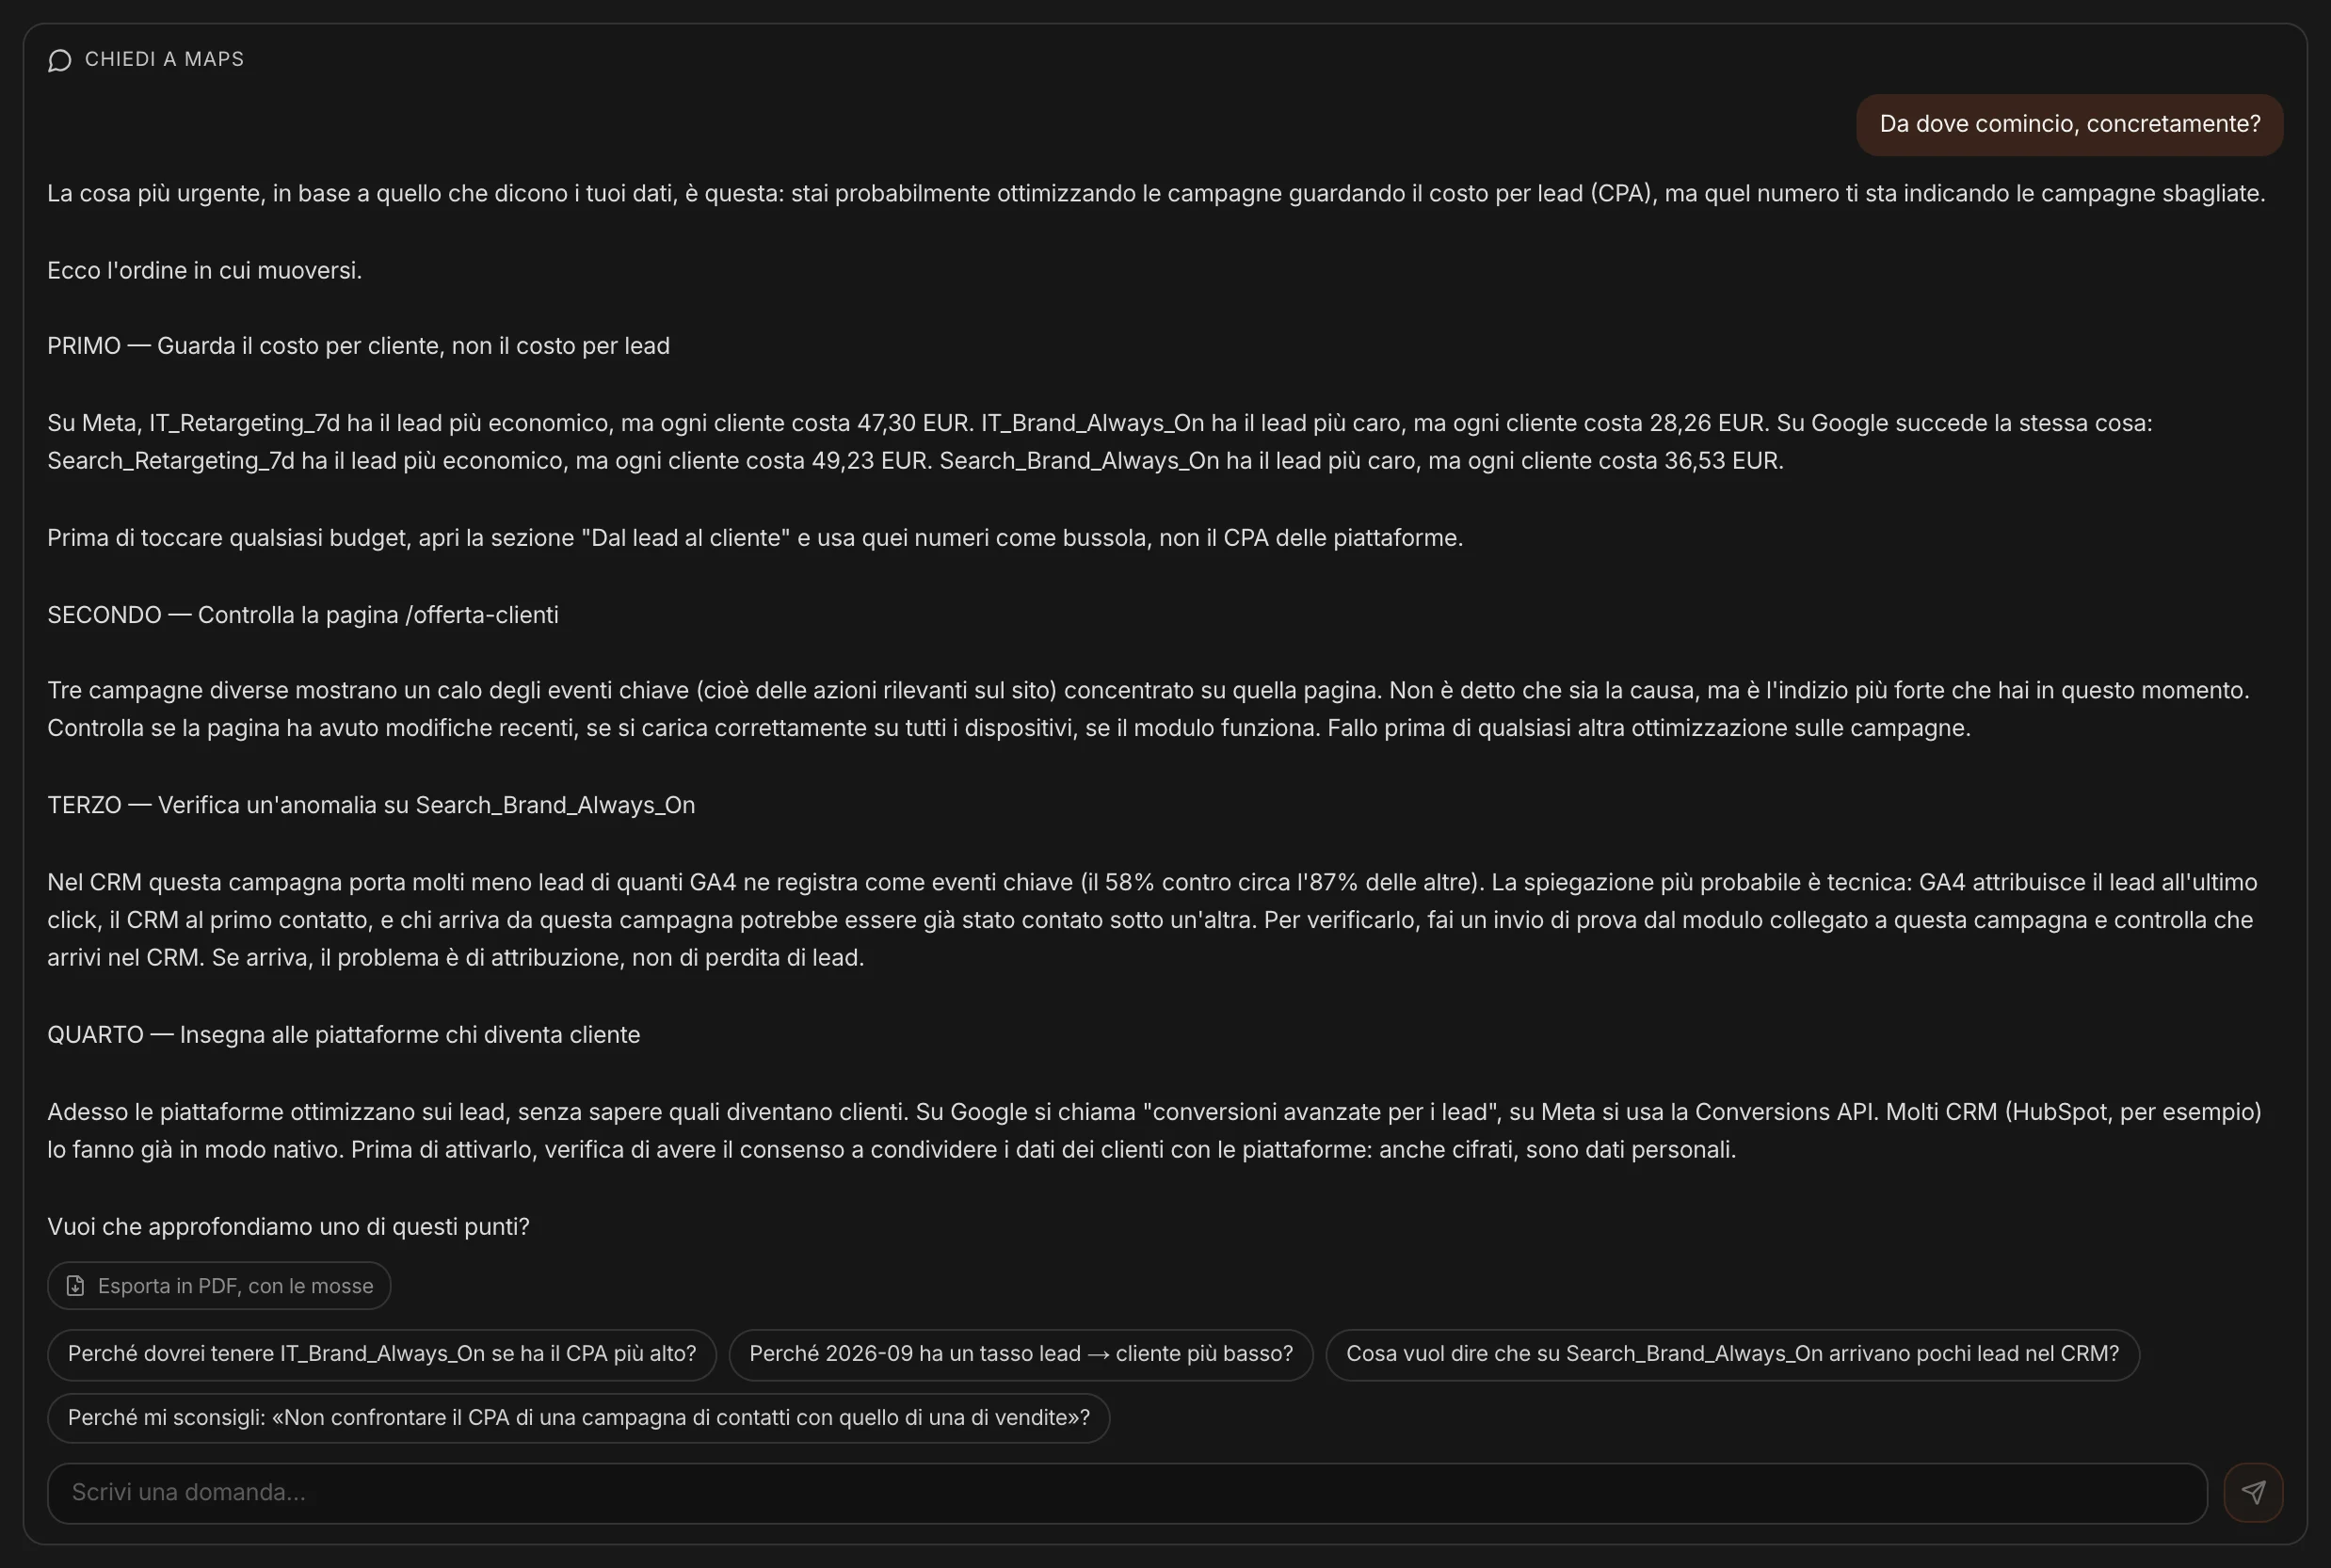
“Where do I start,
in practice?”
The suggested questions come from your numbers; or write your own. The answer uses only the data you see on screen — no assumptions about the audience or the site — and can be exported to PDF together with the moves.
One screen,
from the ad to the customer.
Consumer and B2B
In B2C the outcomes are purchases; in B2B they are deals won, lost, open.
In English and in Italian
Exports are read in any language; the reading comes in the language of the interface.
Honest about its limits
A file aggregated over the period doesn’t allow you to read trends: MAPS says so, and asks for the daily breakdown.