
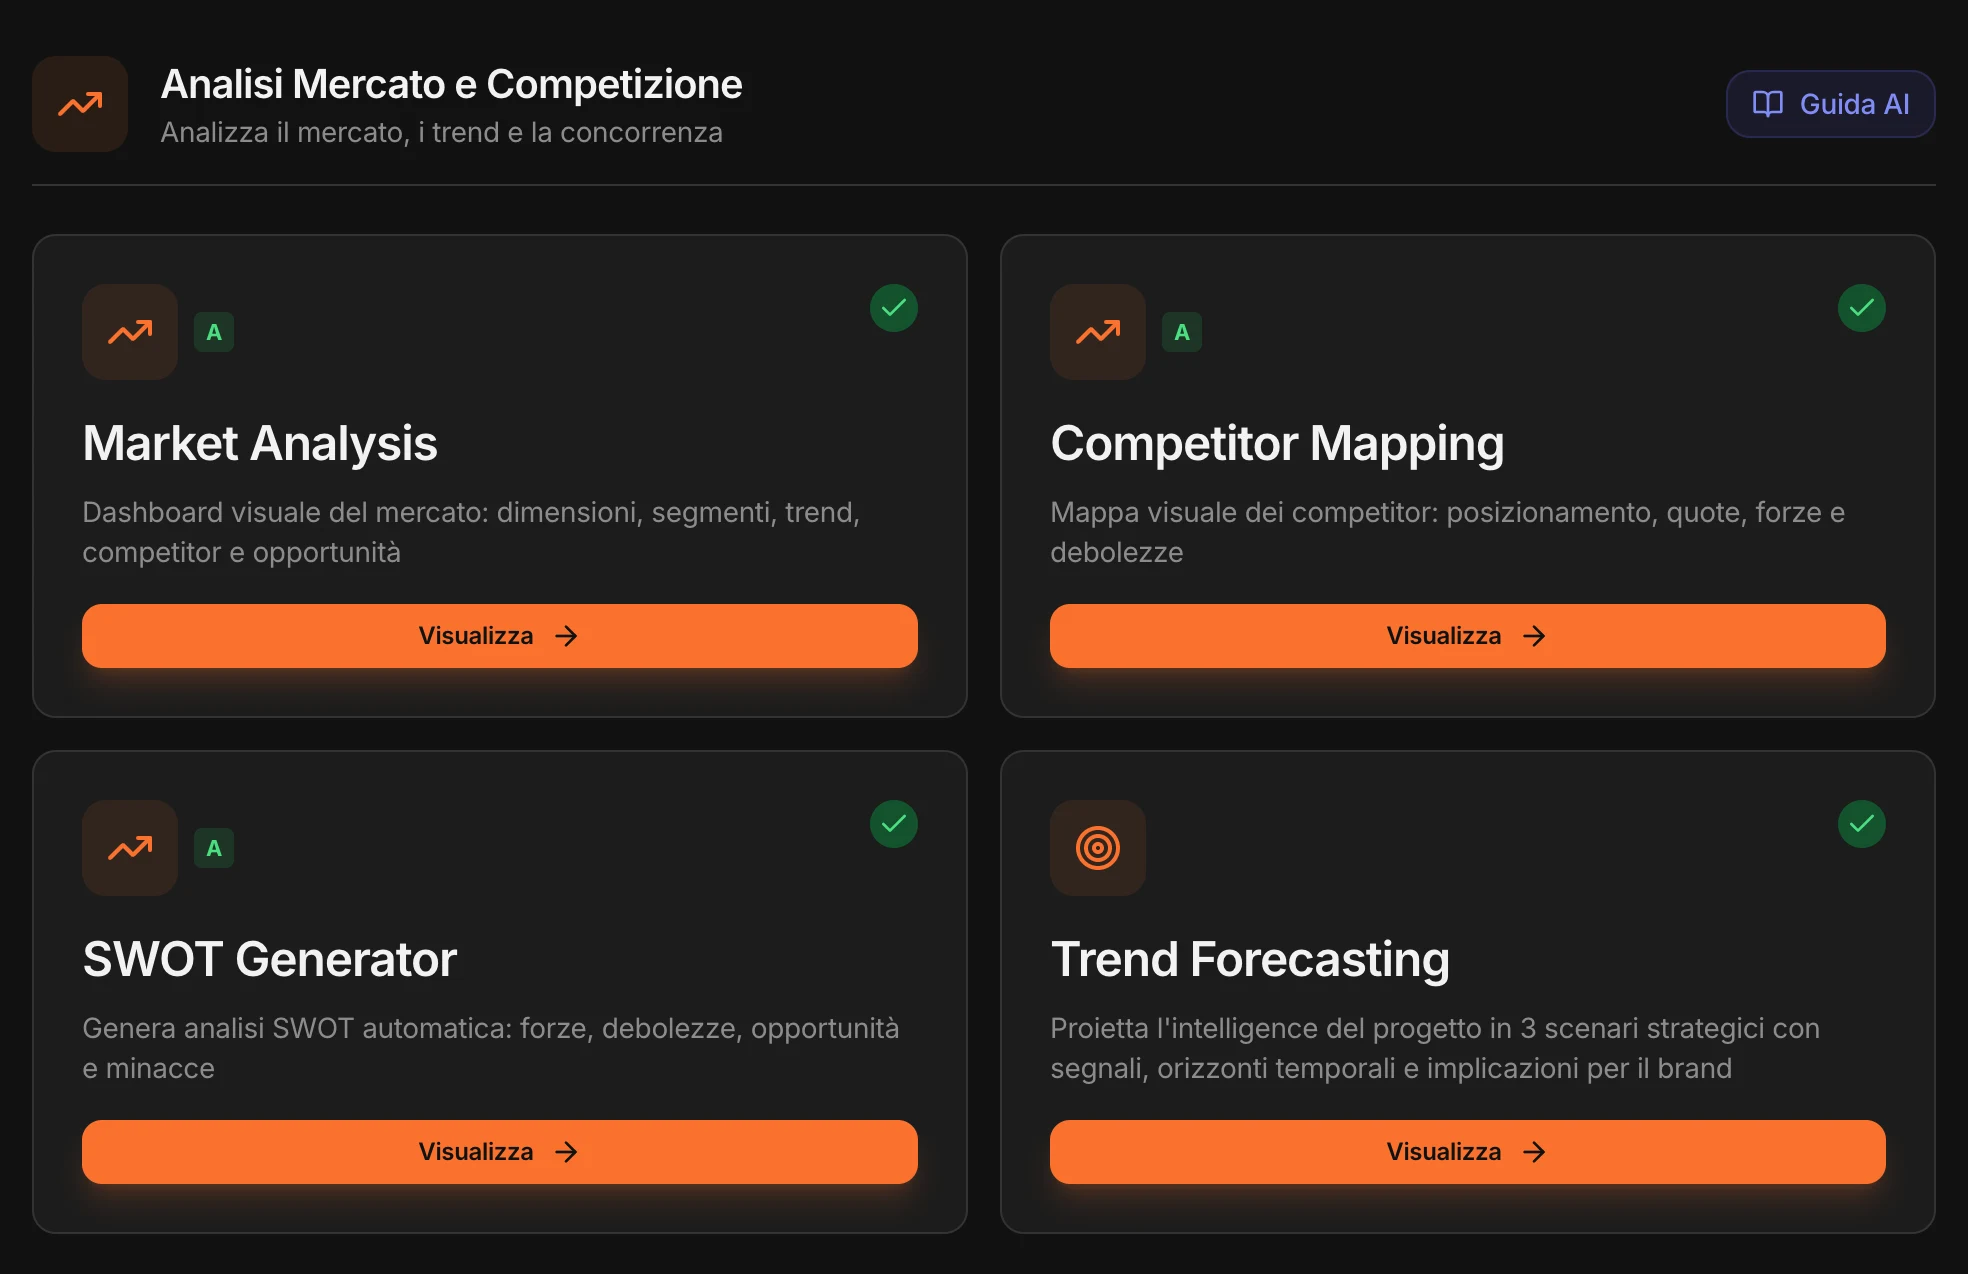
The market on one page.
Including what isn’t known.
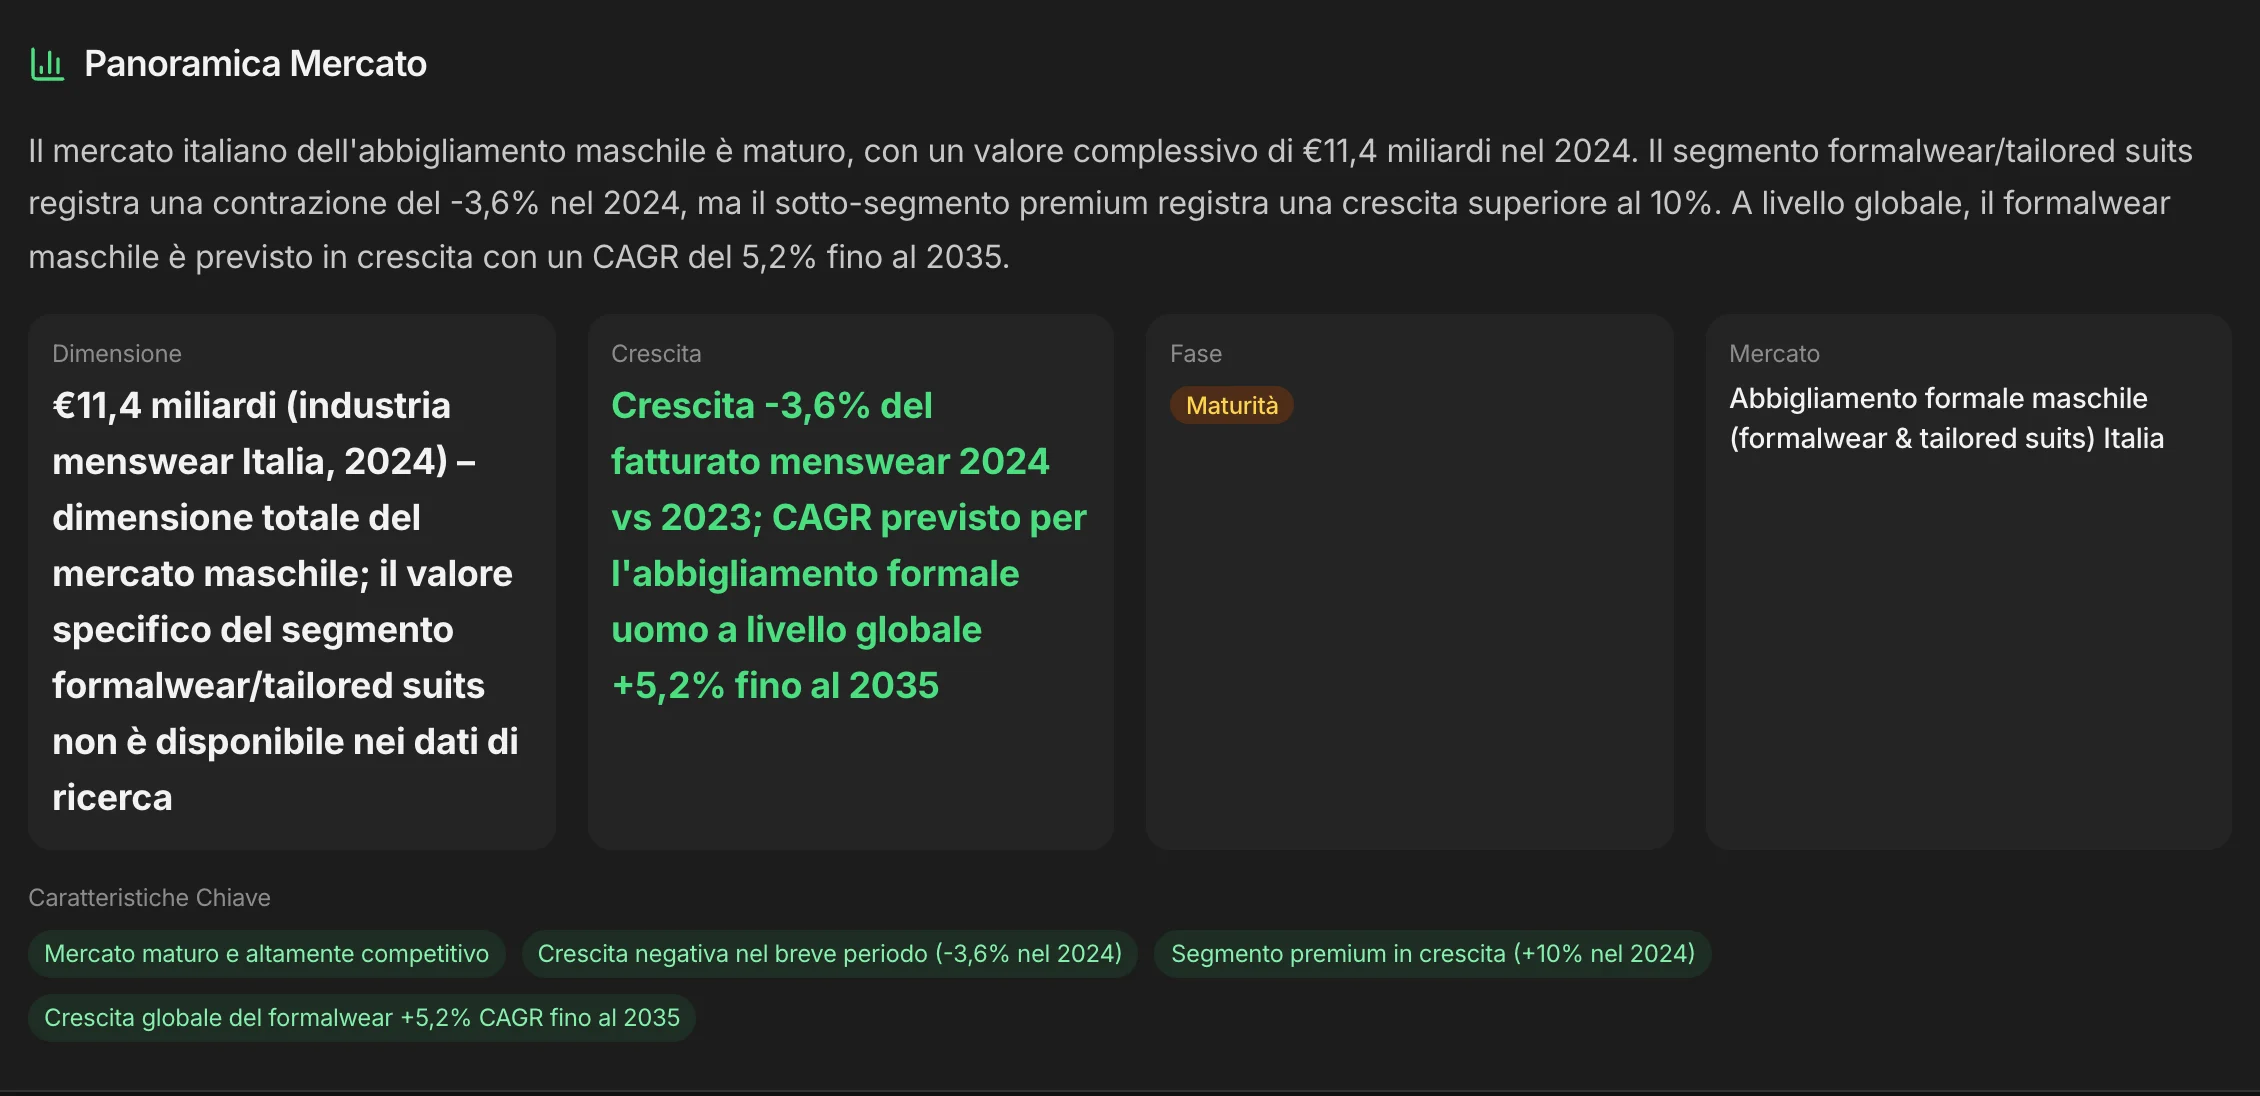
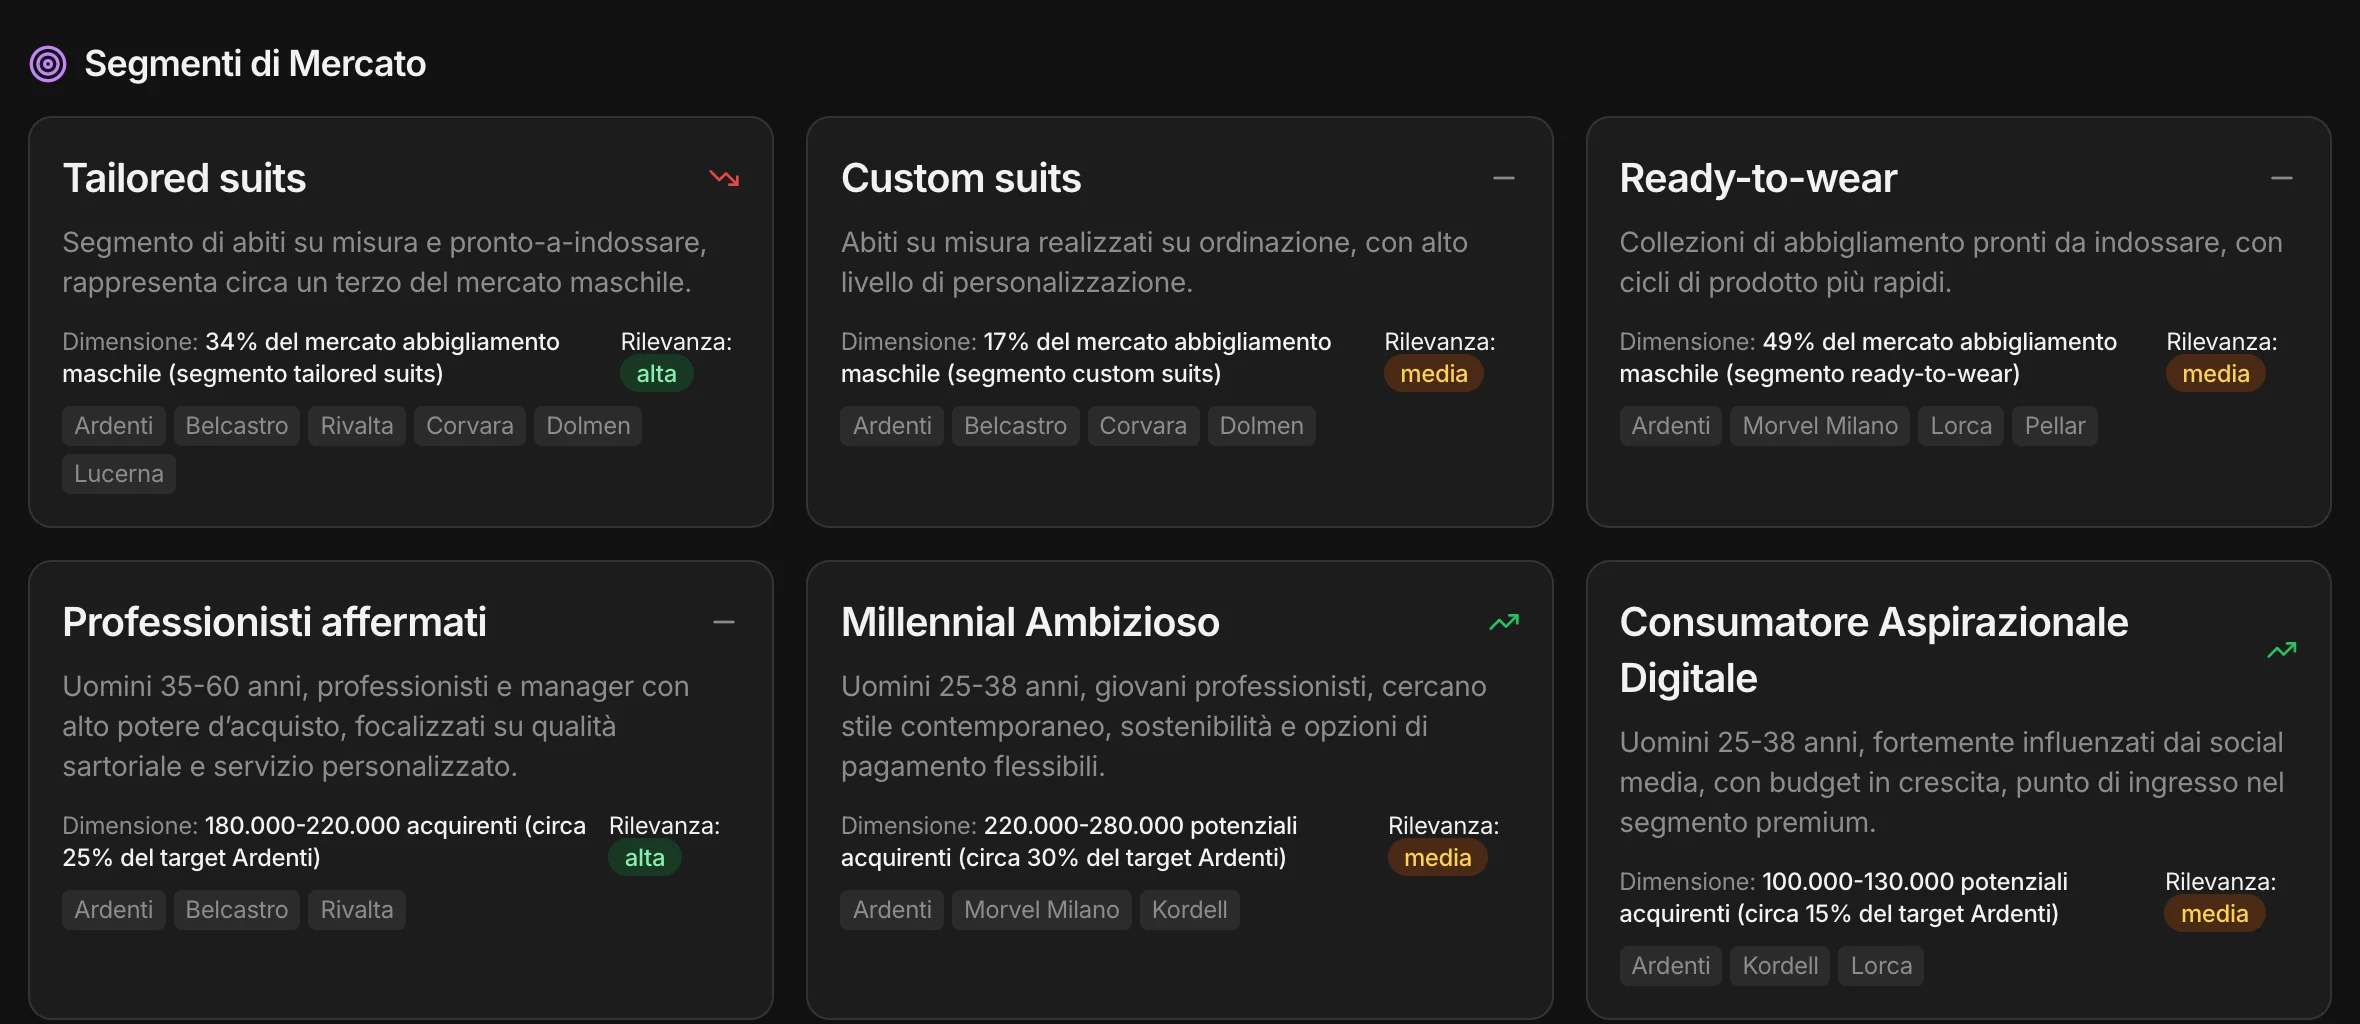
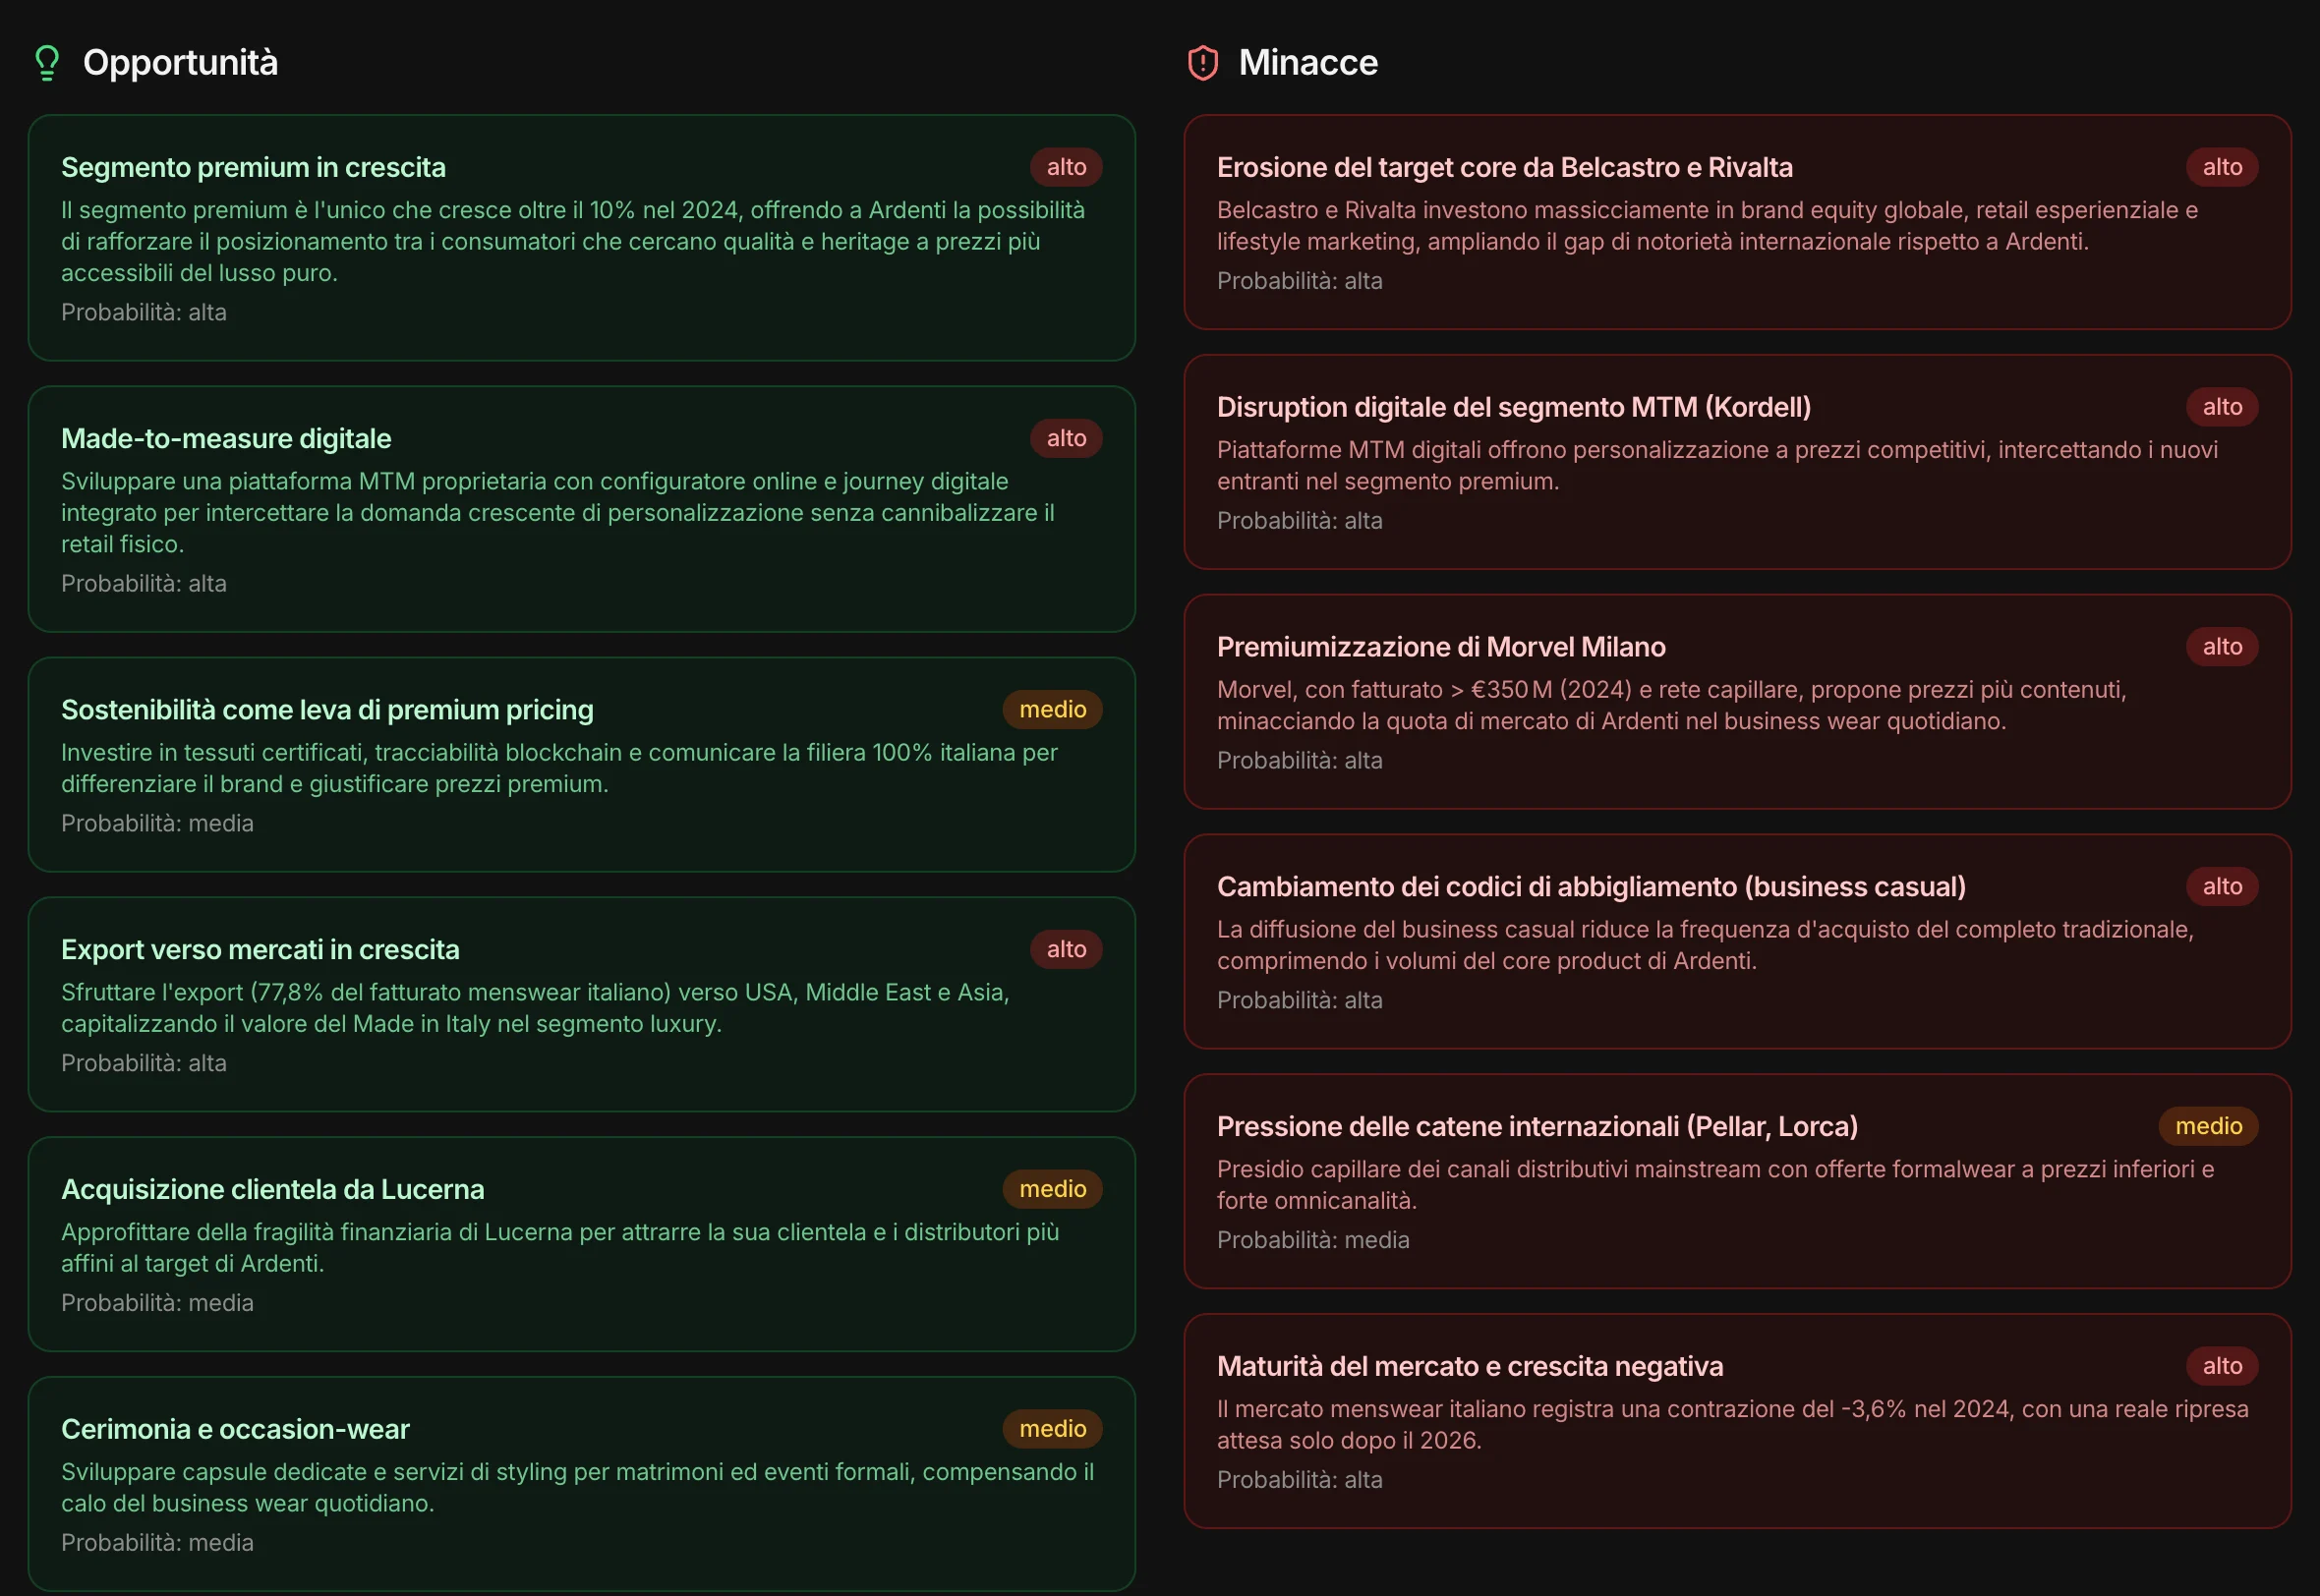
Size, growth, market stage; the segments, by product and by customer, with the brands that hold them; the trends, the channels, the opportunities and threats, the success factors. And when a number isn’t there, it says so.
Not a list of competitors.
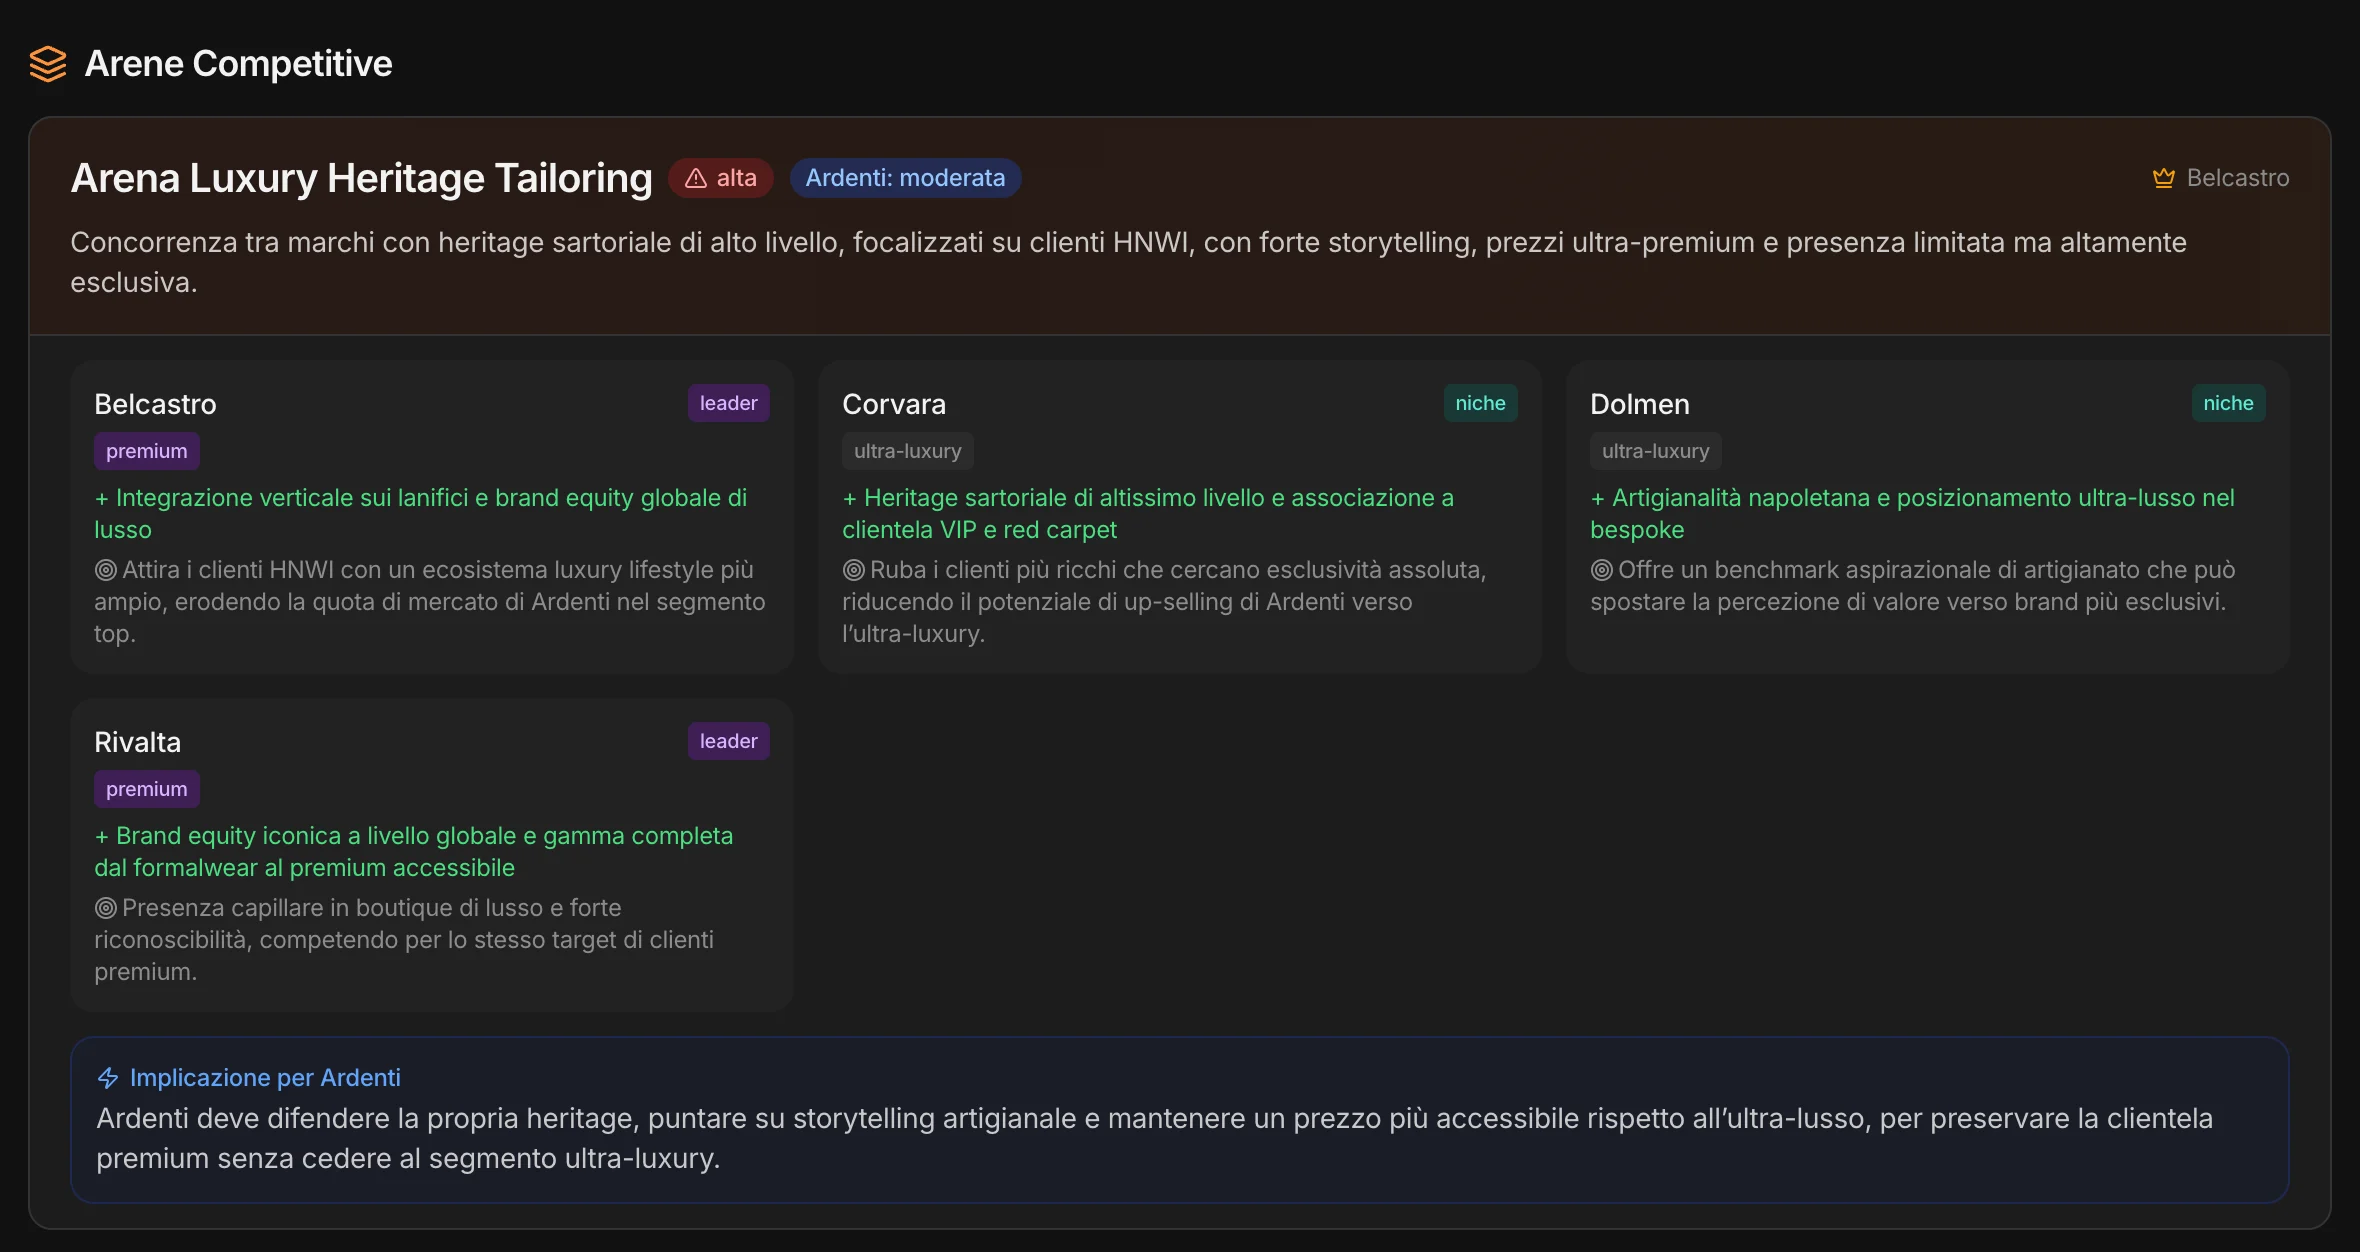
The arenas you play in.
You don’t compete with everyone in the same way. MAPS divides the market into arenas — tailored luxury, premium business wear, digital made-to-measure, ceremonywear — and for each one it tells you who leads, who’s chasing, how intense the contest is and what it means for you.
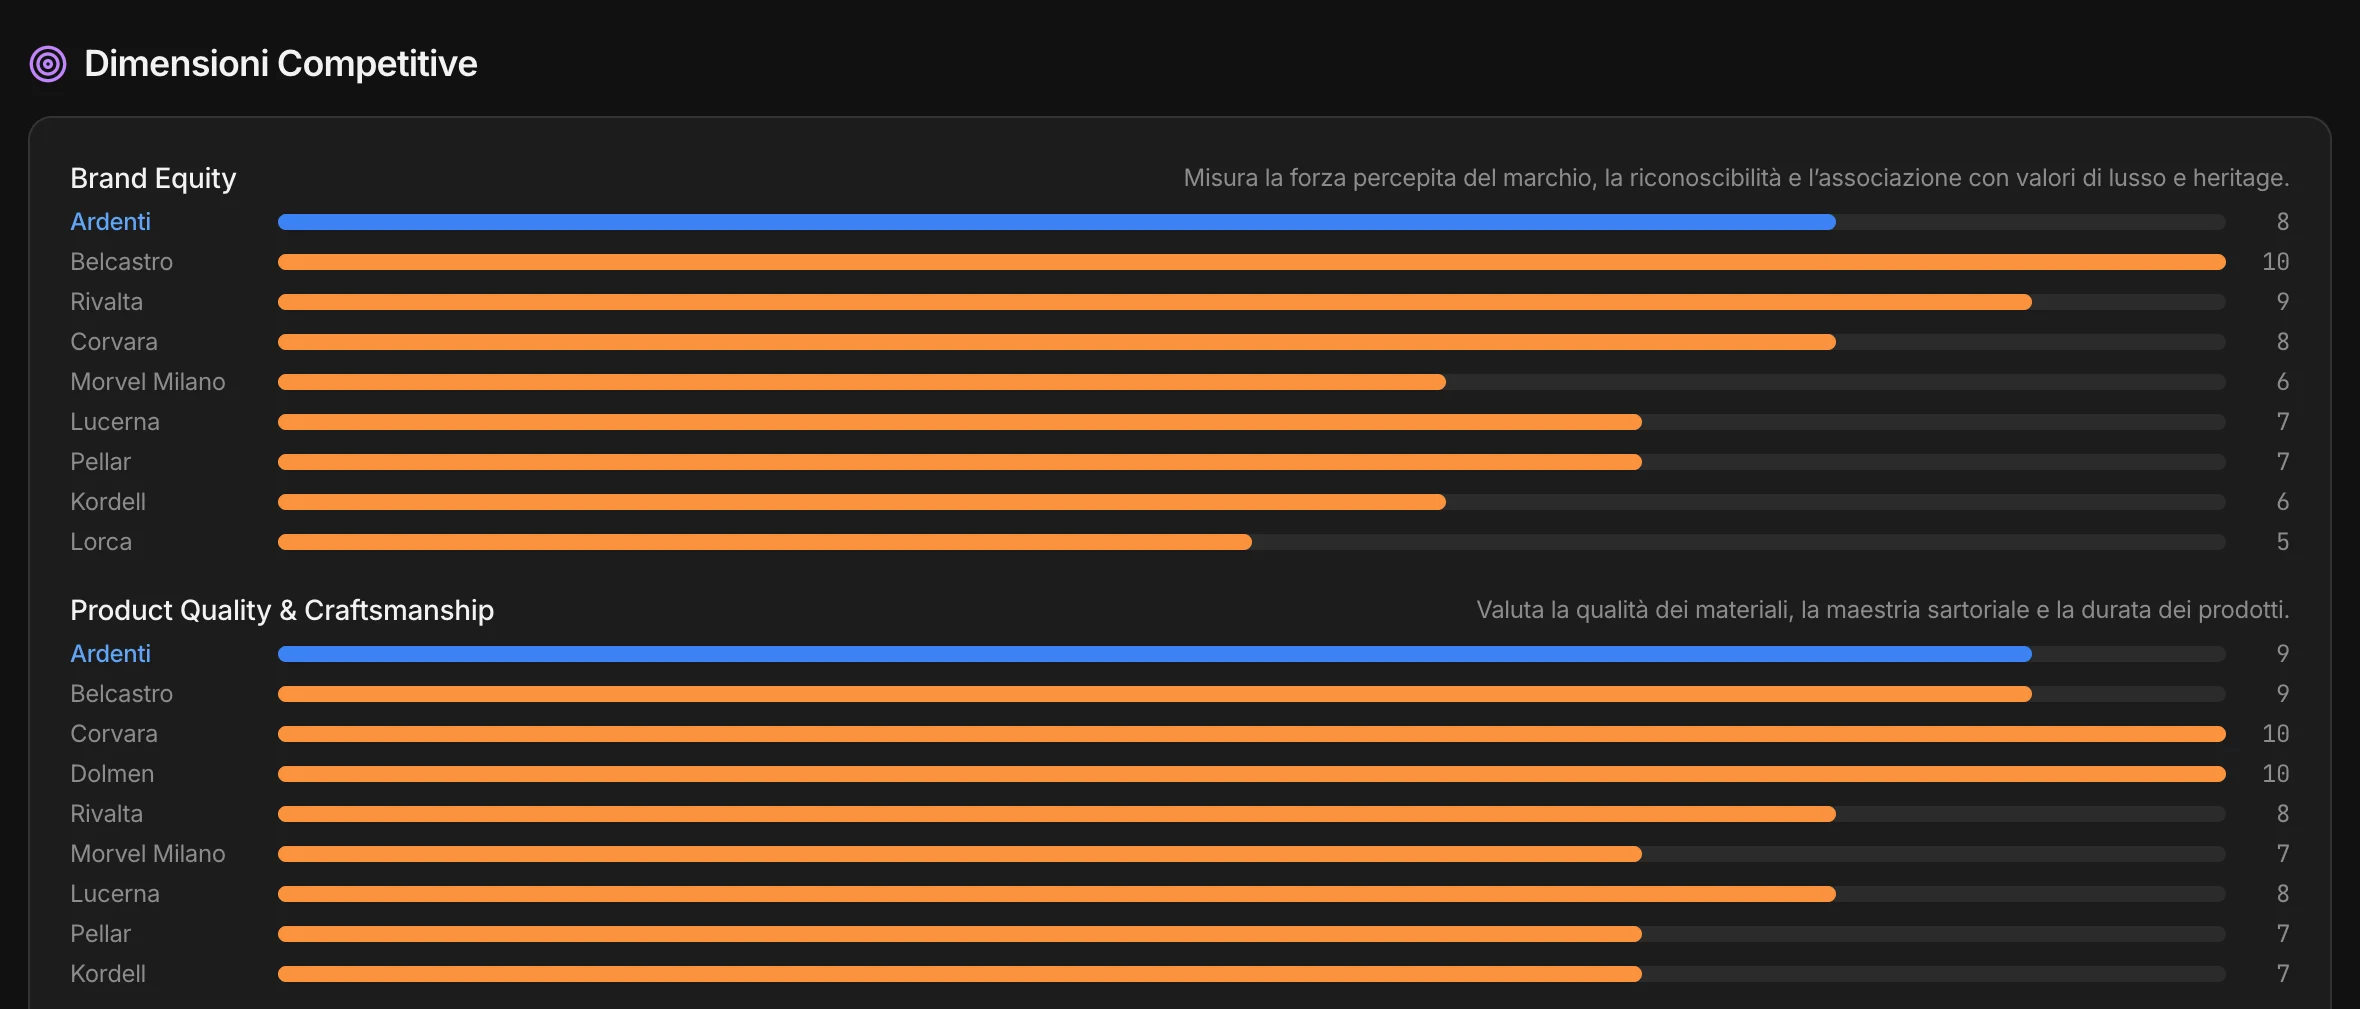
Side by side, dimension by dimension.
Brand equity, quality, value for money, distribution, digital experience, sustainability: where you’re ahead, where you’re behind, and compared to whom.
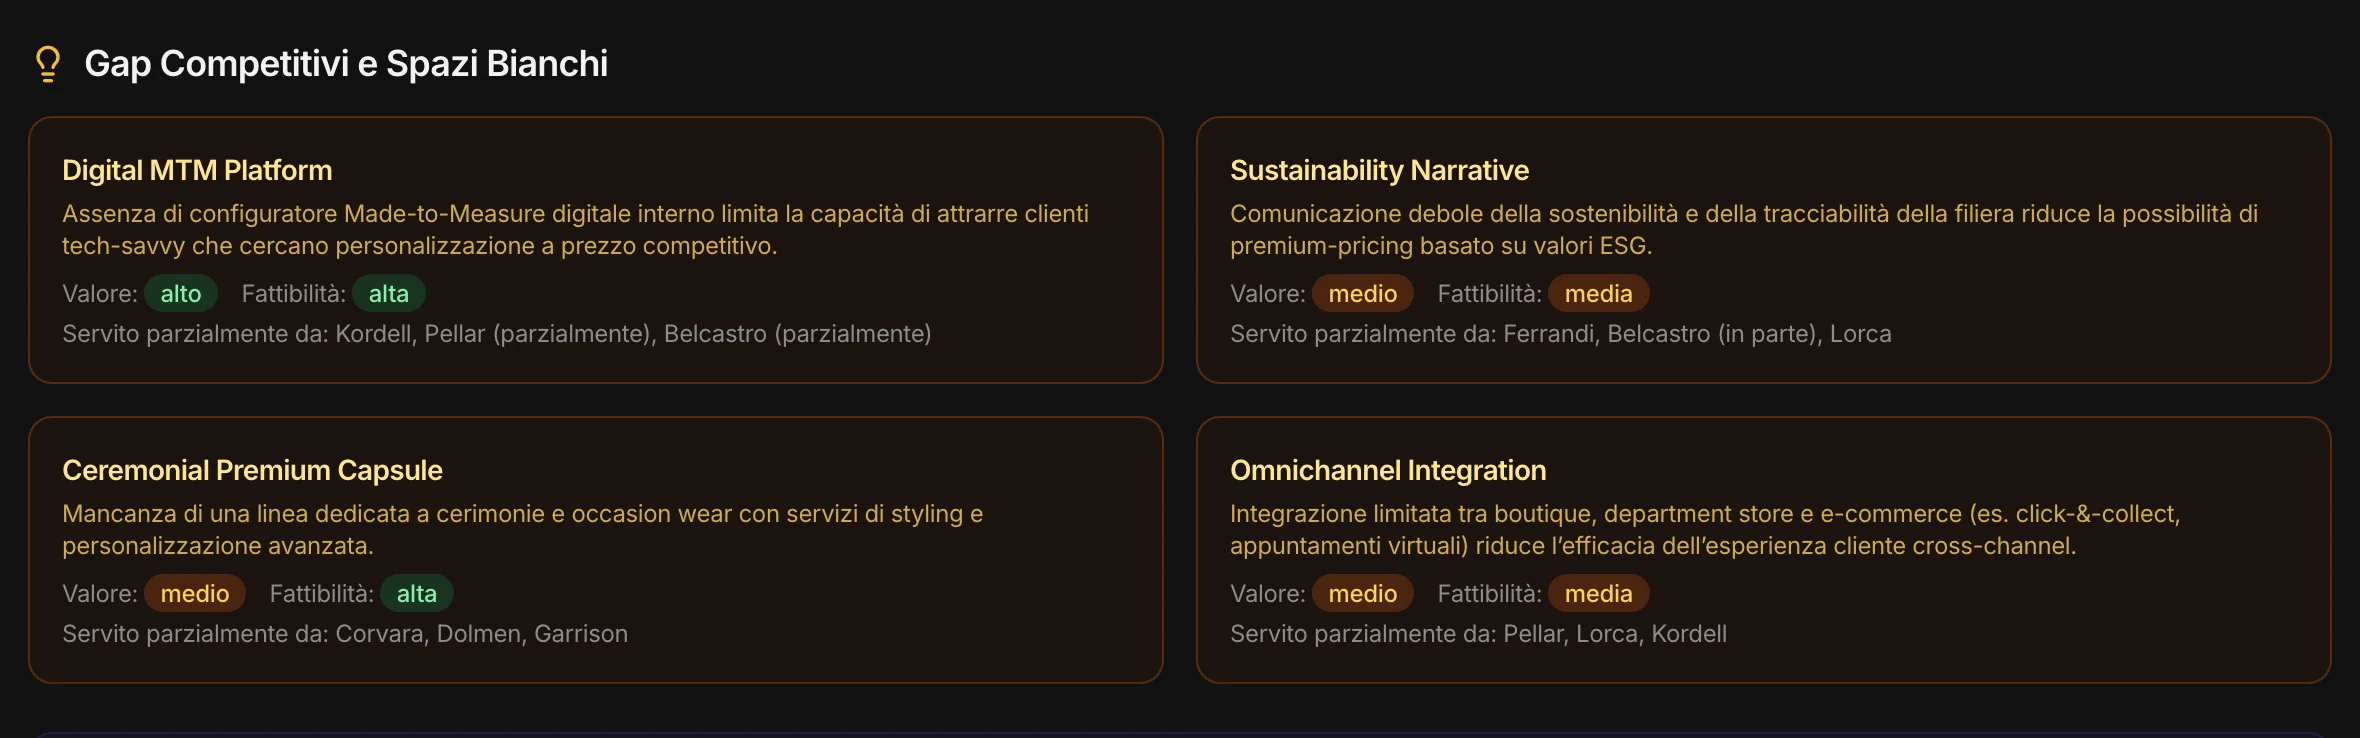
And the open spaces.
The needs nobody serves well: how much they’re worth, how feasible they are, and who already partly serves them.
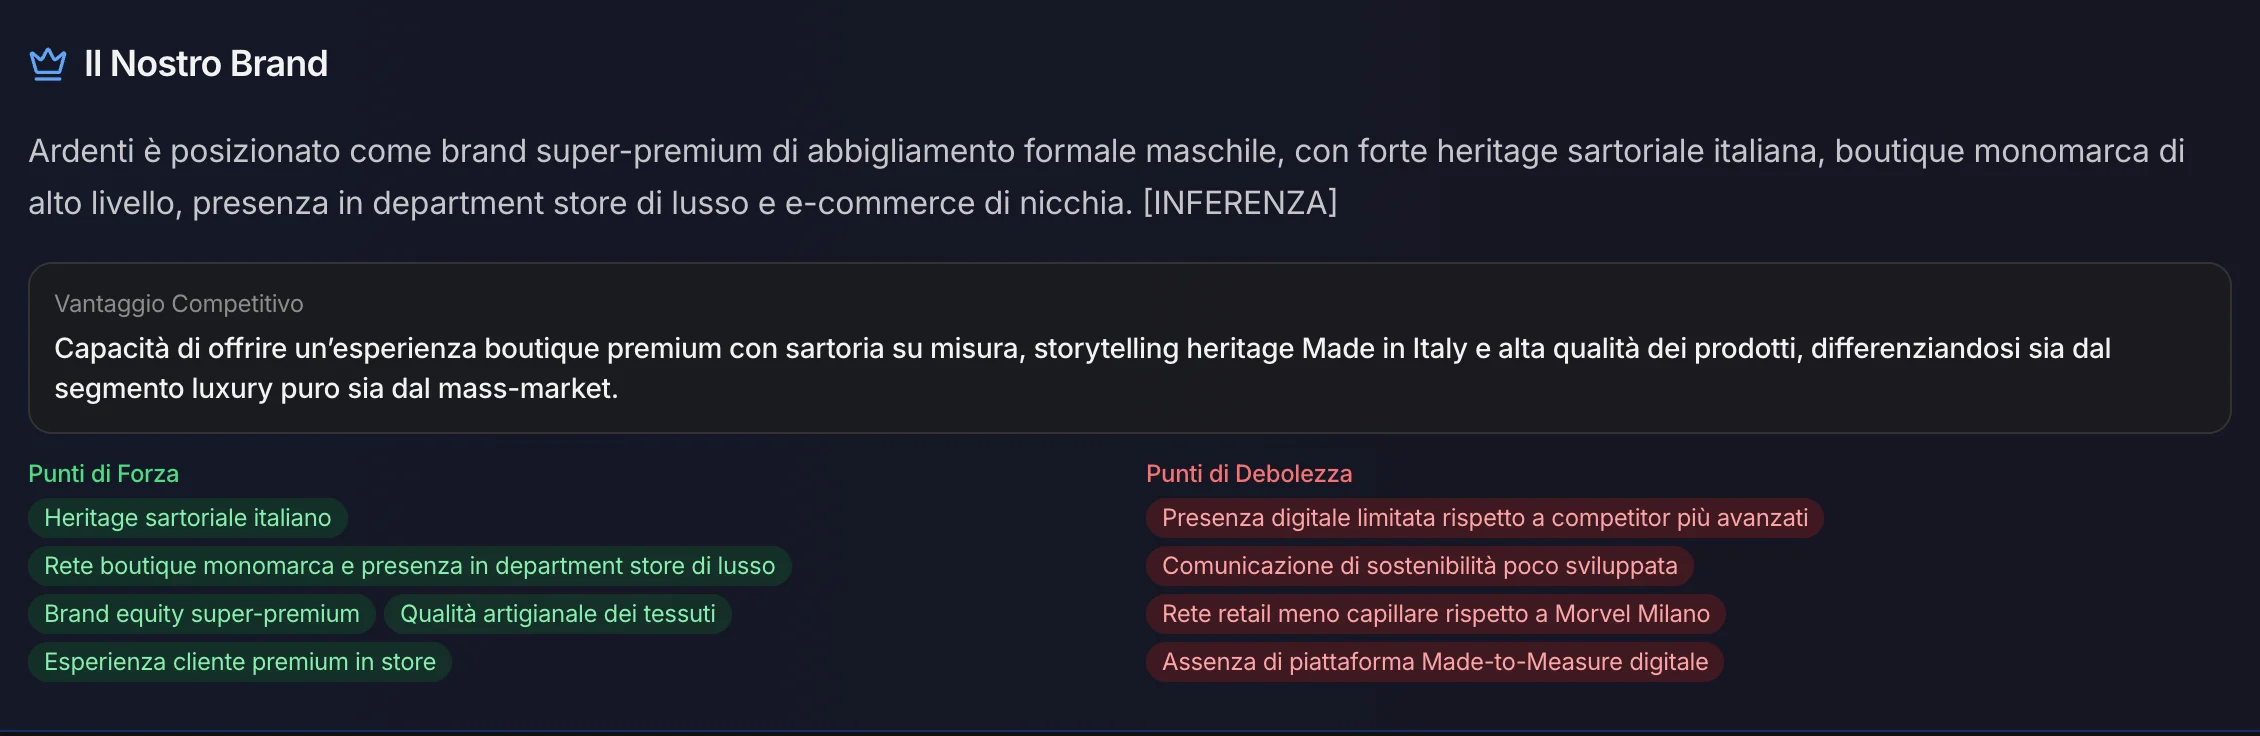
Every point, with its evidence.
And from the SWOT, the moves.
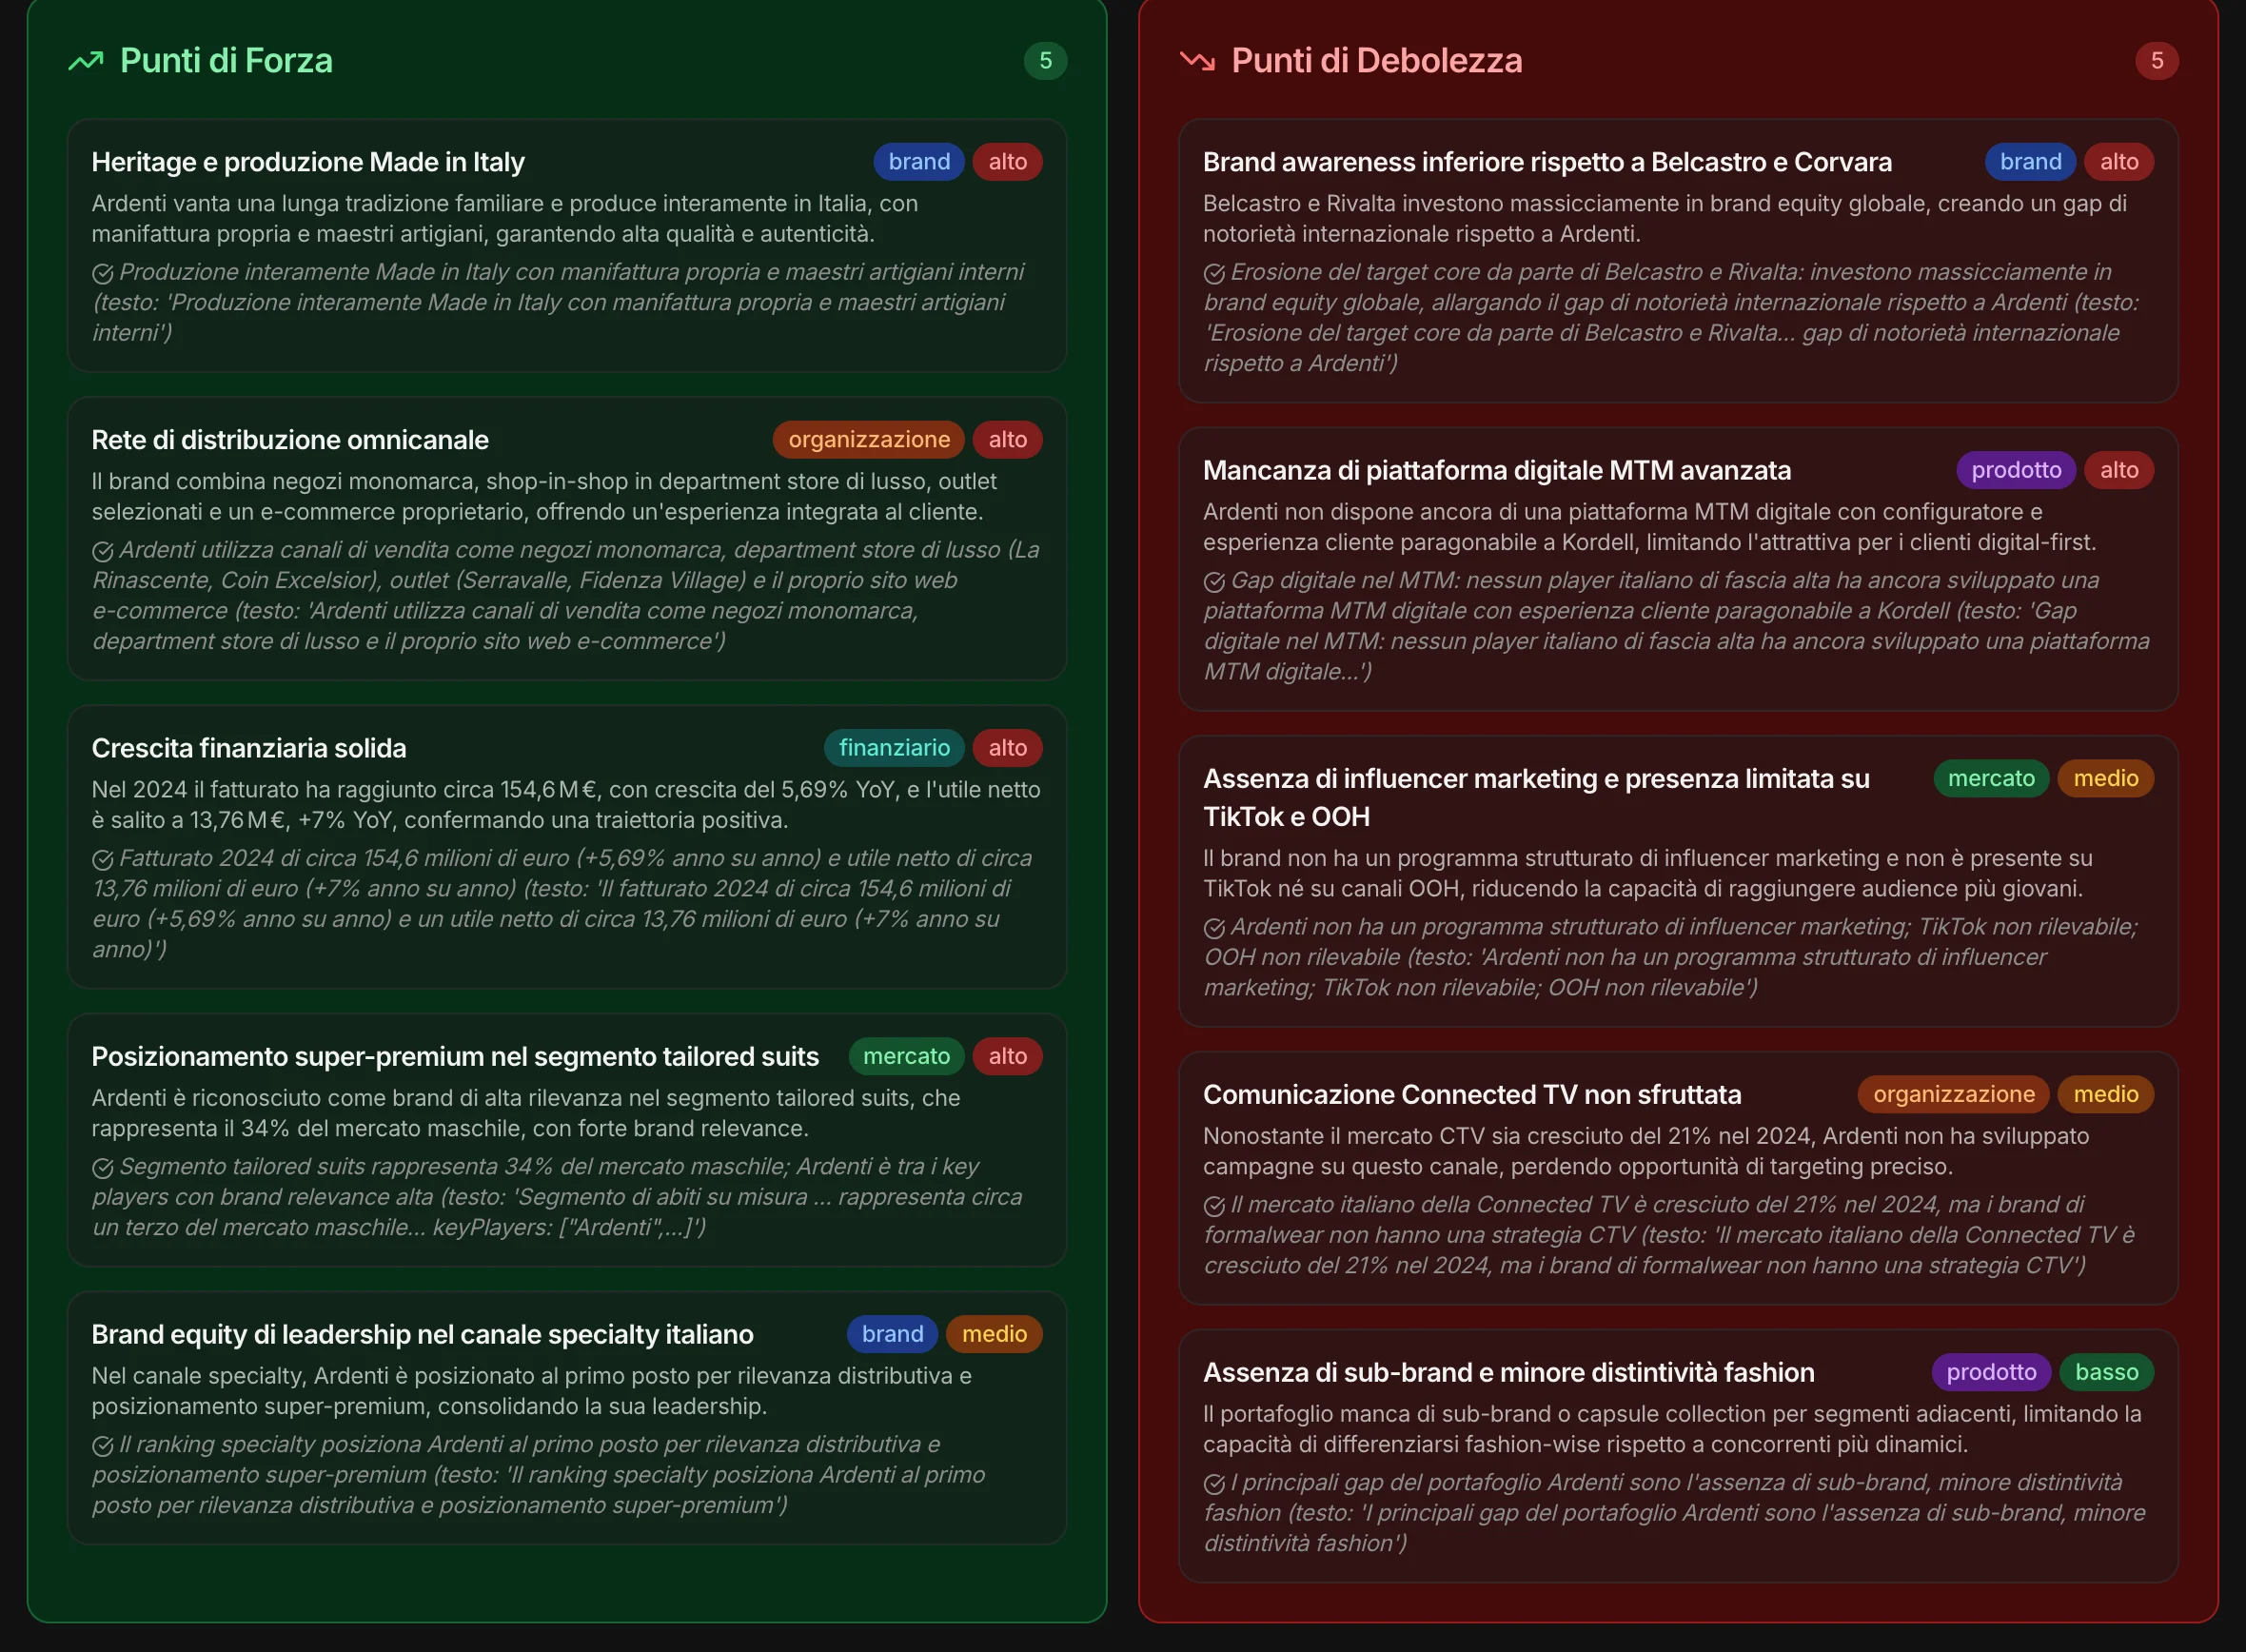
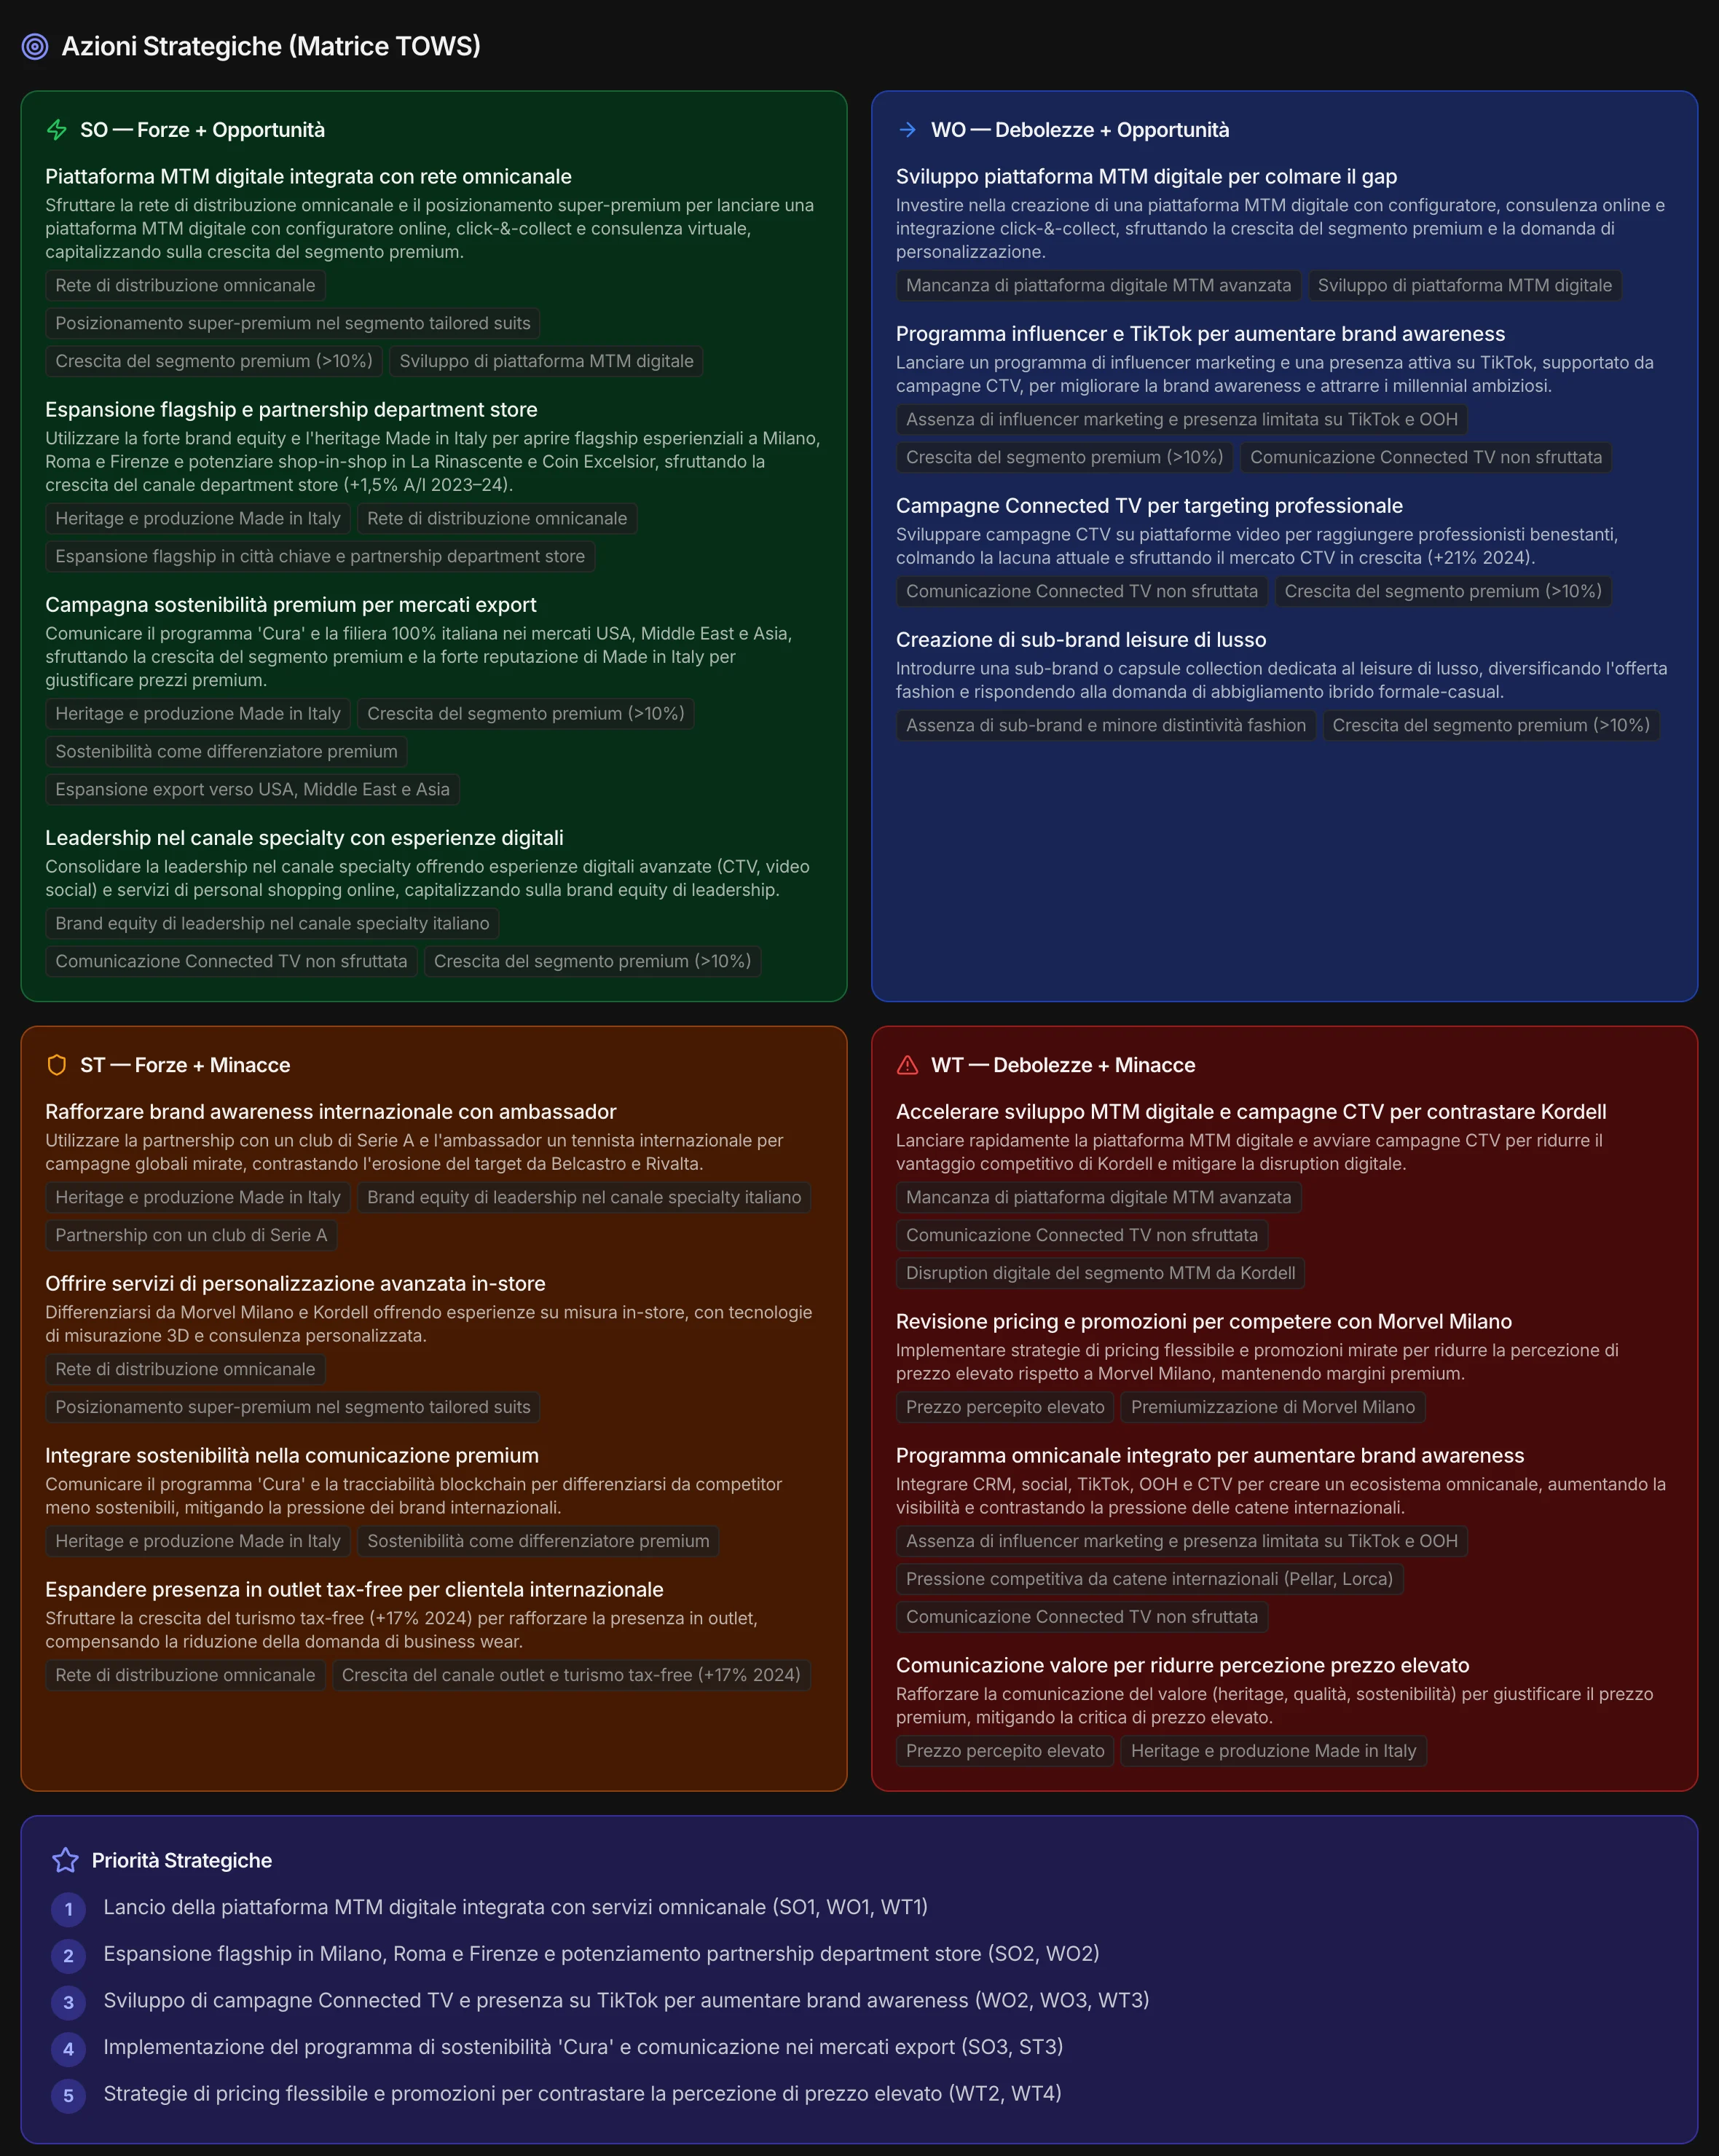
Strengths, weaknesses, opportunities and threats, each with its weight and the data it comes from. Then the TOWS matrix crosses the quadrants — strengths with opportunities, weaknesses with threats — and derives the actions and priorities.
In B2B, a different SWOT.
The opportunities are buying groups, digital catalogs, fast delivery to repair shops; the threats are distributors launching their own lines, marketplaces, low-cost manufacturers. Each threat is linked to the weakness that makes it dangerous.
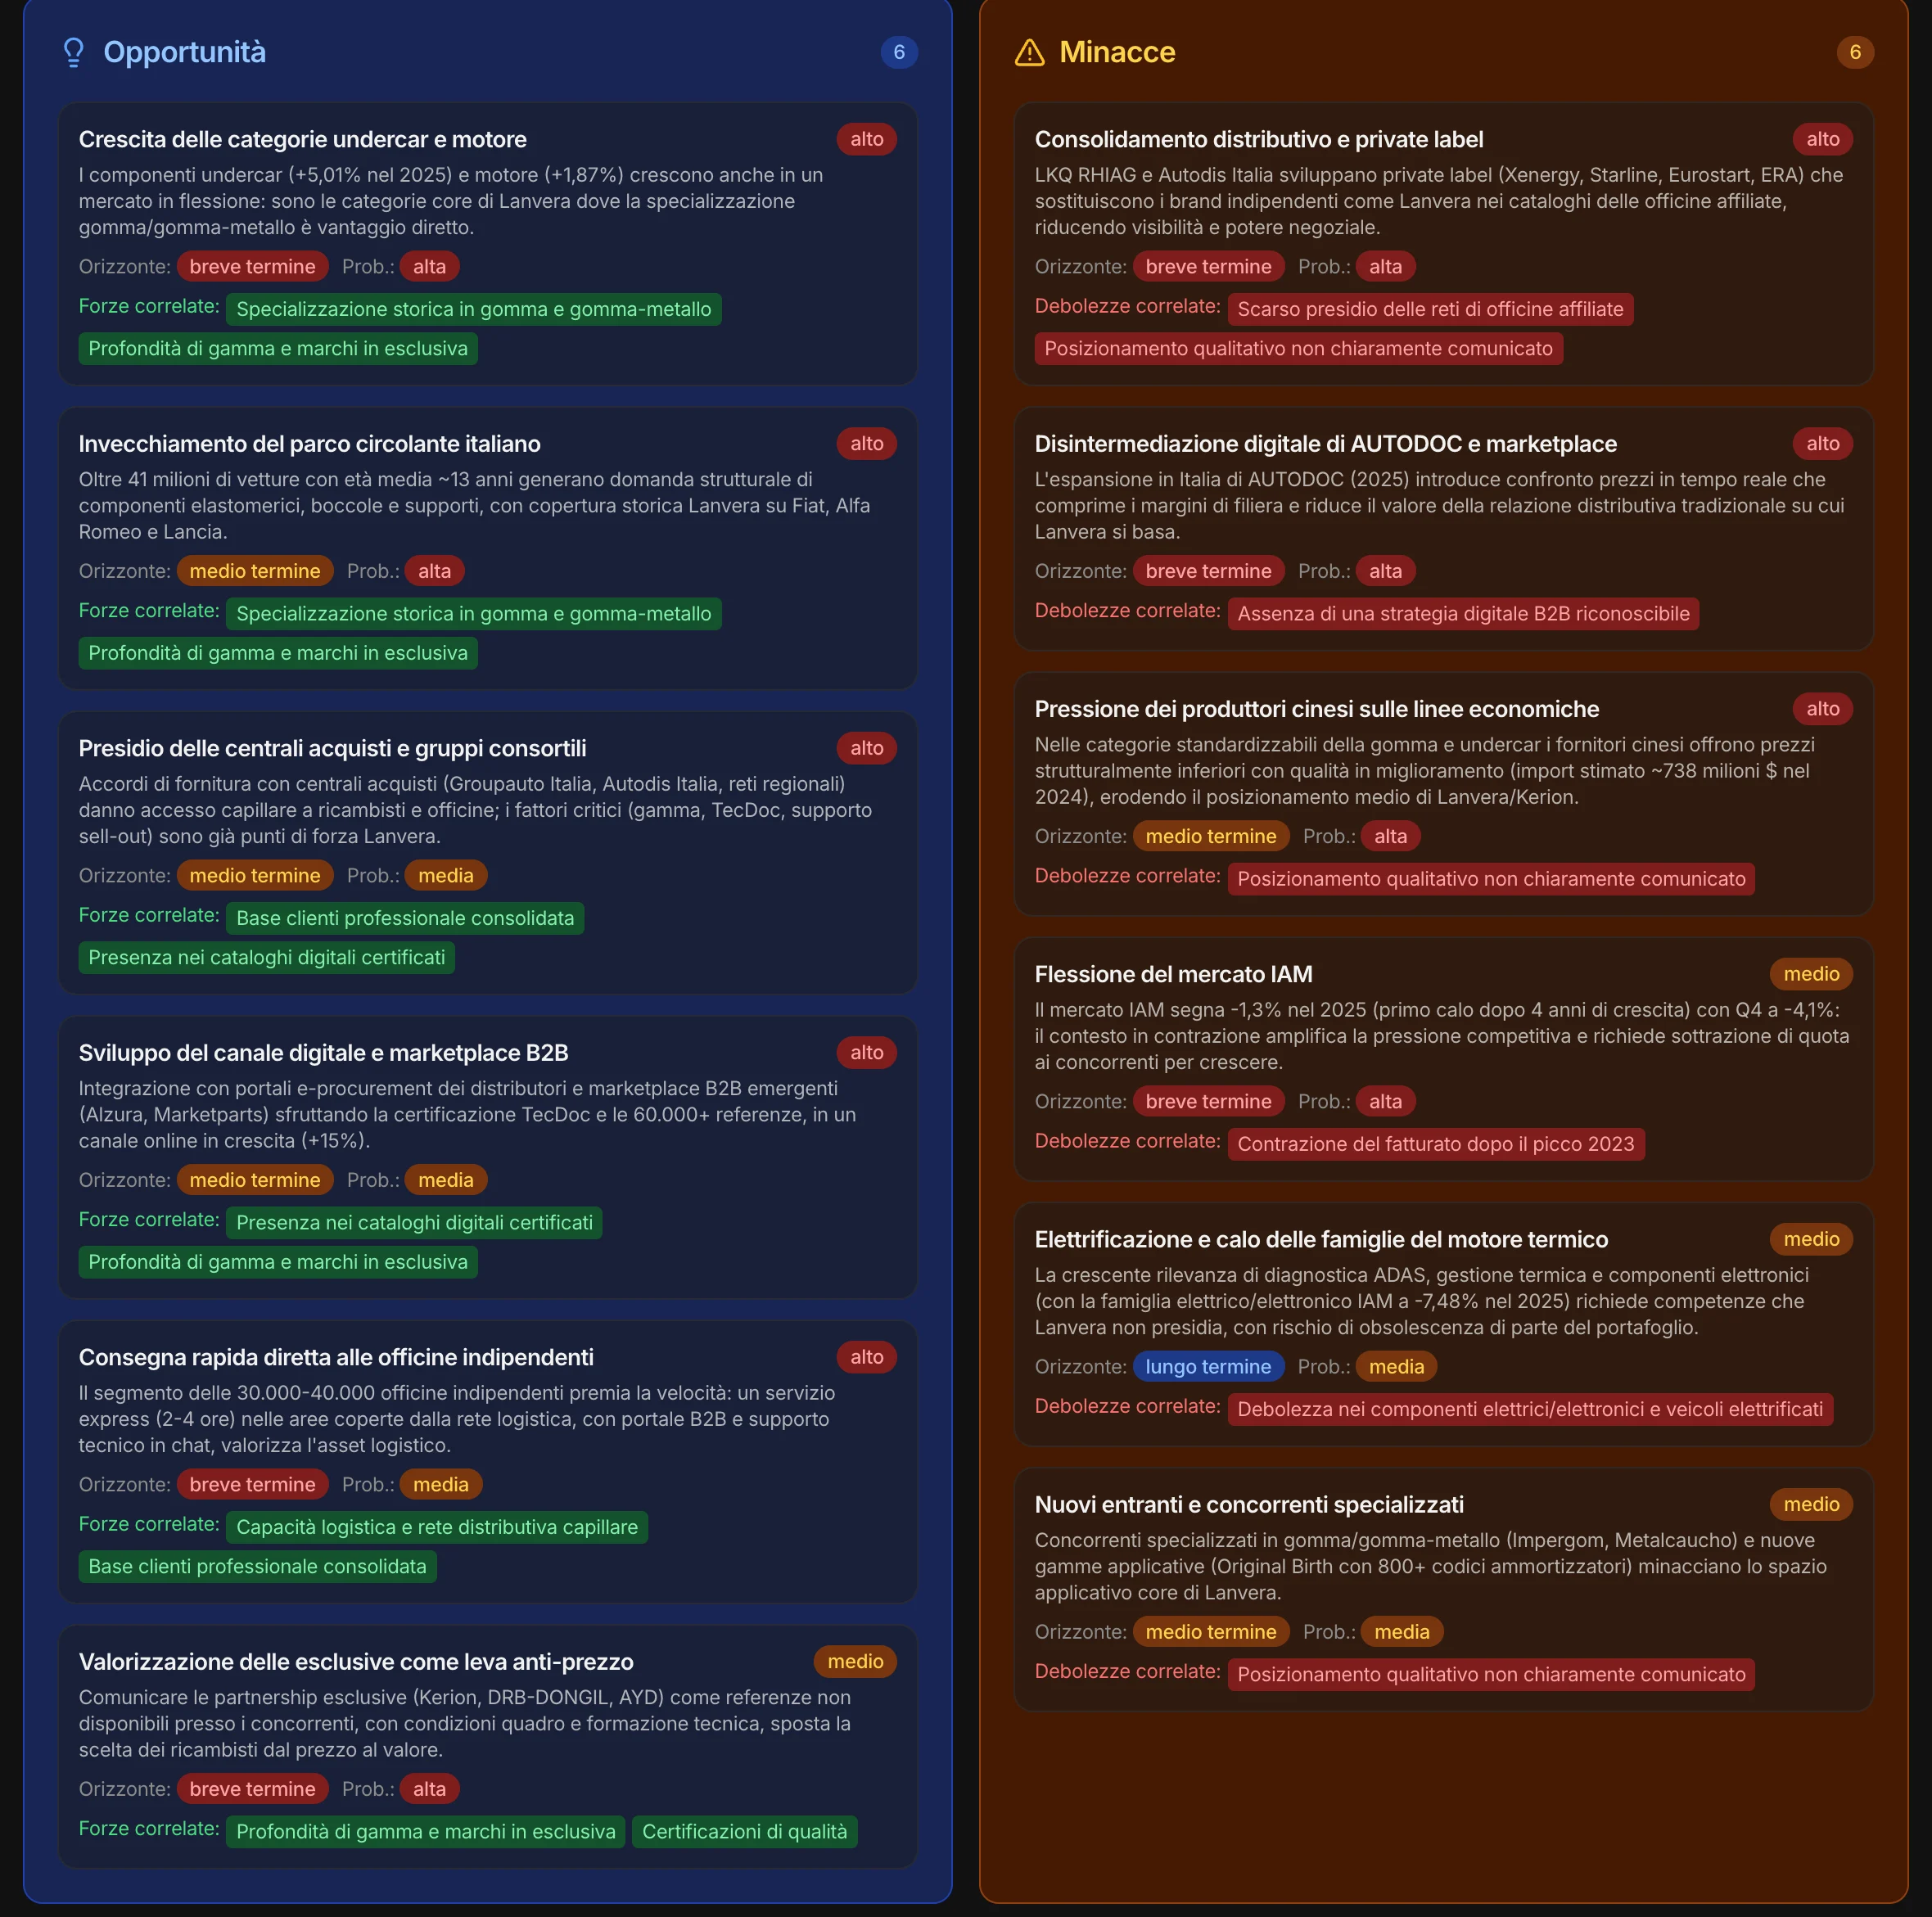
The manufacturer has a fictional name; the industry’s distributors and competitors are the real ones.
Three possible futures.
And the signals that tell you which one is coming.
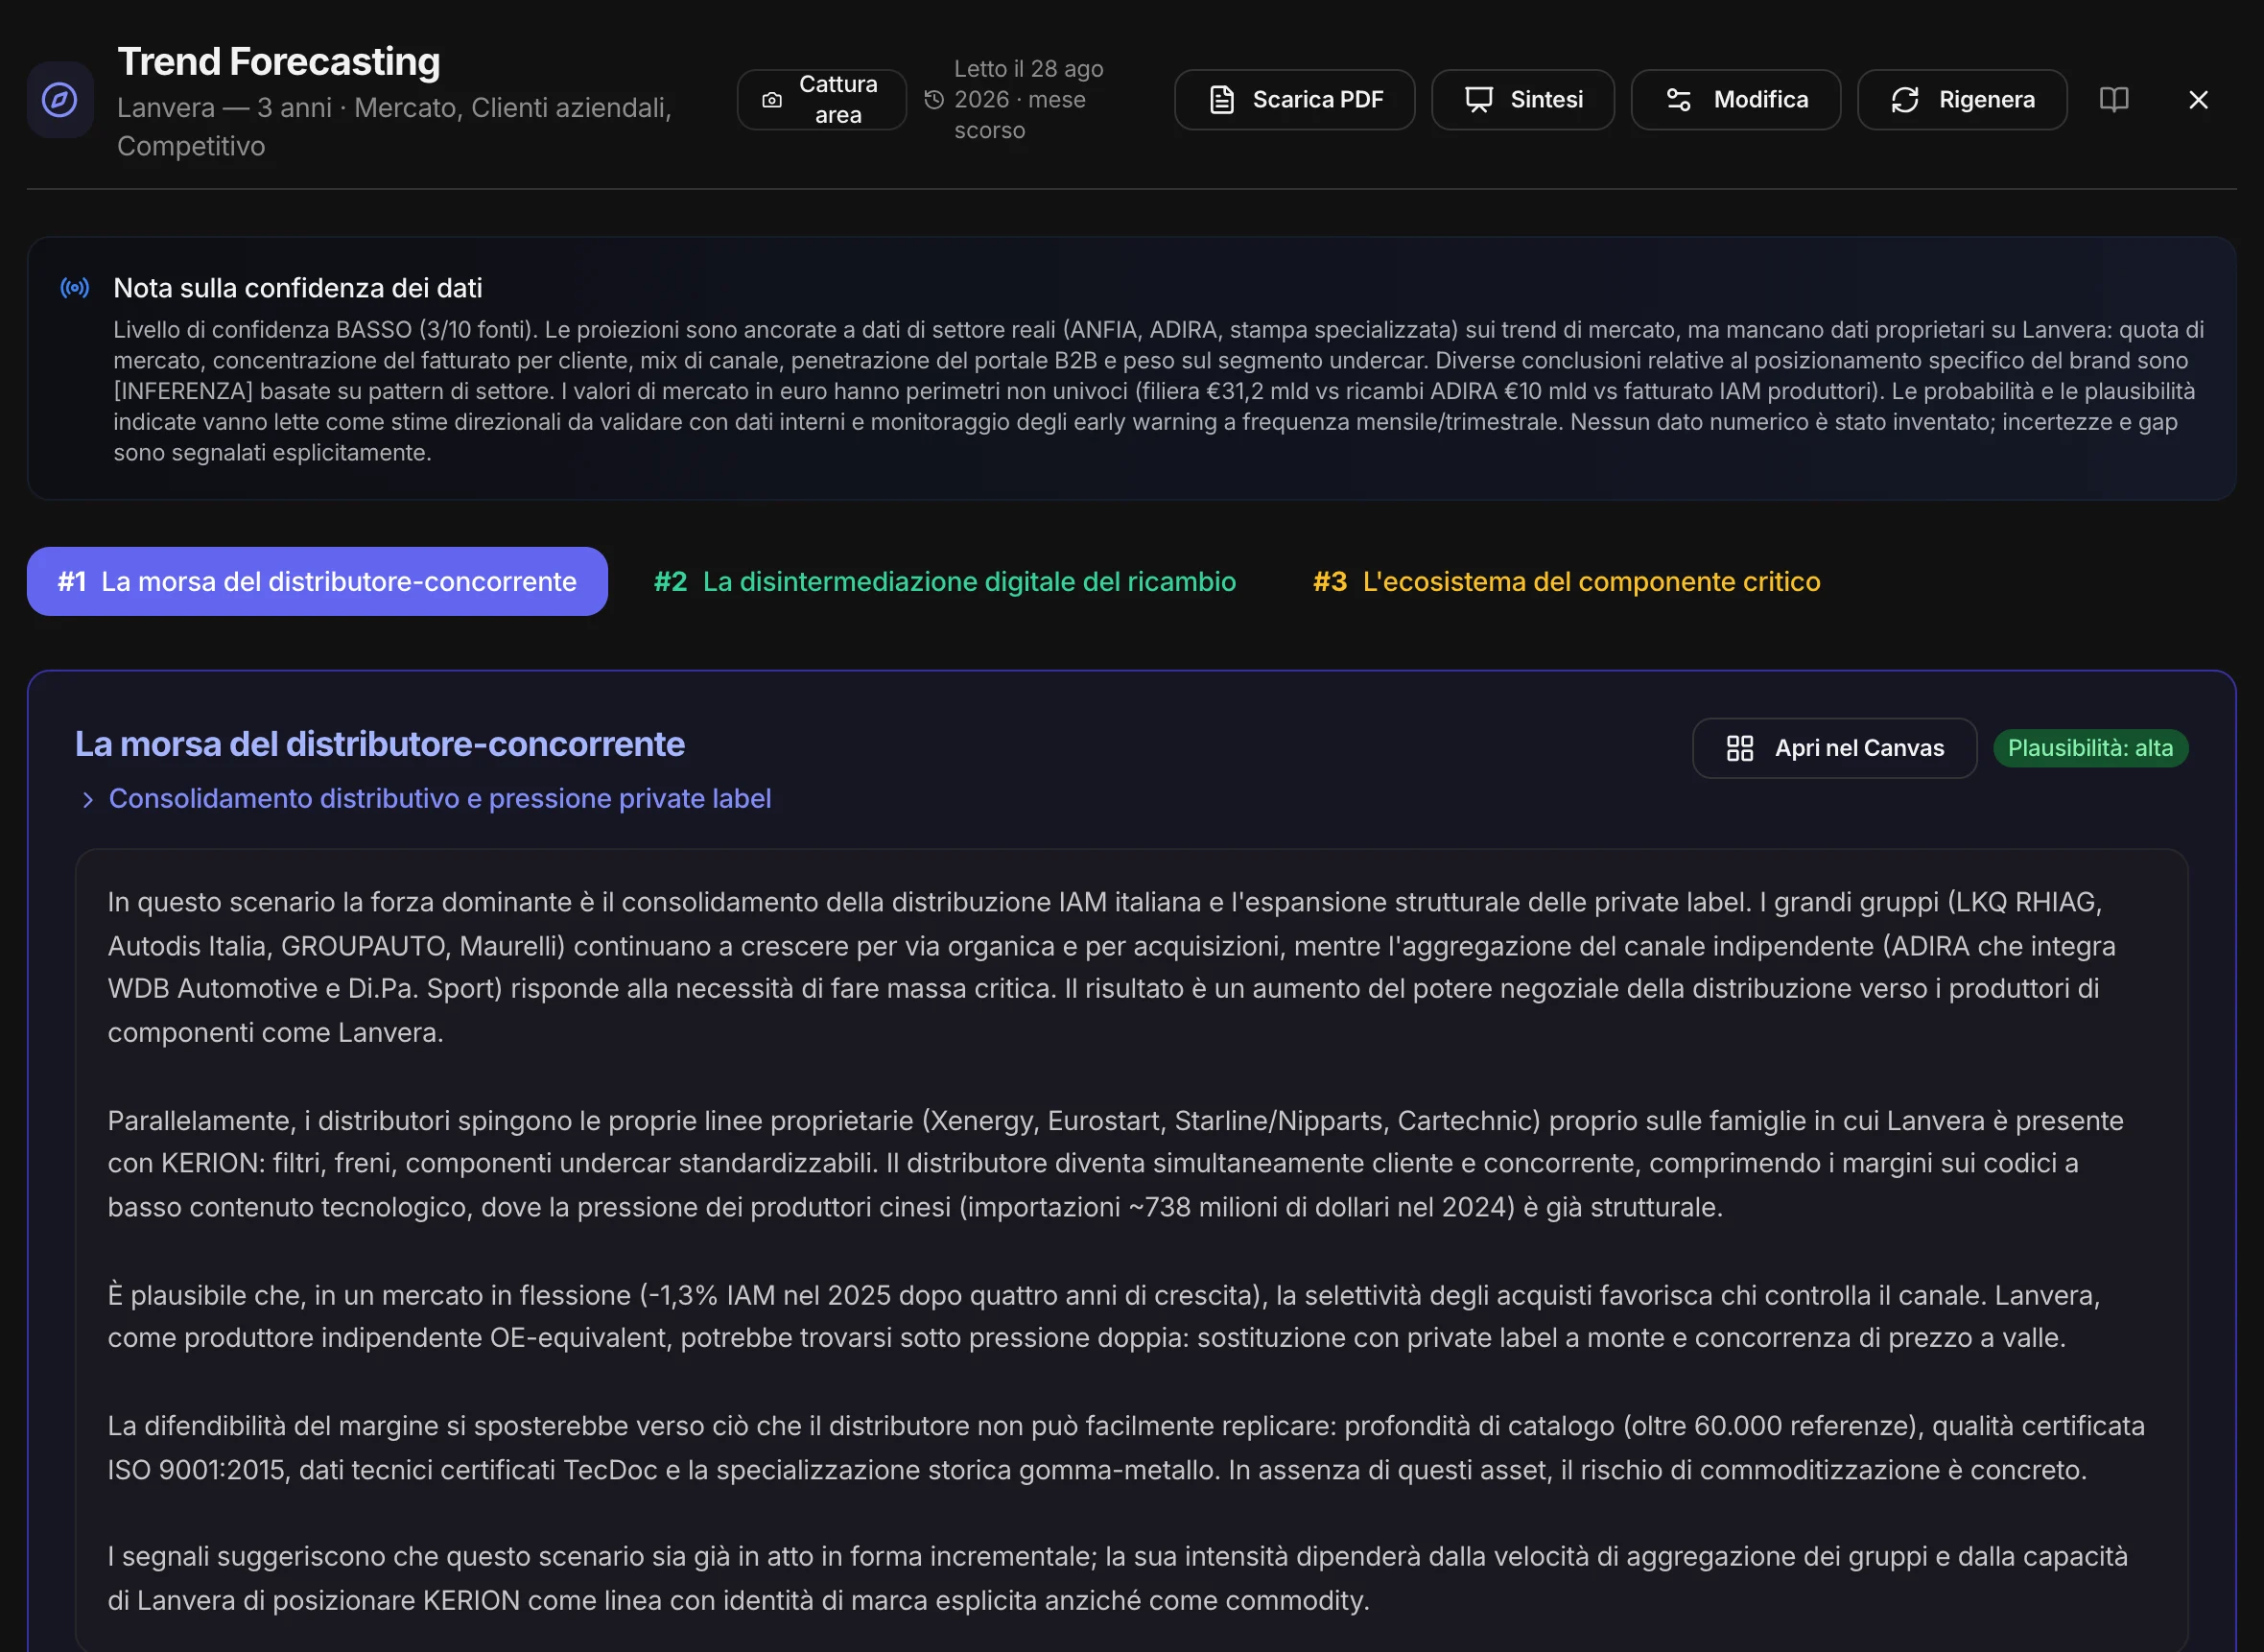
Choose what to look ahead at — market, customers, competition — and how many years out: three, five or ten. MAPS builds three scenarios, each with its plausibility, the signals that support it, and what happens in the short, medium and long term. And it states how solid the sources are.
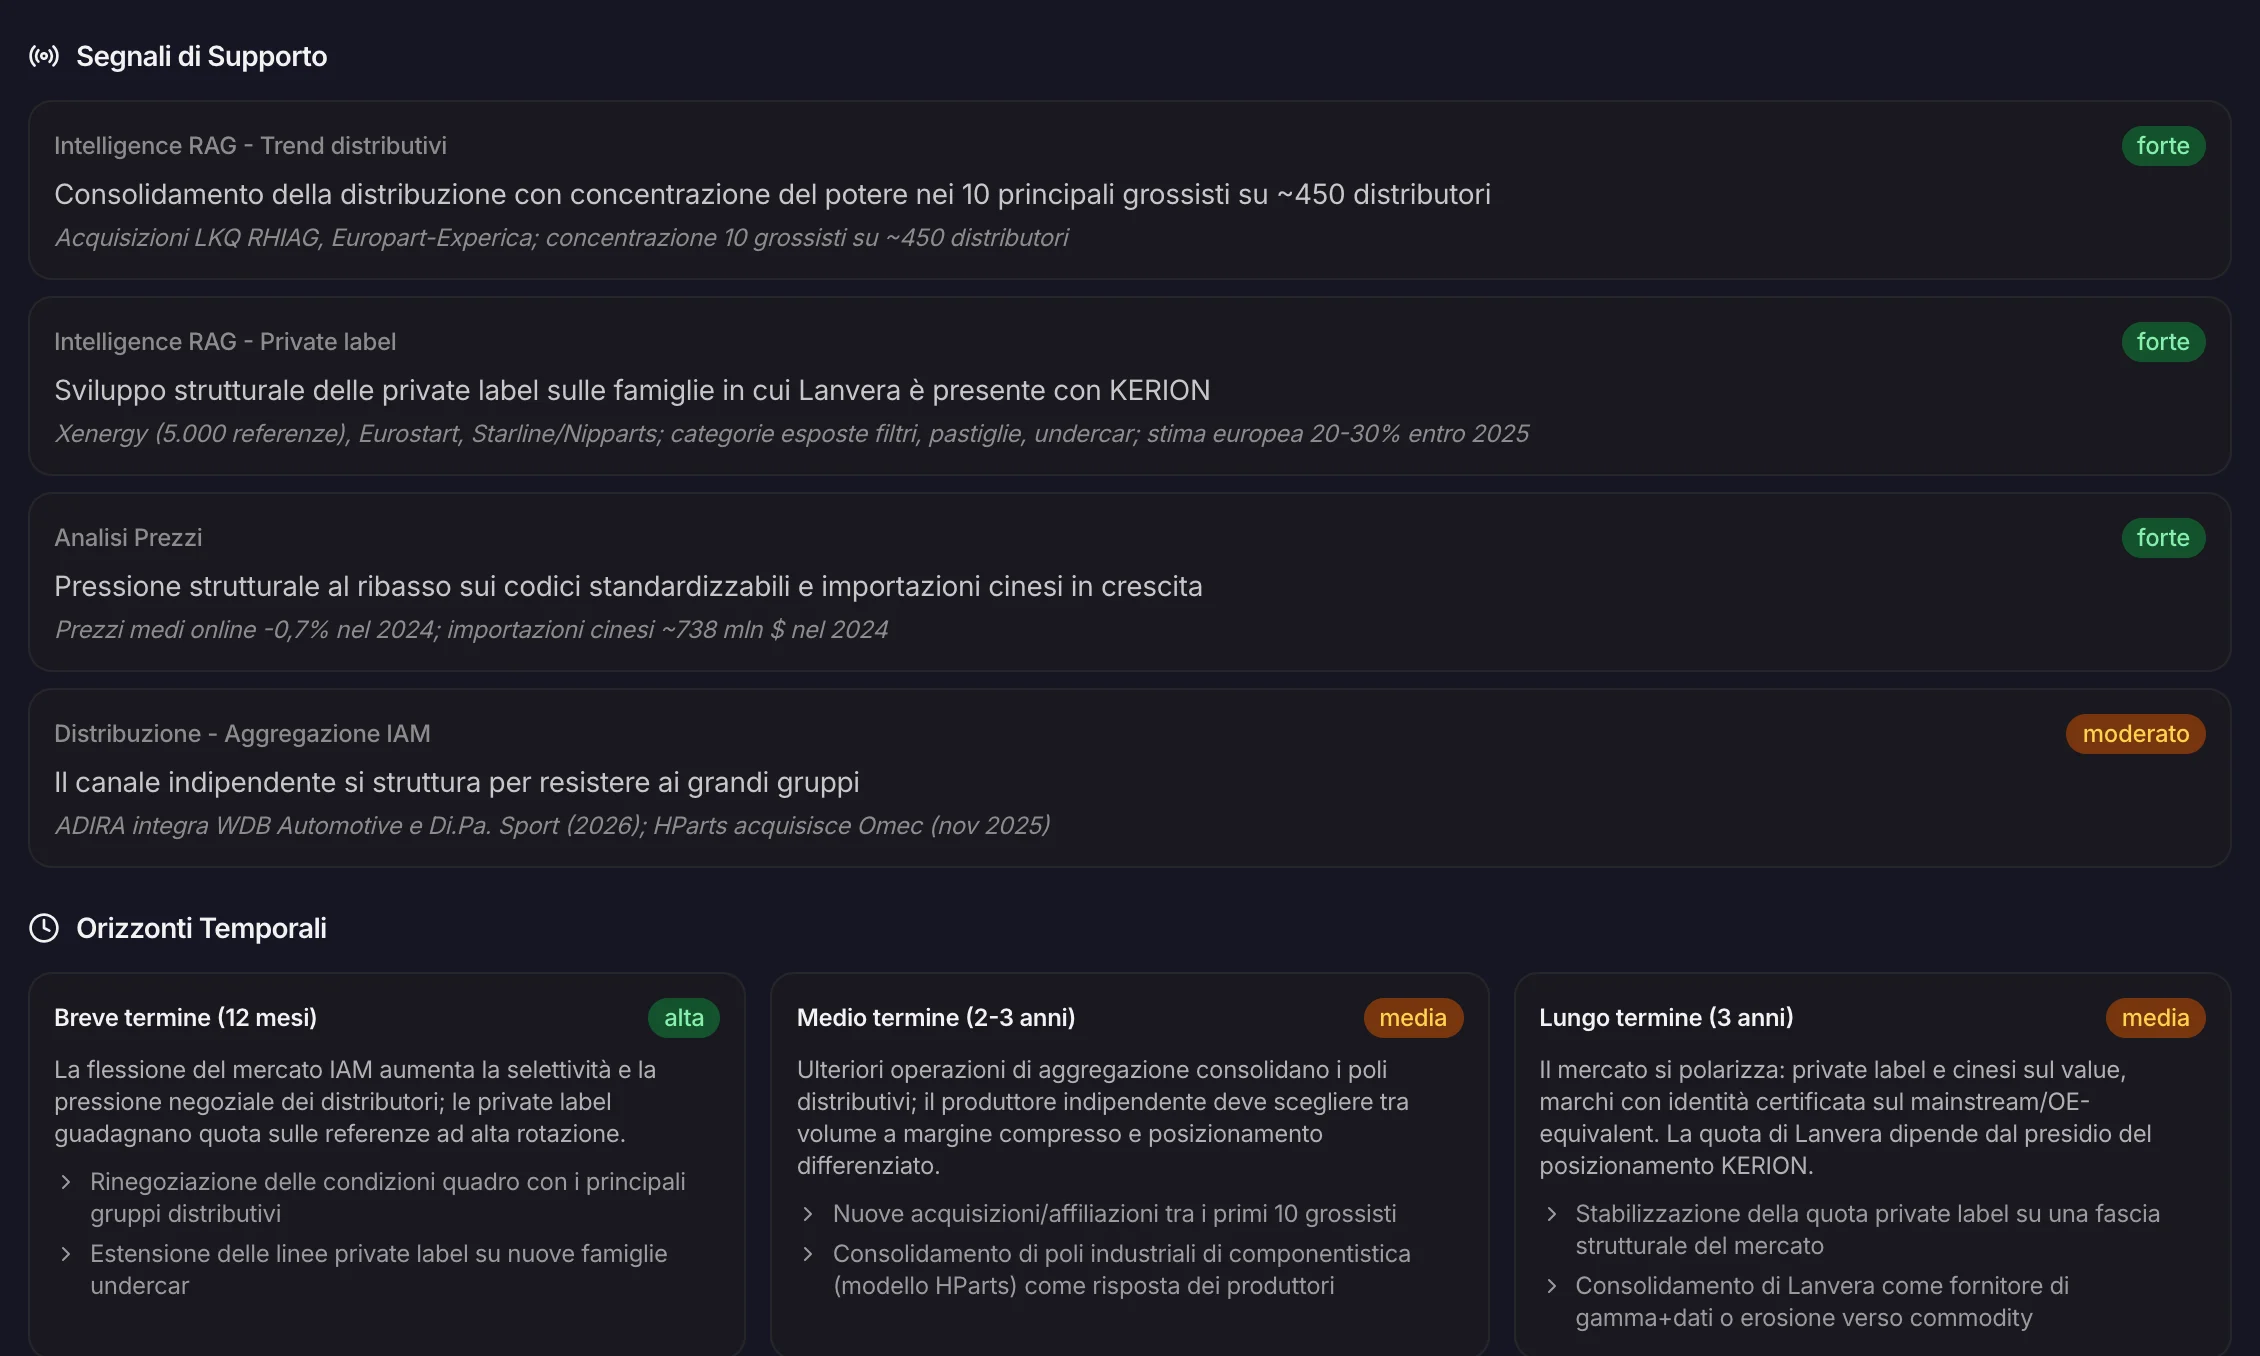
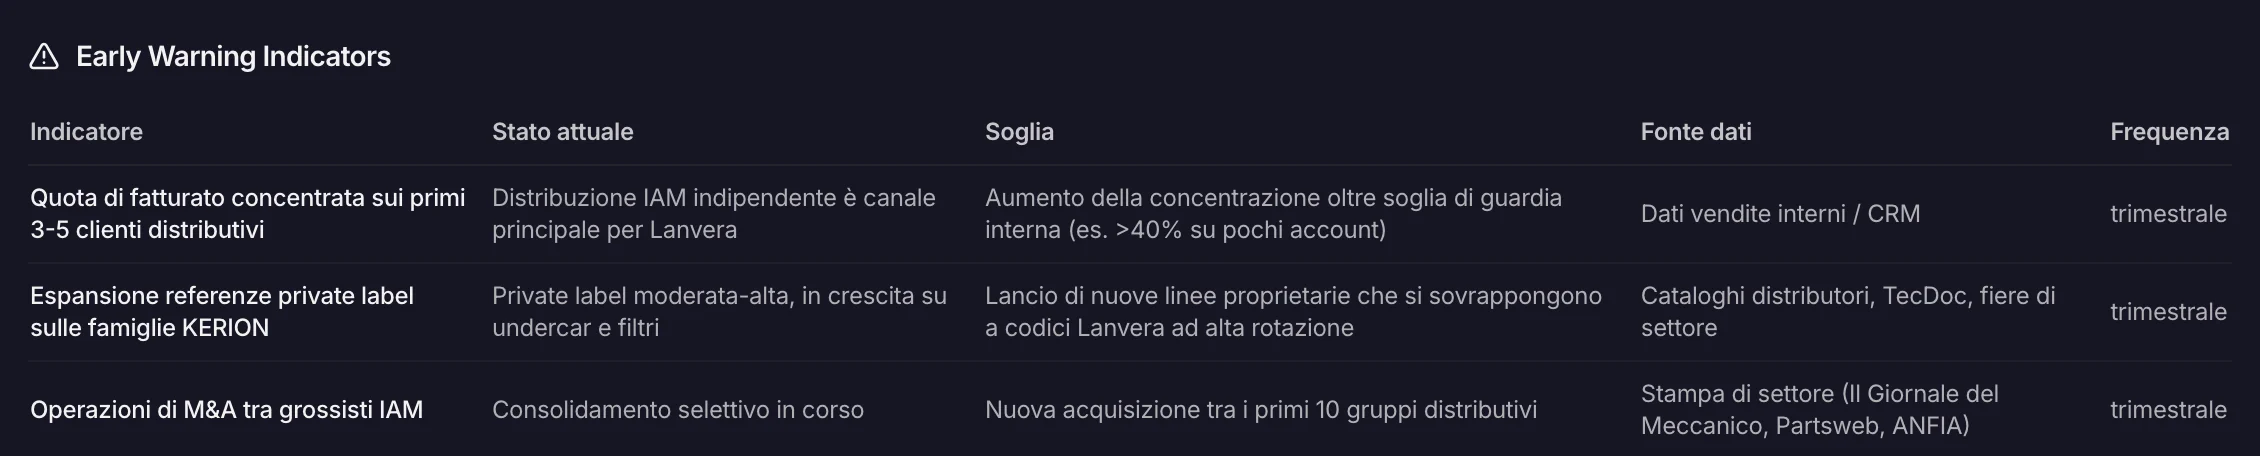
What to keep an eye on.
The early-warning indicators: the threshold beyond which to worry, where to find the data, how often to check it.
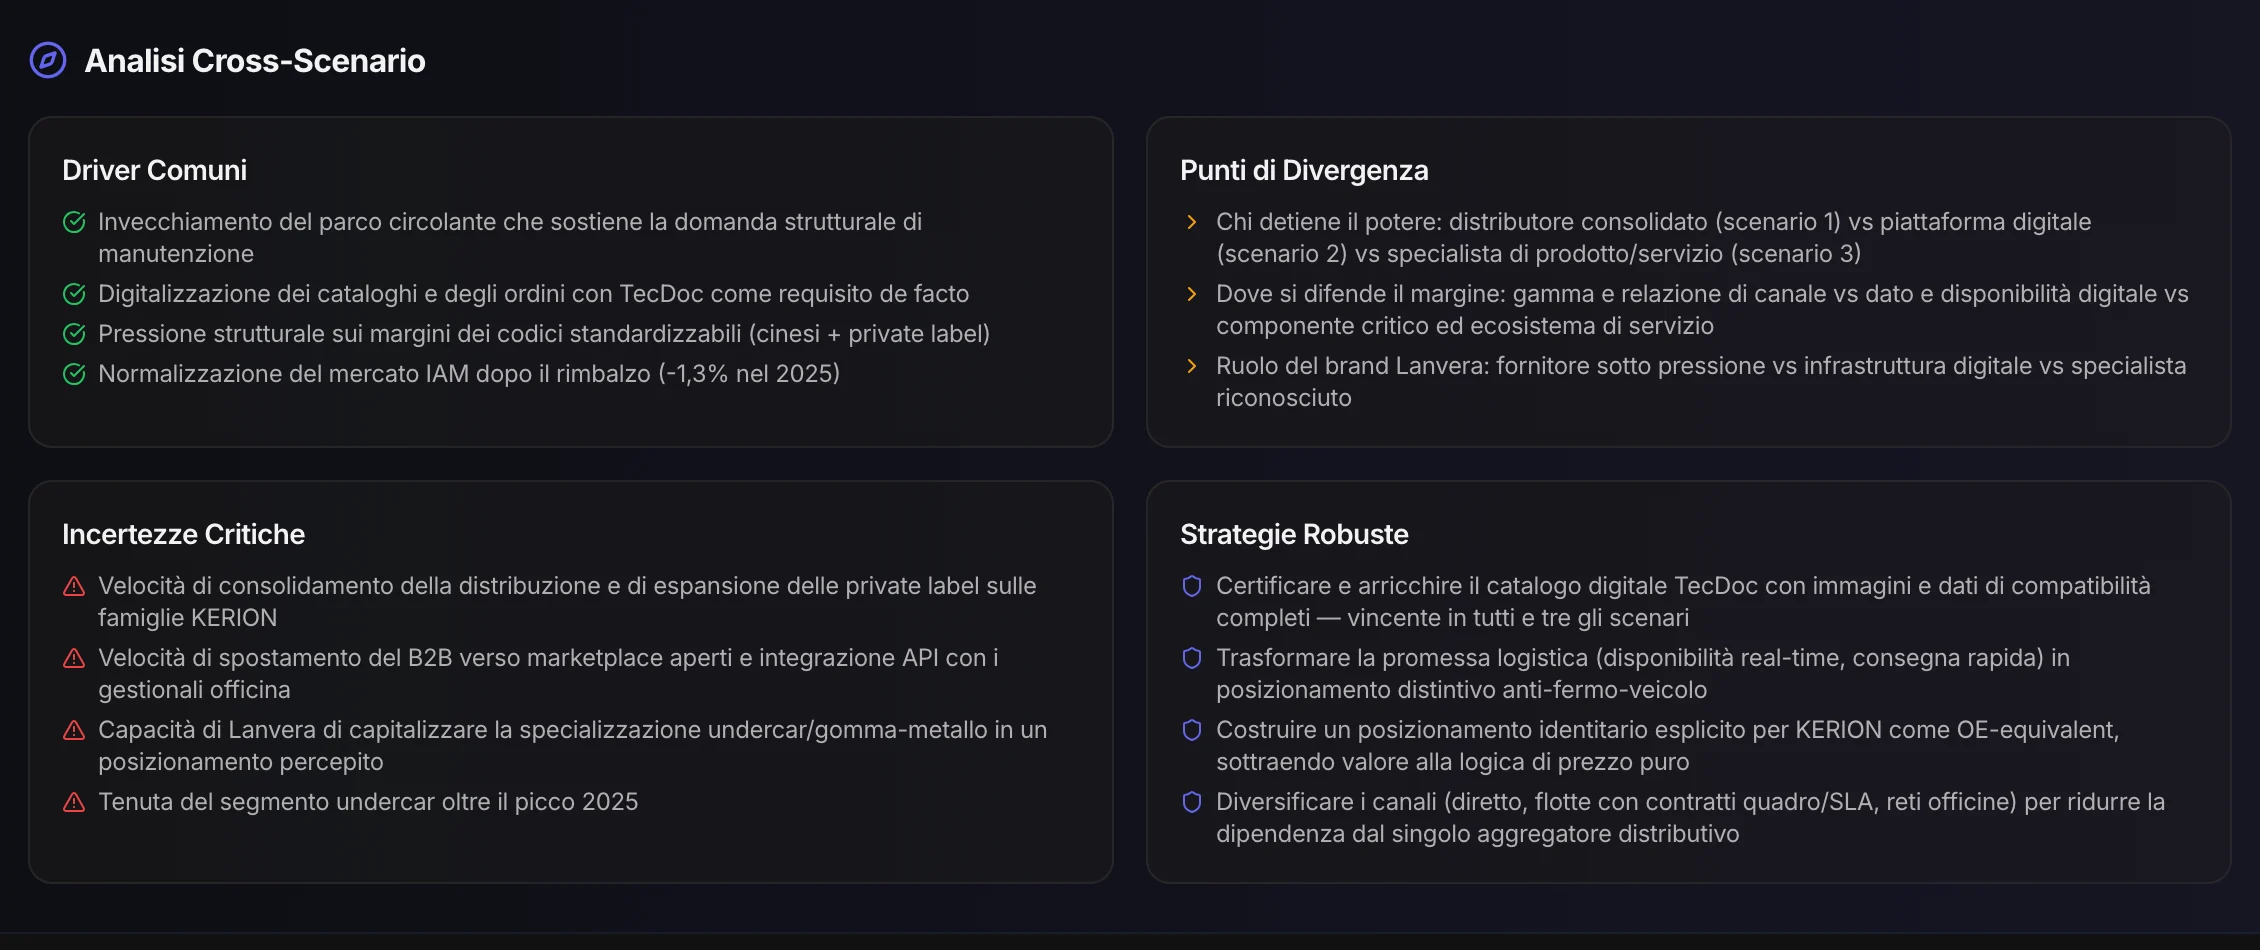
What to do regardless.
What the three scenarios have in common, where they diverge, the critical uncertainties, and the strategies that hold up in all three.
It stays in the project.
And works with everything else.
It stays current
You regenerate it when the market changes: previous versions stay in the history, with their date.
It feeds the rest
It goes into the project’s memory: the chat uses it, and the next tools — positioning, go-to-market, campaigns — start from here too.
It leaves the project
As a PDF, as a summary to present, or on the Canvas to work on with the team.