
Eight tabs.
A whole market.
In B2B projects the tabs talk about companies: Consumer becomes Customers, and the research looks for decision-makers, sales channels, trade fairs.
The brand and the market
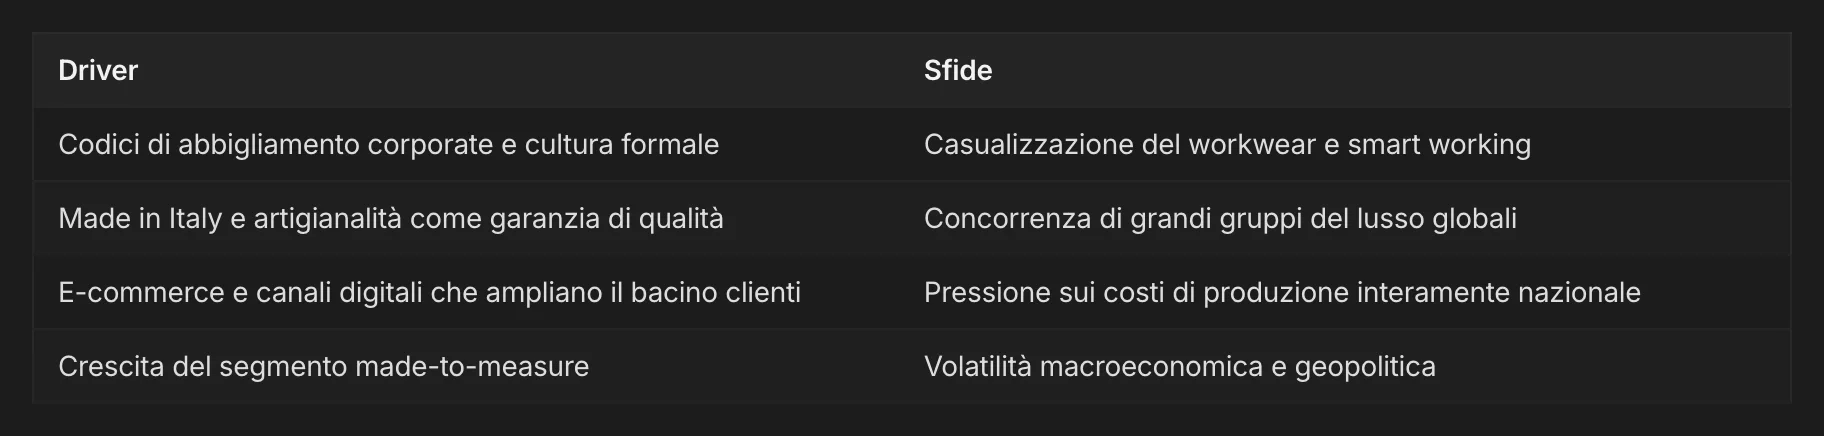
The reference market with its numbers, drivers and challenges; the brand’s history, structure and size; its strengths, areas for development, opportunities and risks.
The foundation everything else reasons on.
Consumer
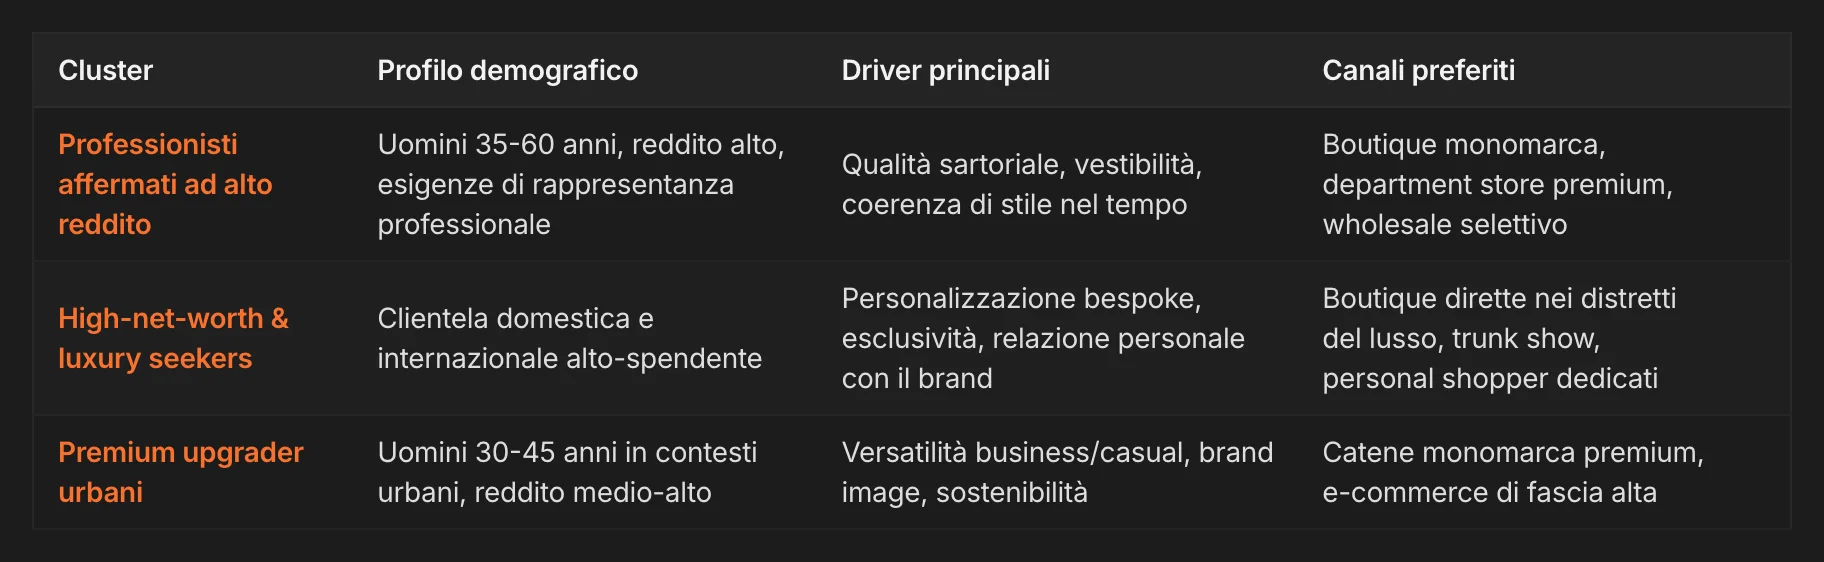
in B2B: CustomersThe buyer groups with their profile, what drives them, where they buy; the purchase journey, price sensitivity, loyalty, the trends changing demand.
You know who you’re working for.
Channels
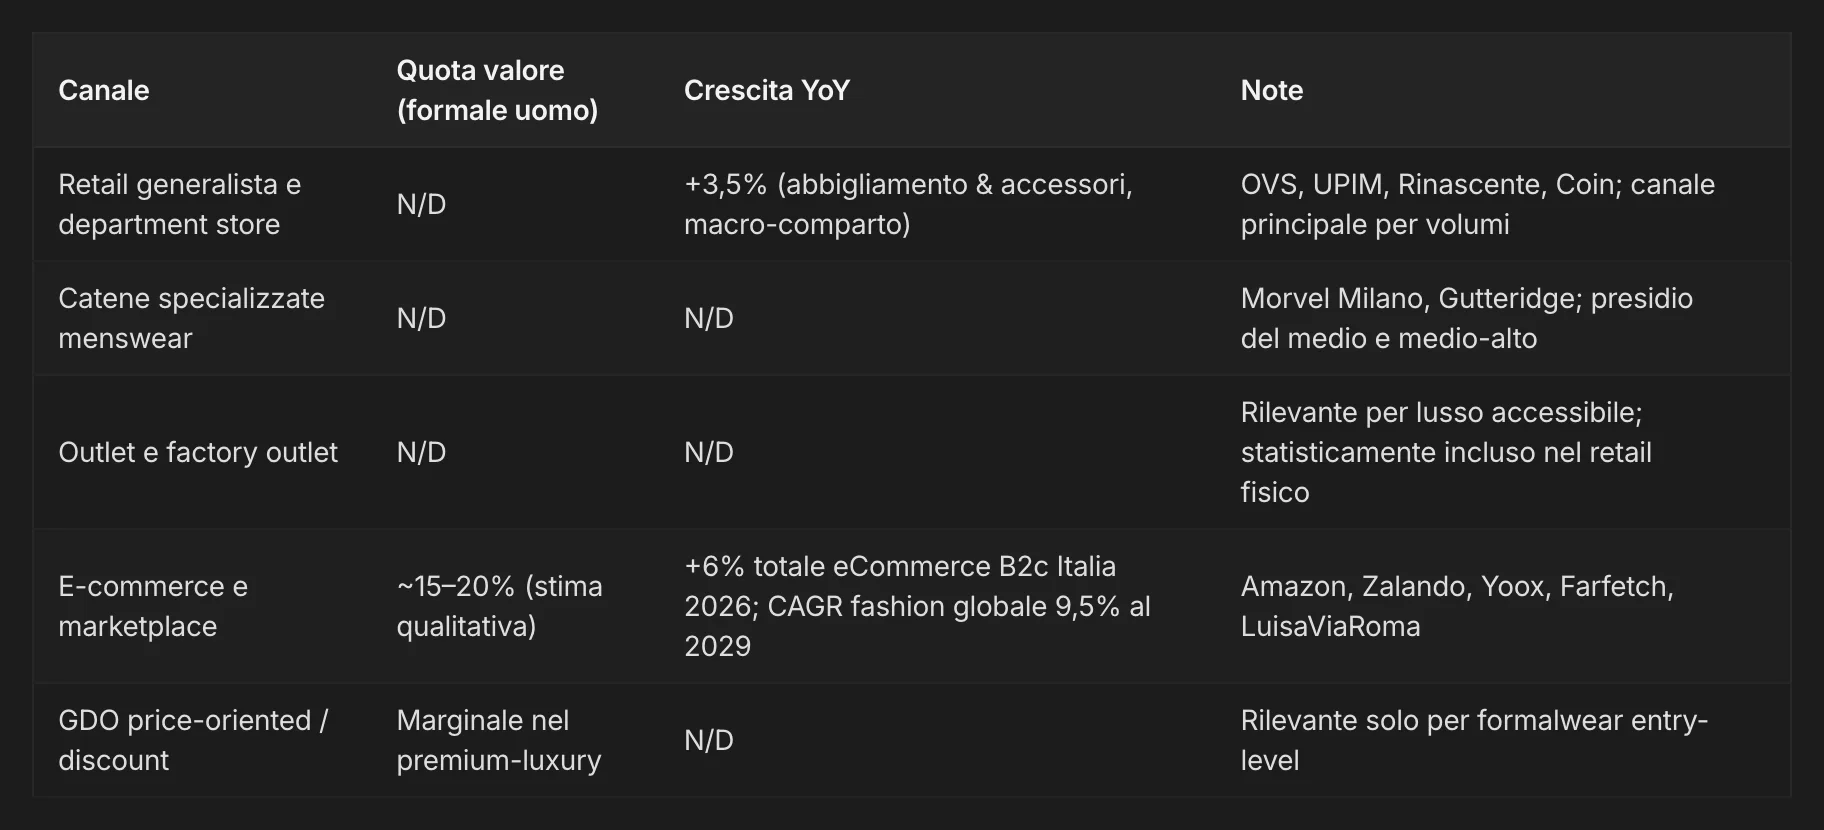
How the market splits by channel, how fast each one grows, the retailers and platforms that matter, the distribution strategies by price tier.
You know where it sells, and where to sell.
Competitors
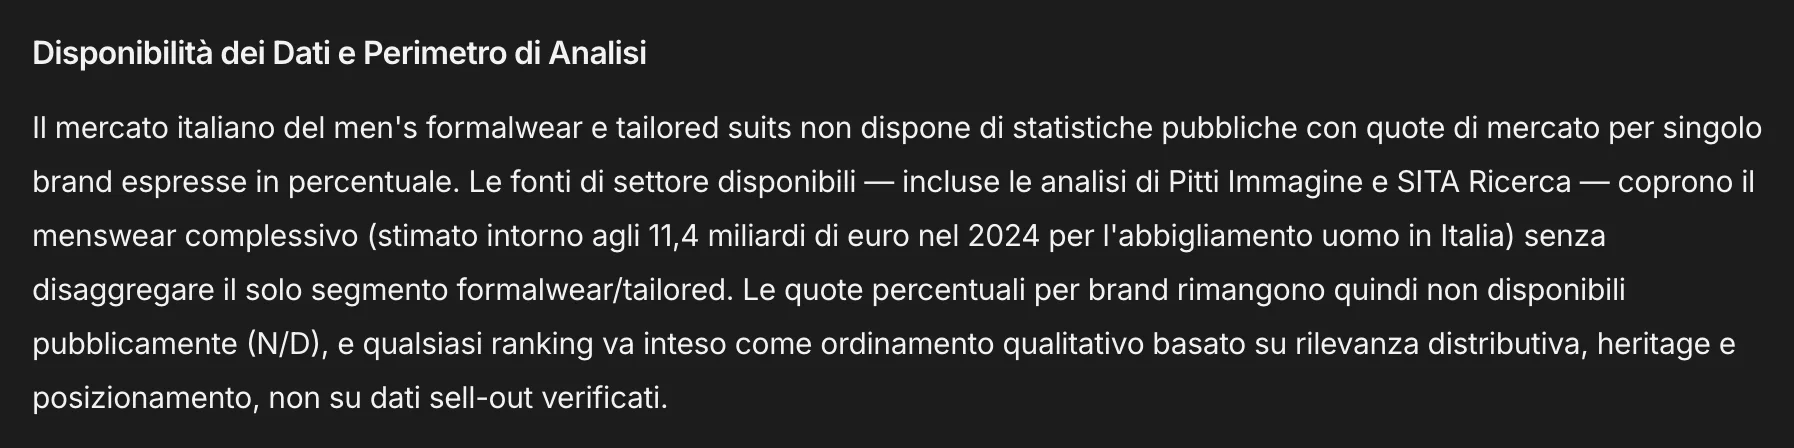
Market shares and competitive structure by price tier. And when shares aren’t public, MAPS says so — with the scope of the data available — instead of making them up.
You know who you’re up against, and how solid your knowledge is.
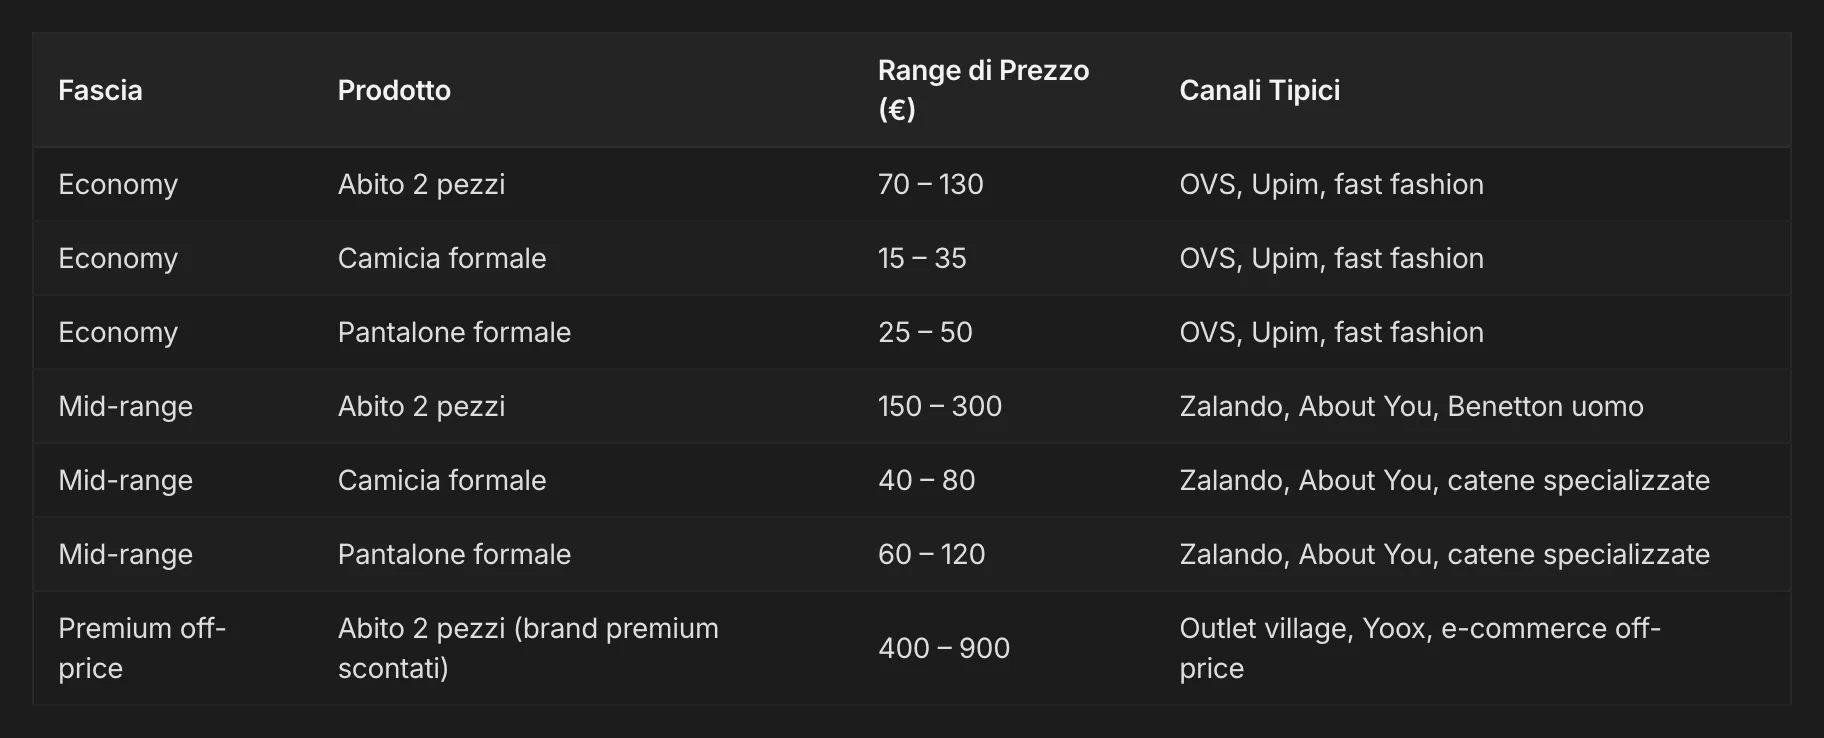
Pricing
Price bands by channel and by product, competitors’ price positioning relative to the brand, the gap between value and price.
You know where the price sits, and how much room there is.
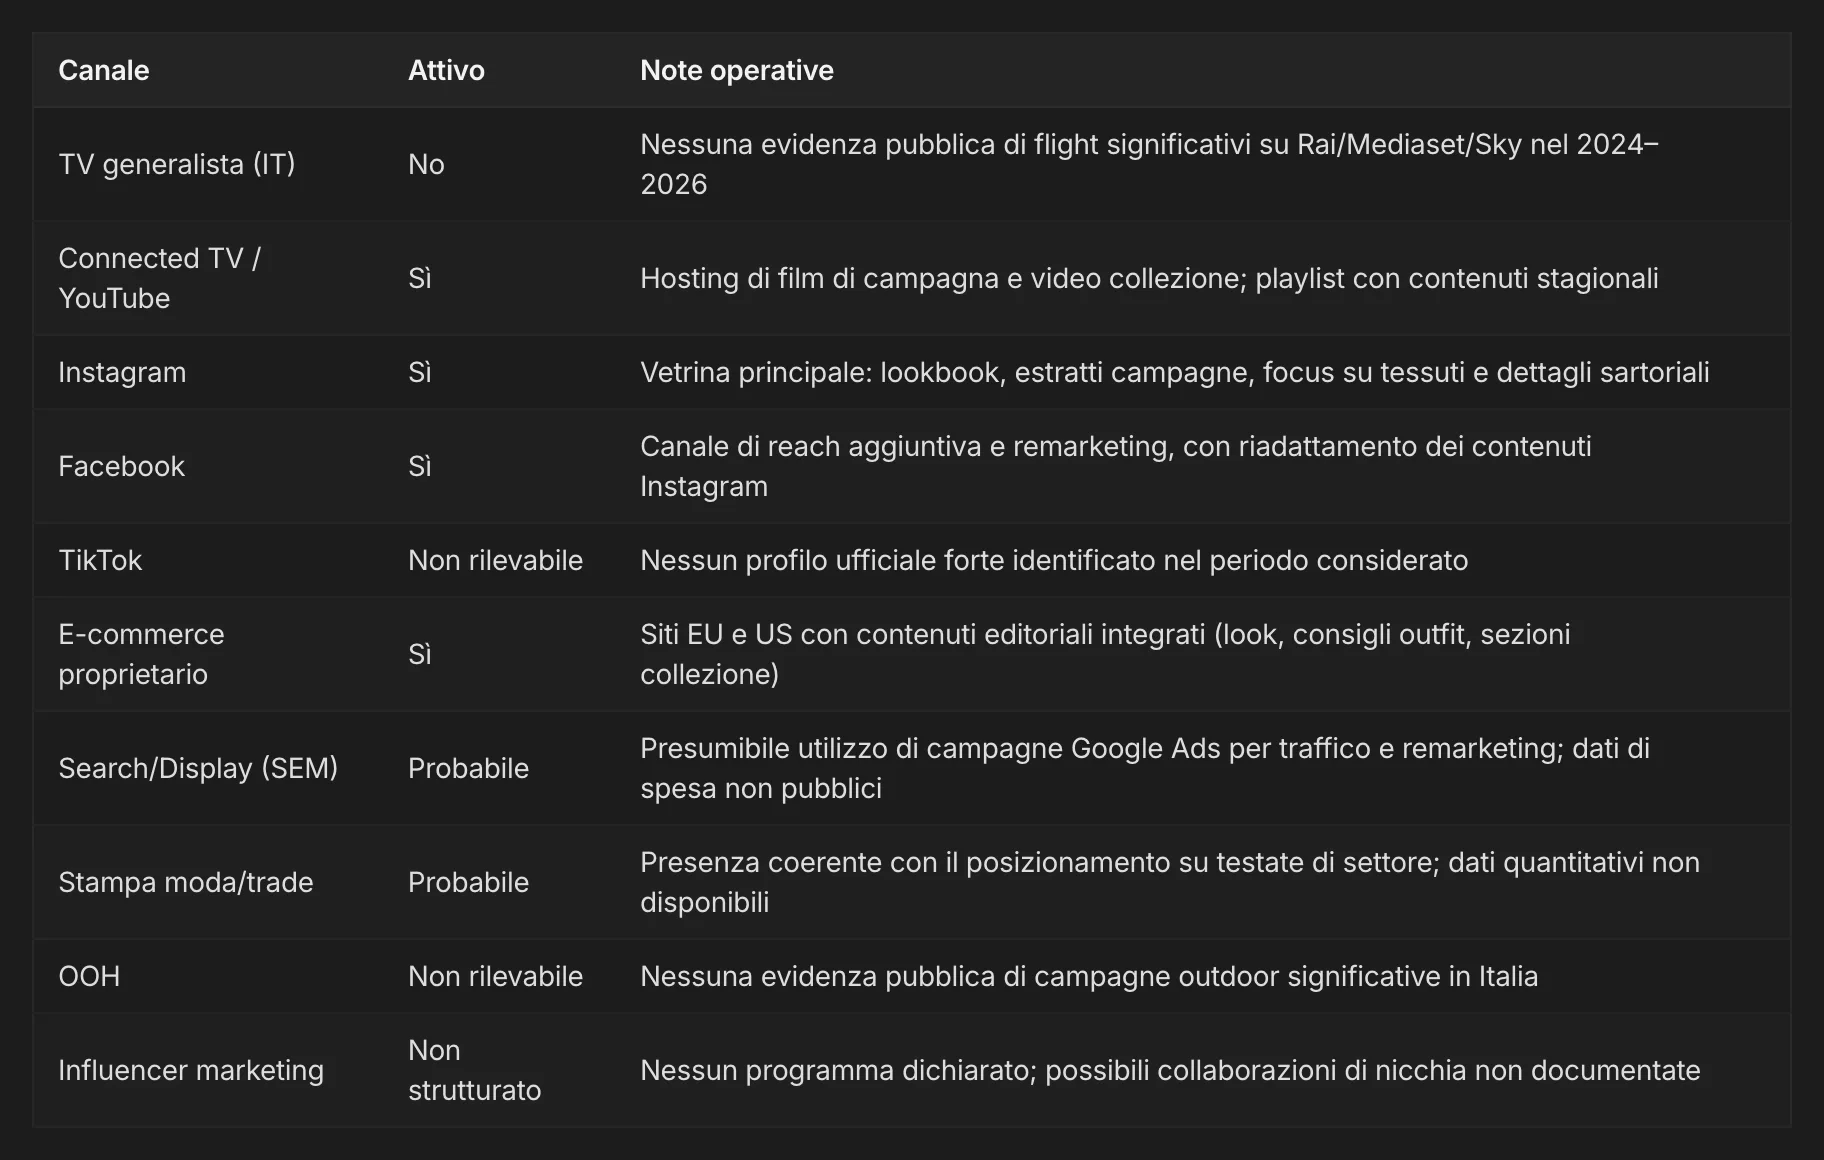
Ads
The media the brand actually uses, recent campaigns, competitors’ level of visibility, communication trends. Budget and share of voice only if they’re public: otherwise N/A.
You know how the category communicates.
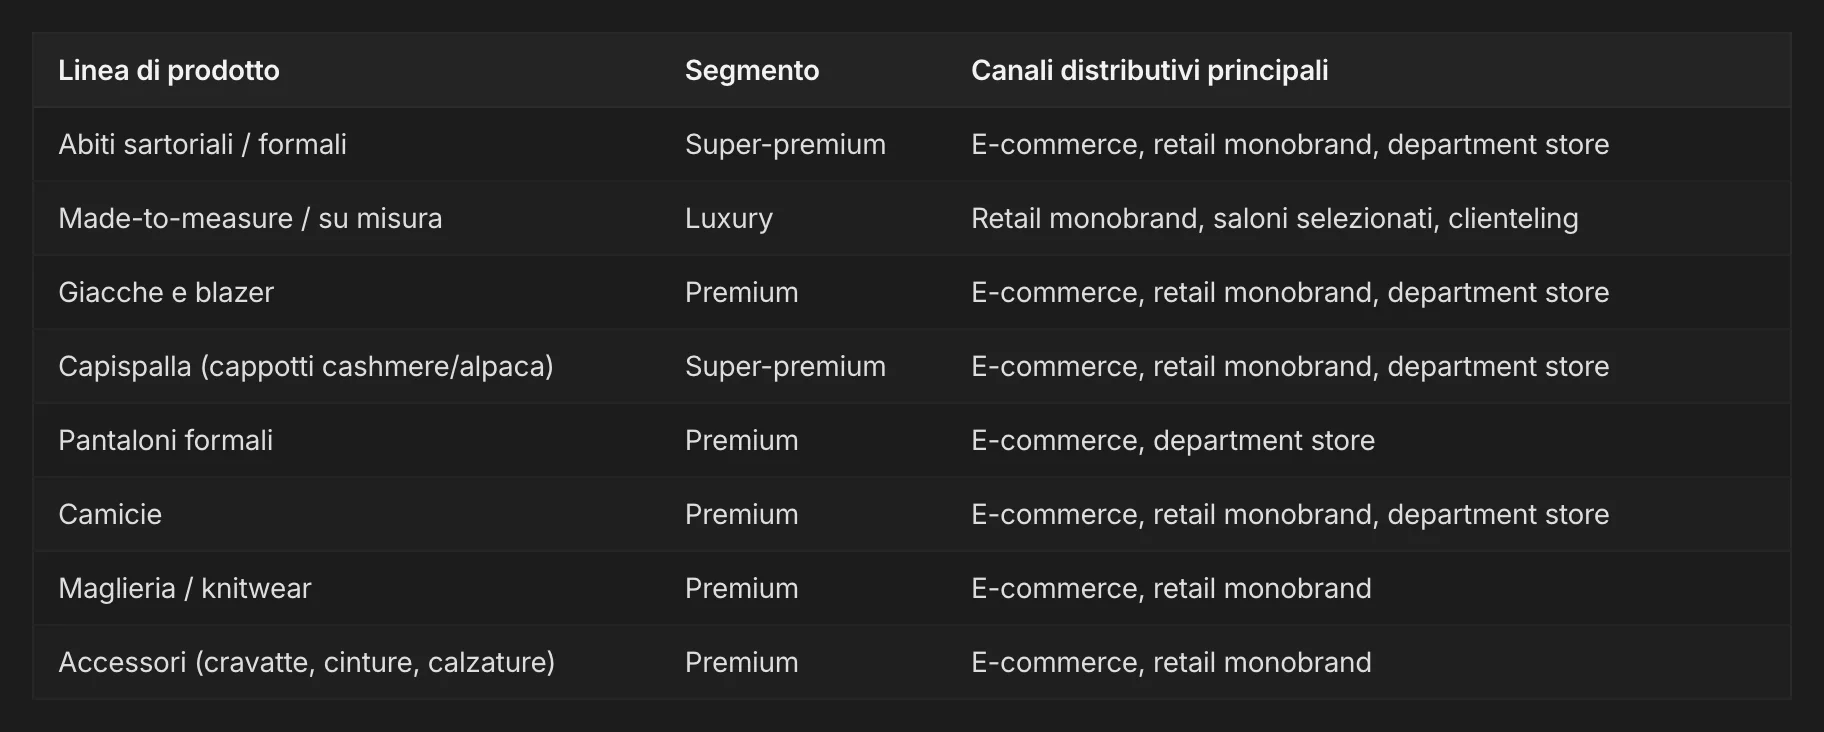
Portfolio
The product lines with their segment and channels, the flagship products, the comparison with competitors’ portfolios, the strengths and the gaps.
You know what the brand sells, and what’s missing.
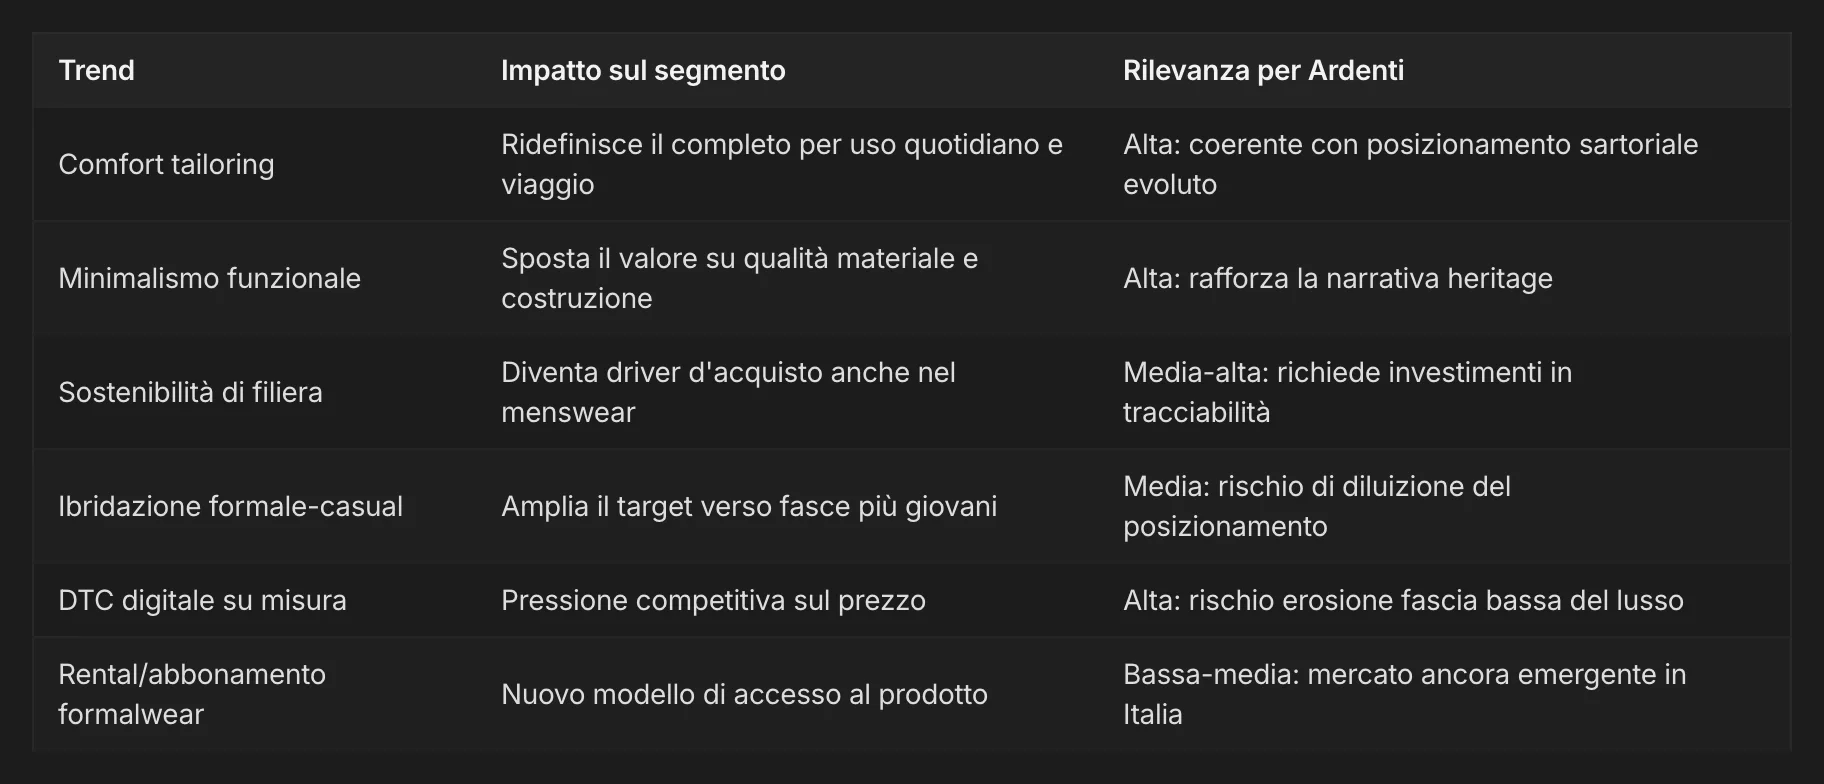
Innovations
Product and service innovations in the category and the trends driving them, each with its relevance to the brand.
You know what’s coming.
Above you saw a piece.
This is a whole tab.
The channels tab, from start to finish, exactly as it comes out of the research: the market structure, the retailers, the chains, the platforms, the strategies by price tier, the trends.
Scroll inside the window. Then multiply by eight.
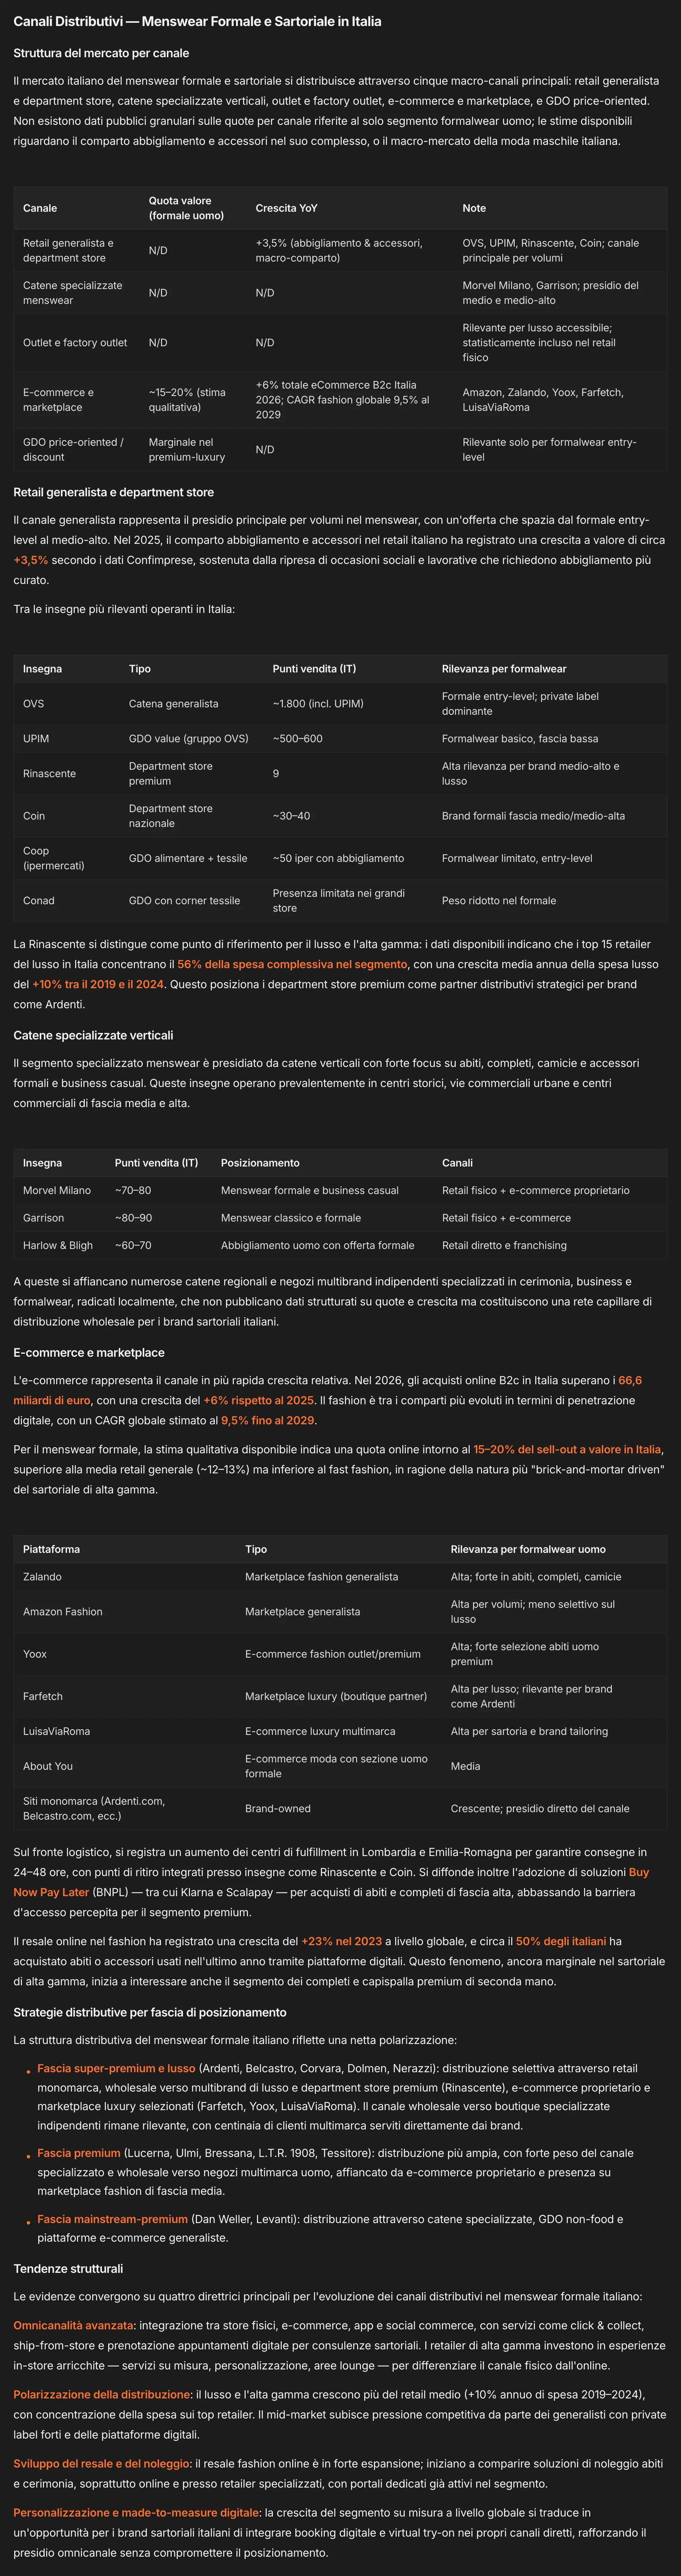
One of the eight tabs. Brand and competitors with fictional names; retailers and platforms are the market’s real ones.
Every reading can be checked.
A quality score
Every analysis has one: it tells you how solid it is, before you use it.
The date
You know when the reading was made. When you regenerate, the previous one stays in the history.
N/A, not made-up numbers
When a figure isn’t public, MAPS says so. Estimates are flagged as estimates.
The sources
Right-click a sentence: MAPS finds where it comes from, and checks it.
Select.
Right-click.
You read a passage that interests you and take it further from there, without switching screens.
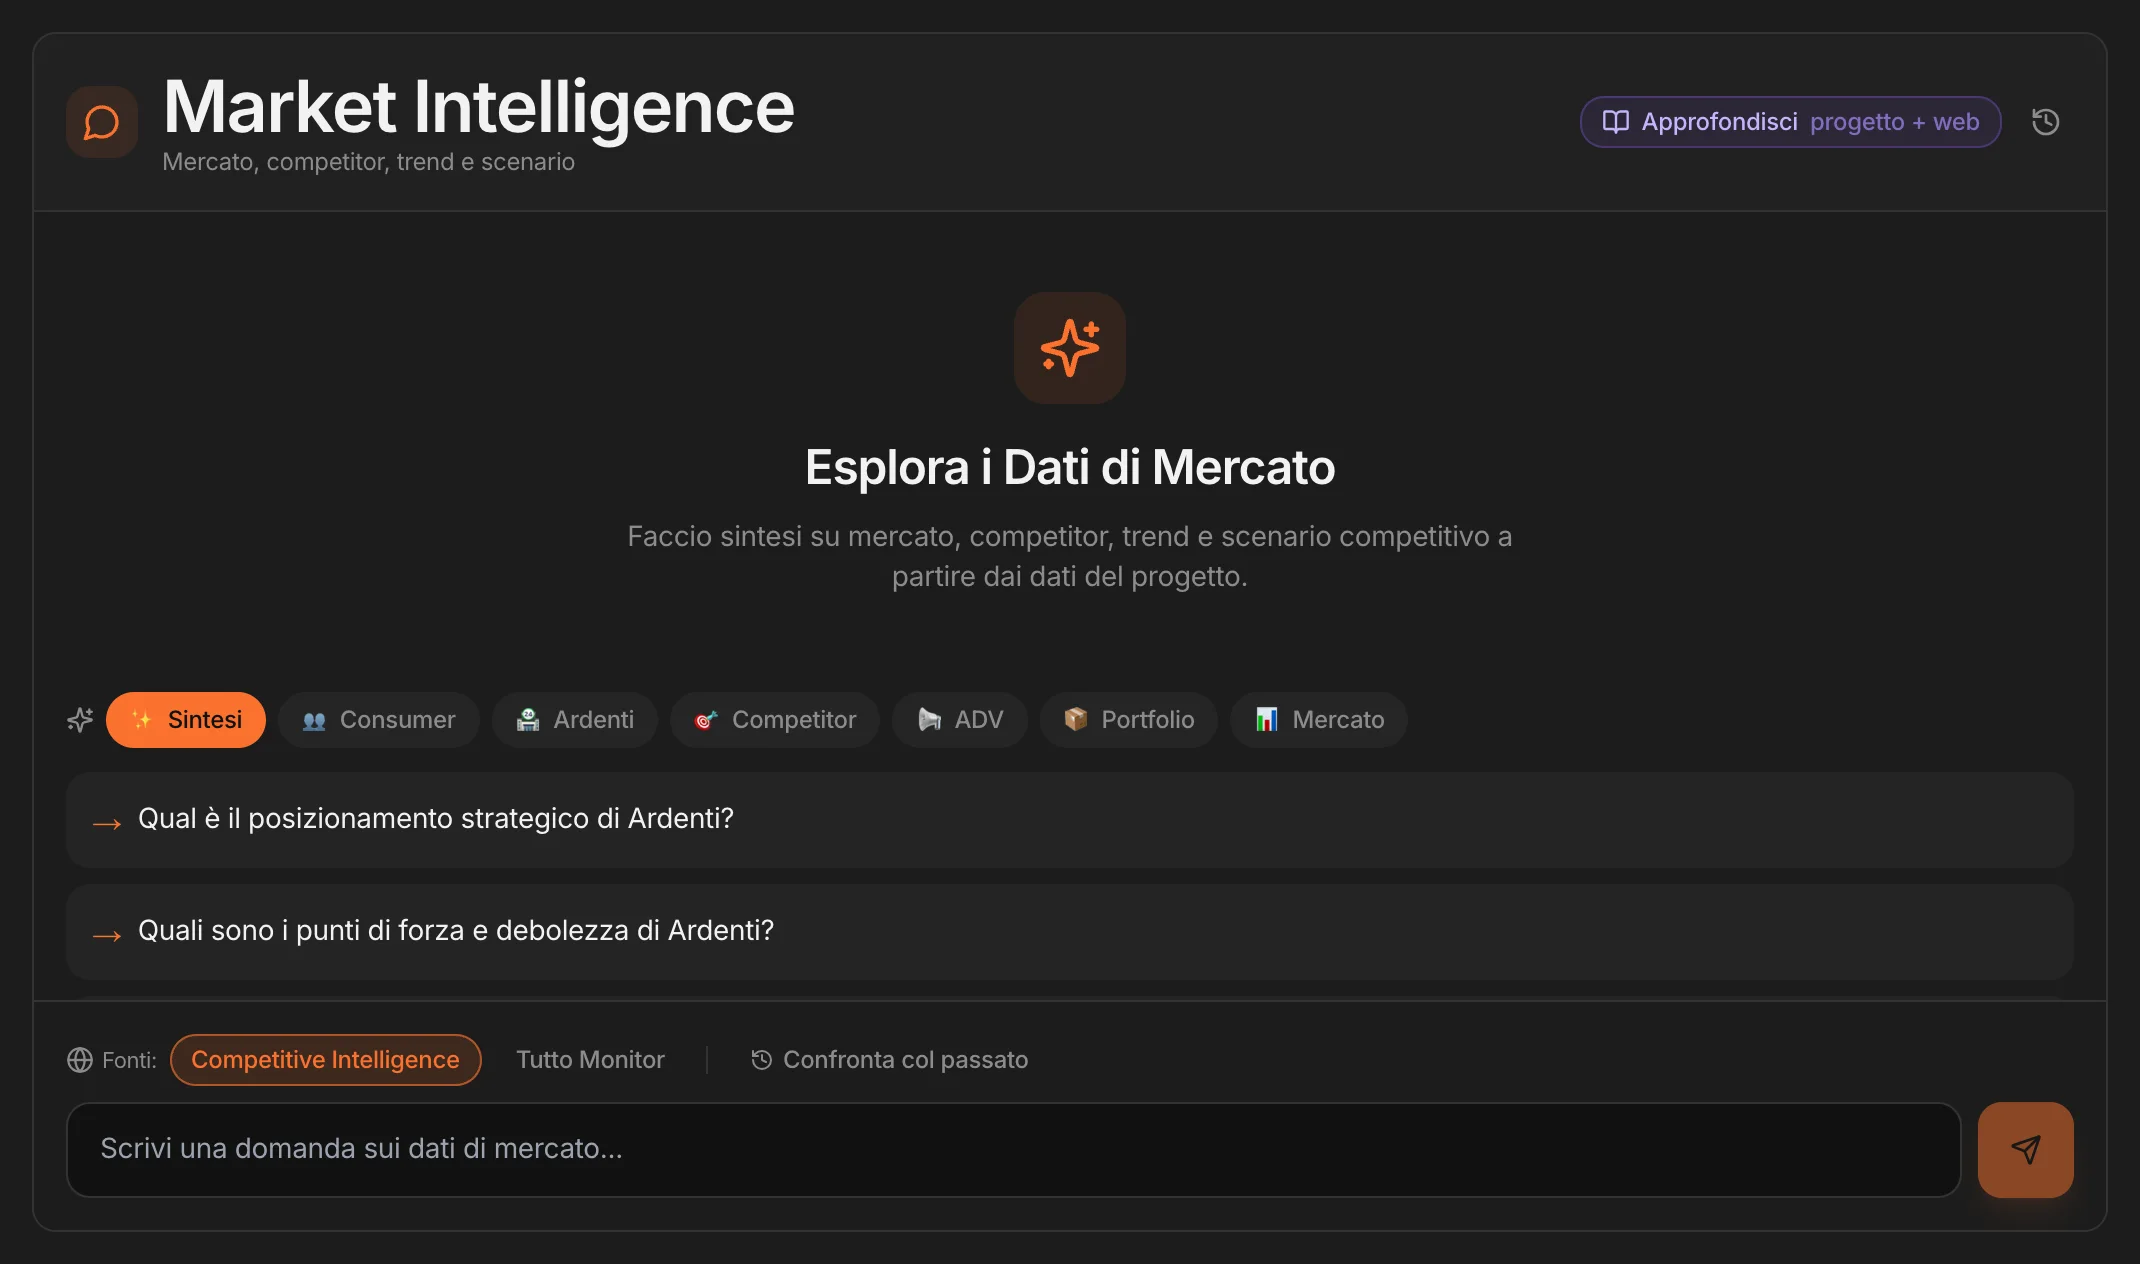
Market Intelligence.
Your market questions, in one place.
In the last tab there’s a chat that answers on market, competitors, trends and scenario, starting from the project’s data. The questions are ready-made, area by area; and you choose what it reasons on: Competitive Intelligence alone, or all of Monitor. With Compare with the past it also tells you what has changed since the previous reading.
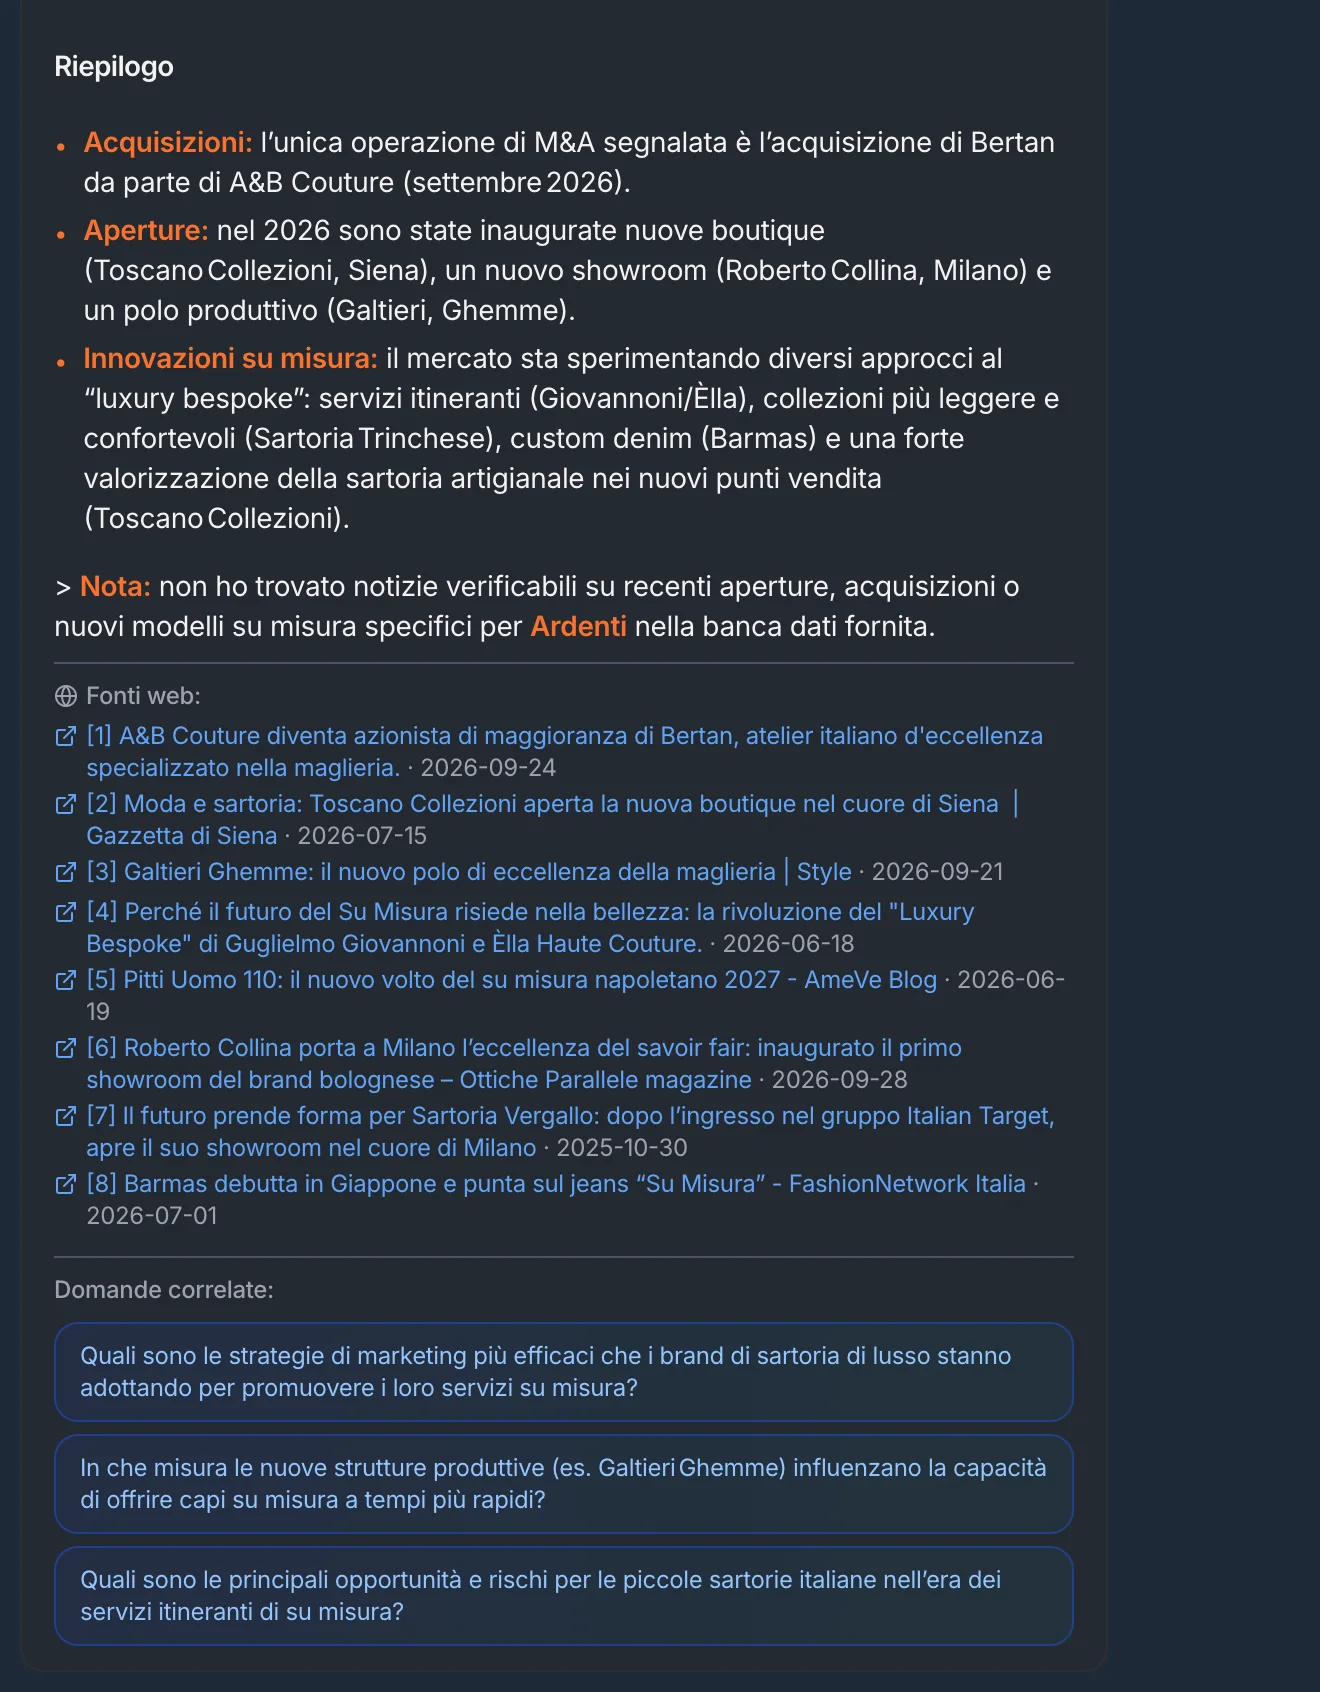
When the project isn’t enough,
search the web.
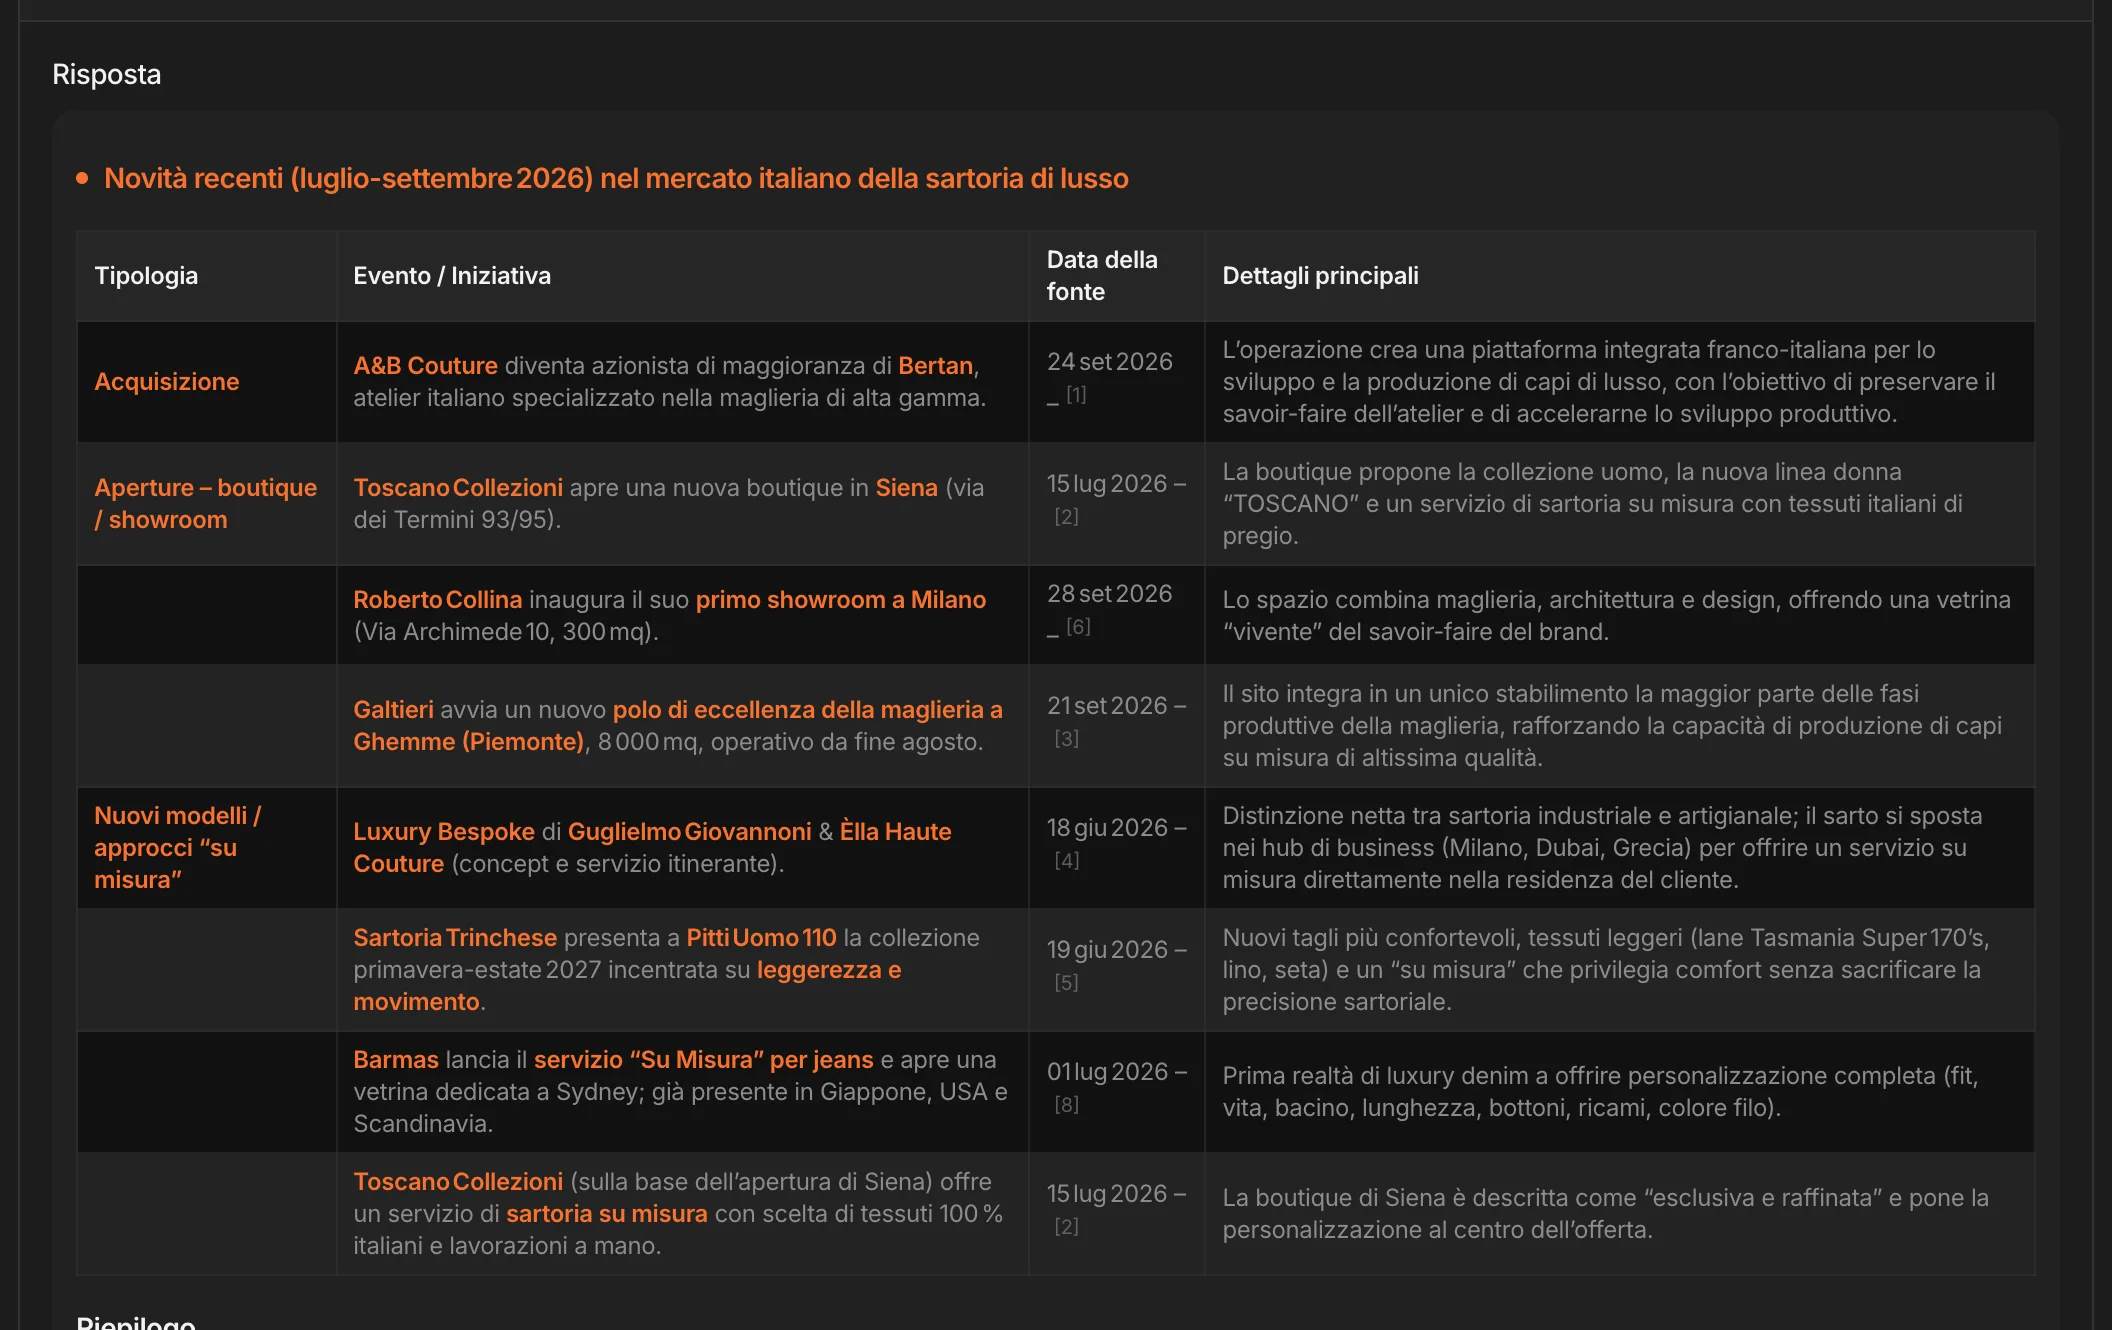
Ask an open question. MAPS answers first from what the project already knows; if that’s not enough, it finds the articles and answers citing every fact with its source and its date. You know whether a piece of news is from yesterday or from a year ago.
What you save goes into the project.
A saved deep dive stays in Saved Insights, laid out as in the chat, and goes into the project’s memory: the chat and the tools use it later. Next time, the answer comes straight from there.
Ready to share, as it is.
Export PDF
The tab you’re looking at.
Full Report
All the tabs in one document.
AI Strategic Synthesis
Pick the sections: MAPS writes the synthesis, as a PDF or in PowerPoint.
To the Canvas
A whole tab, a captured area or a single passage, to work on it alongside the rest of your work.
From the tabs to a deck.
In a minute.
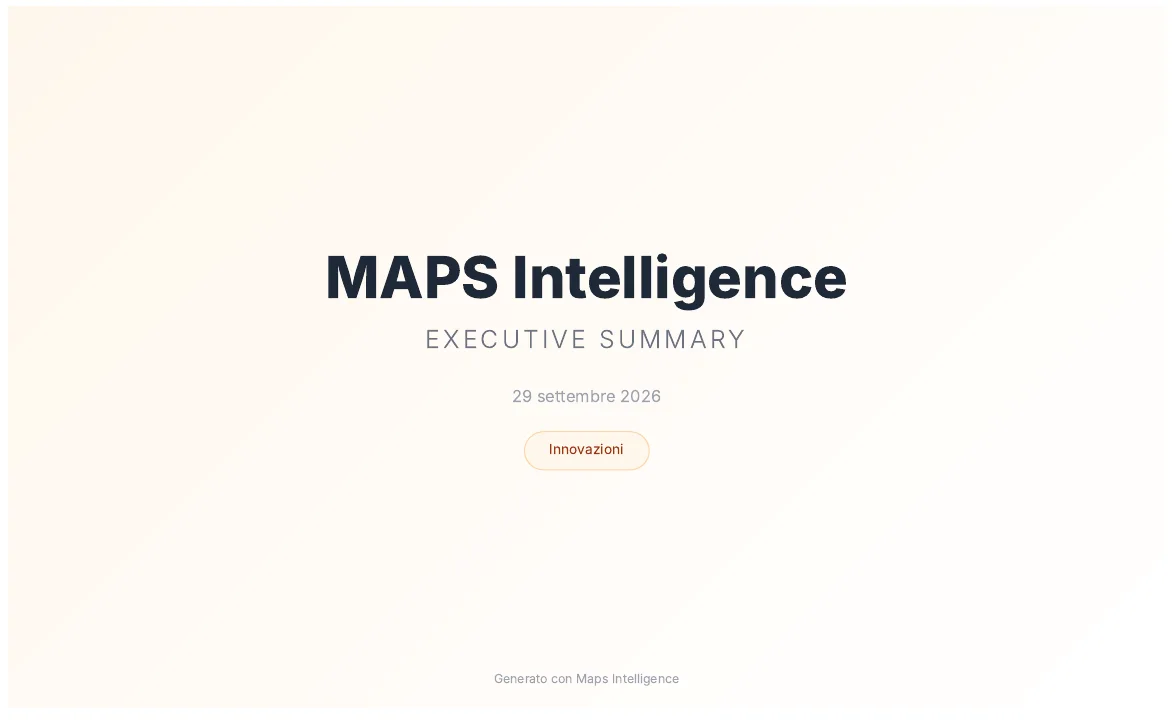
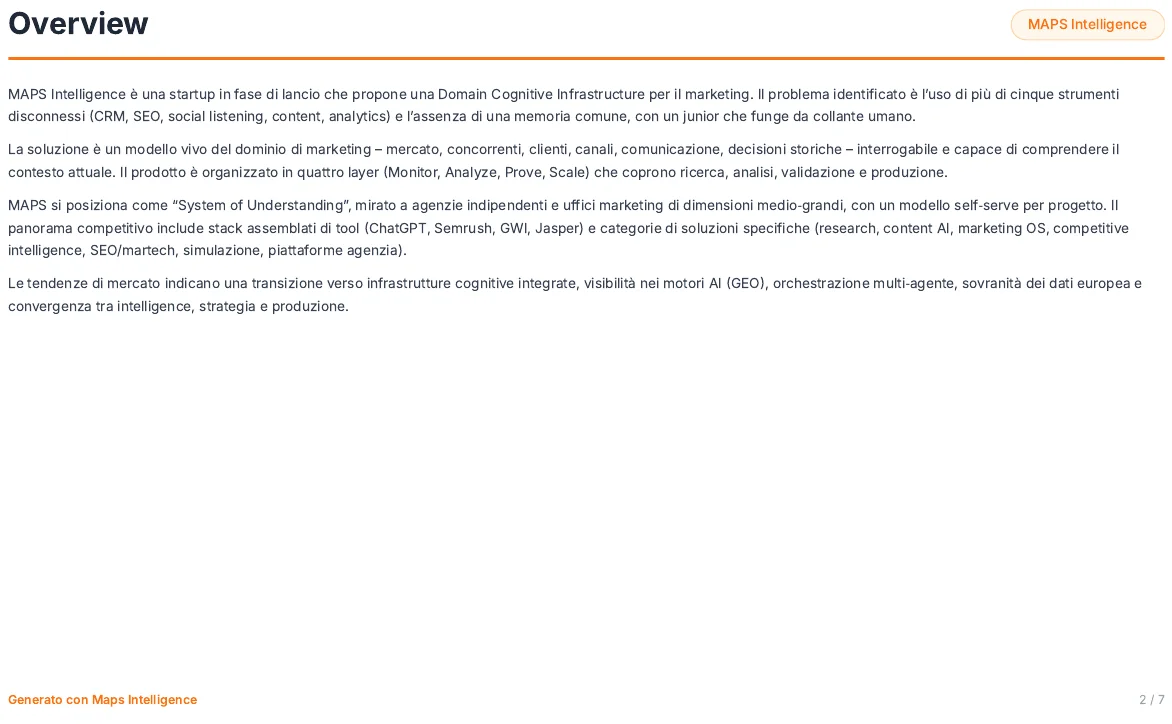
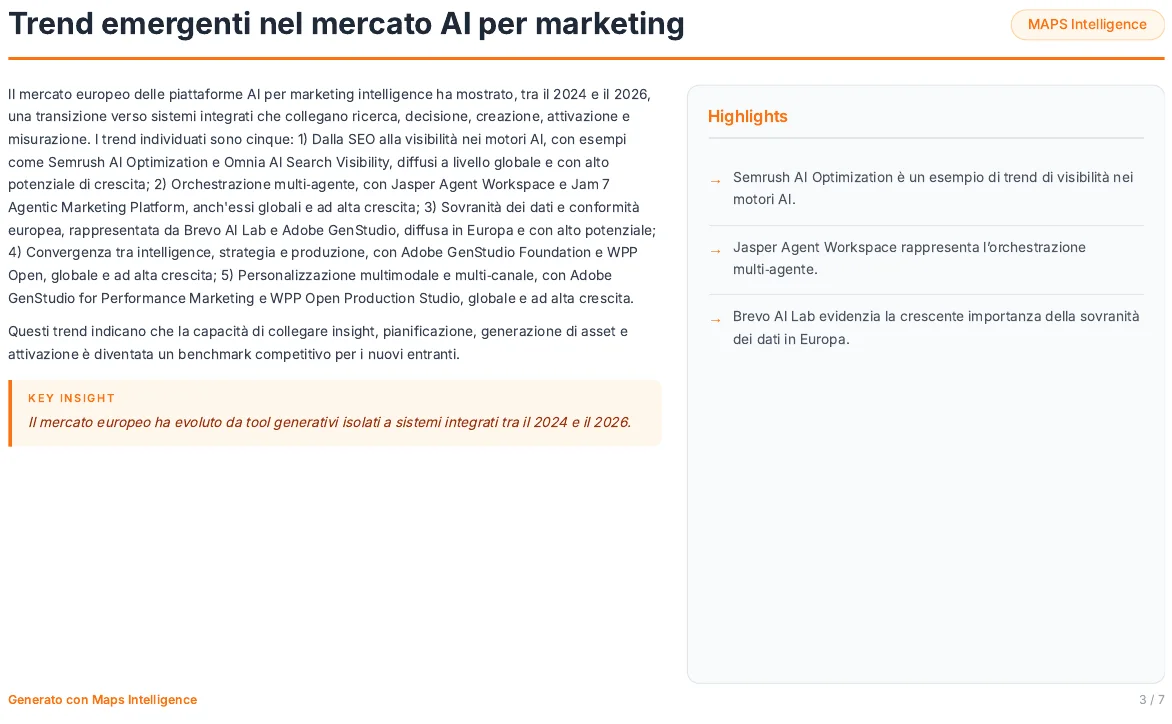
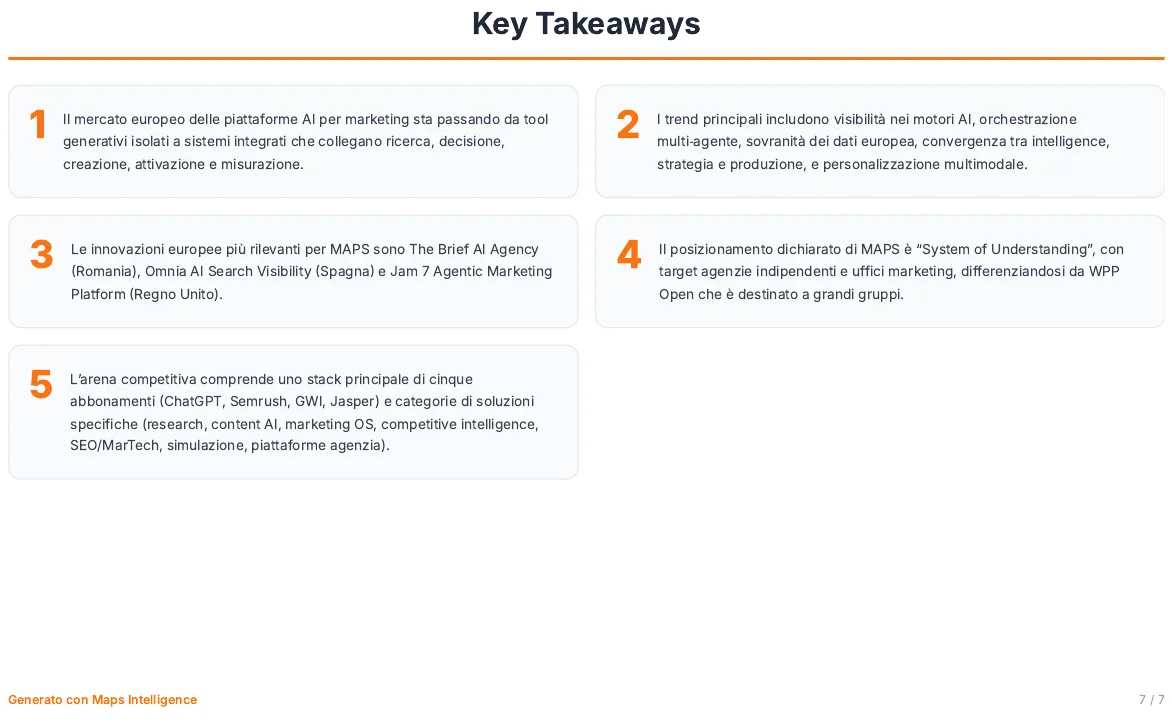
Pick the sections and press AI Strategic Synthesis: MAPS writes the executive summary — overview, one slide per theme with its key insight and highlights, the key takeaways — and gives it to you as a PDF or in PowerPoint, with editable text.