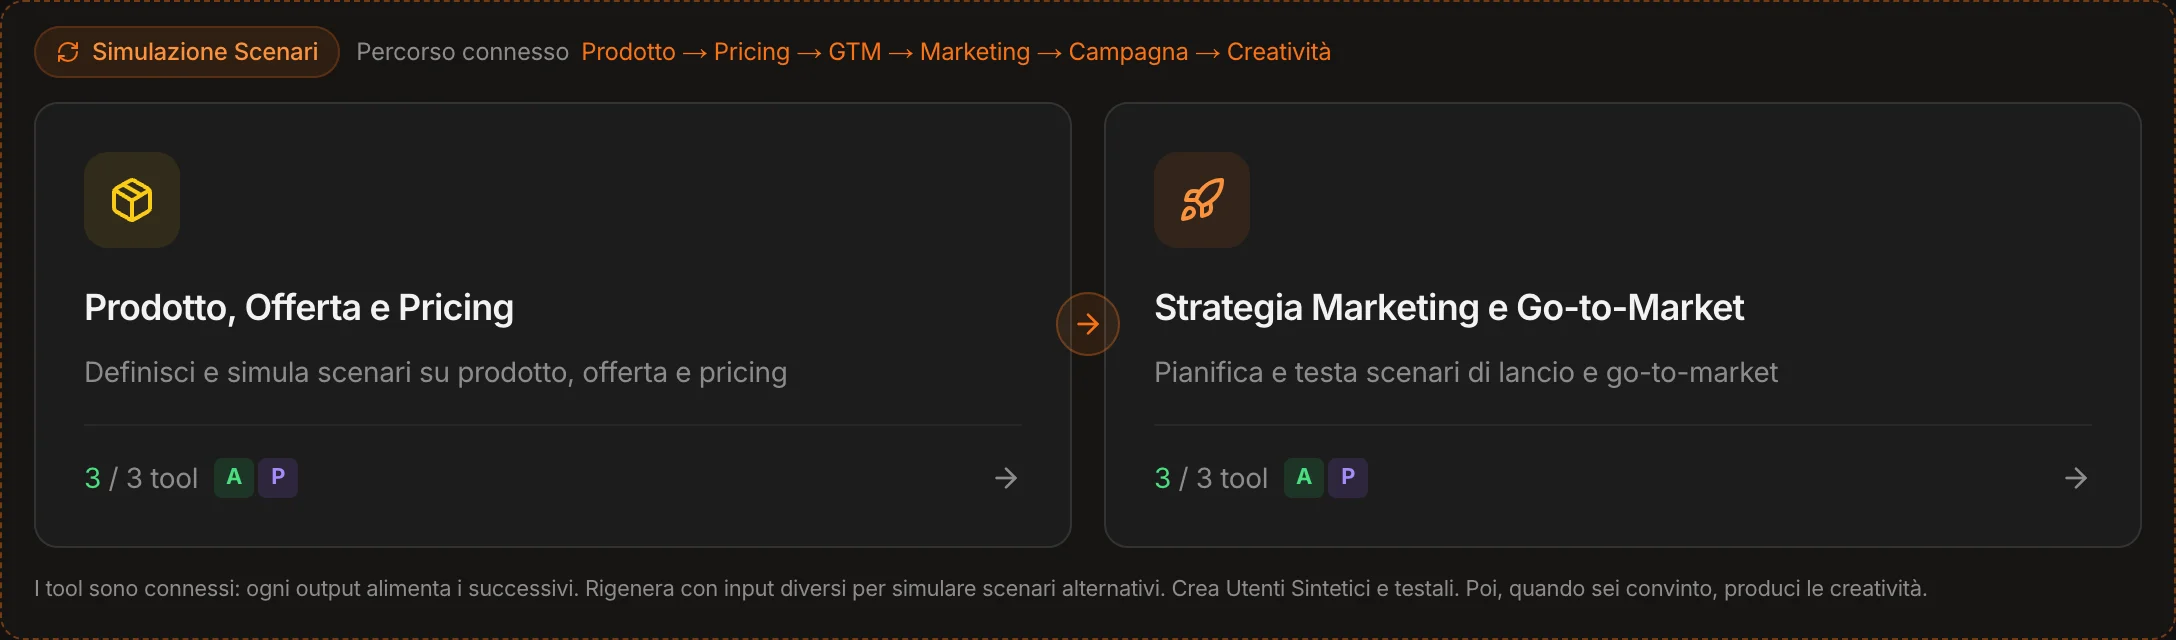
Six tools, connected.
Each tool opens already filled in with what the previous one produced, and reads everything upstream. At the end comes the creative work.
An idea becomes a concept.
And you can see it.
You give the name, the idea, the problem it solves — and, if you like, an indicative price and what makes it different. It can be a physical product, a digital one, a service, an experience. MAPS builds the whole concept: the problem and the opportunity, who the customer is, the value proposition, the must-have features and the ones for later, the business model, the competitors, the roadmap. And an image of the product, which you edit in plain words.
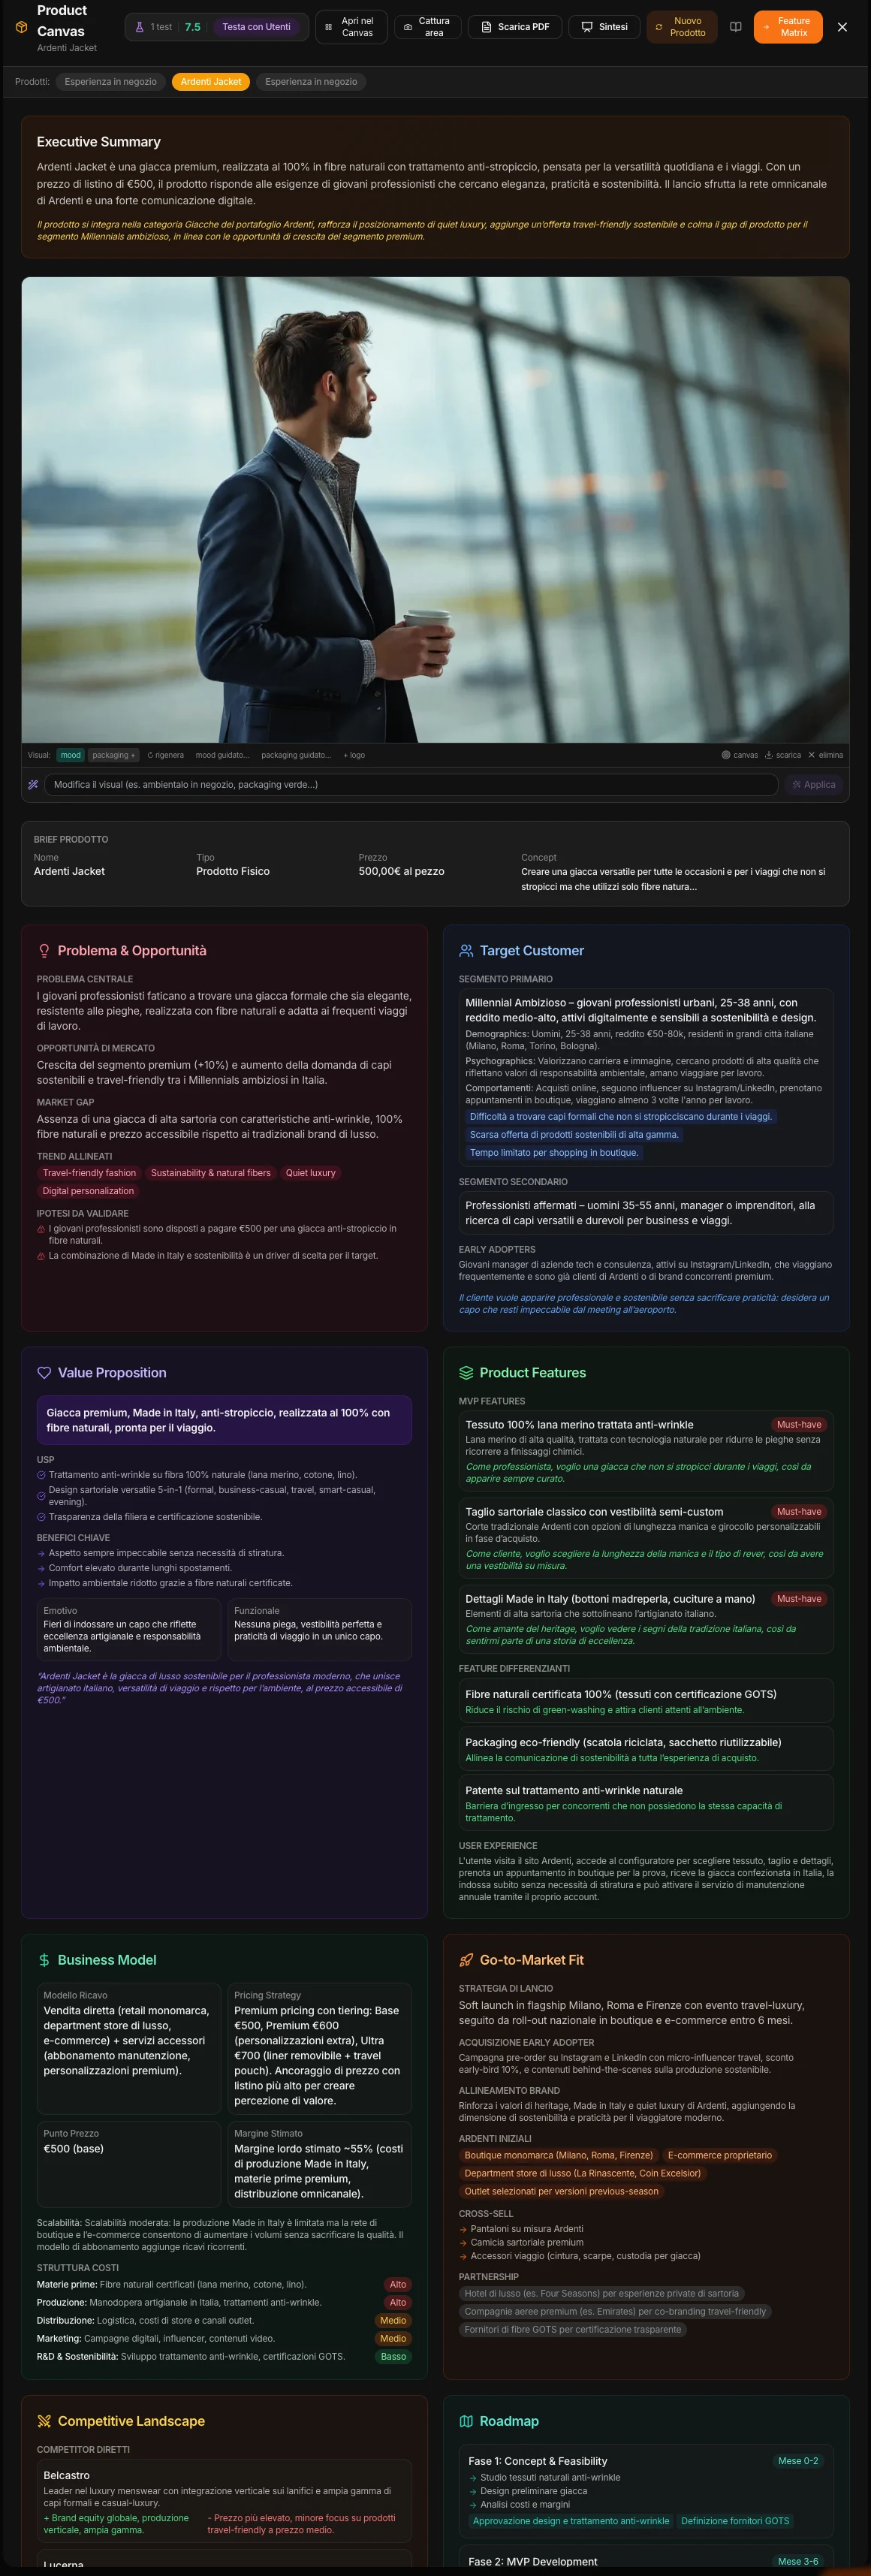
An image, edited in plain words.
MAPS generates the product — in a setting or as packaging — and you change it by writing: “put it in a store,” “green packaging.” Several concepts live side by side in the same project: here, a travel jacket and an in-boutique service.
The features, with the why.
For each feature, how essential it is, and the customer’s sentence that justifies it: “as a professional, I want a jacket that doesn’t wrinkle when I travel.”
And when to stop.
The risks, the plan to validate the idea, the metrics — and the stop criteria, the numbers below which you’re better off letting it go:
Before you invest,
ask the people who would buy it.
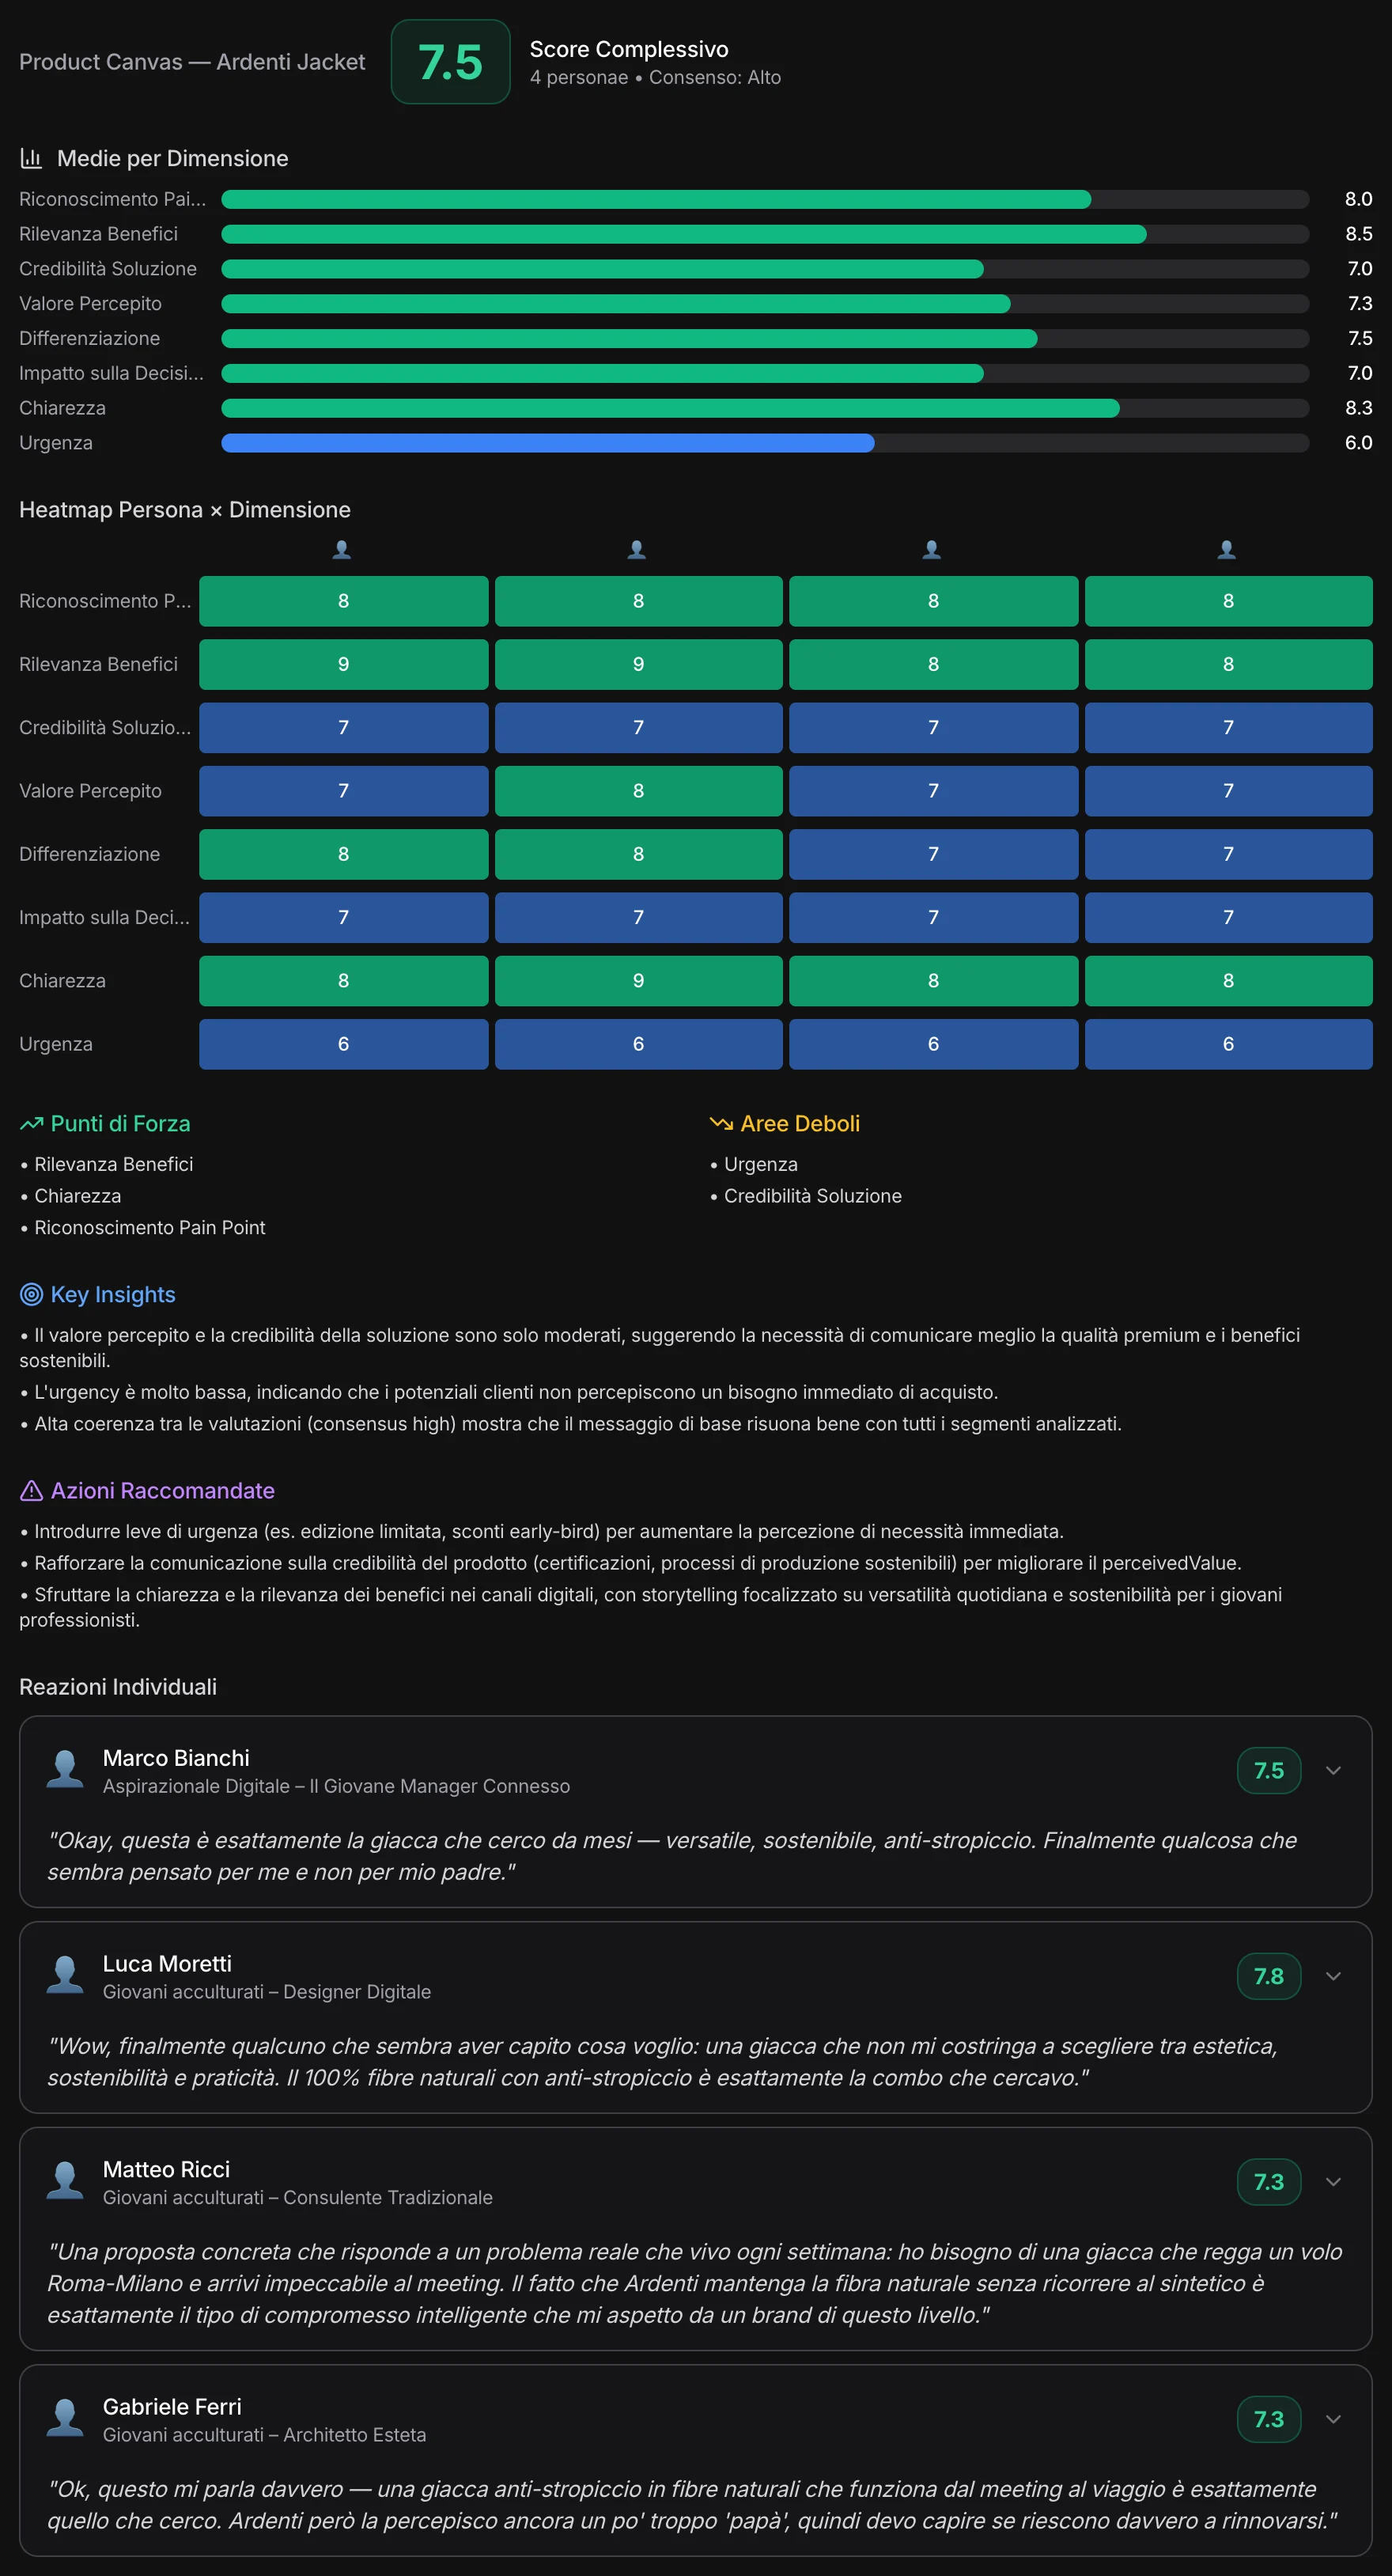
With “Test with Users,” the concept goes in front of the project’s synthetic users. Each one rates it on eight dimensions — do they recognize the problem? are the benefits relevant? is the solution credible? how urgent is it? — and reacts in their own words. MAPS pulls the scores together, shows where they agree and where they don’t, and tells you what to improve.
The score is good, 7.5 out of 10, but the test also shows where it falls short: urgency is low — nobody feels they need to buy it now — and credibility needs support. The recommended actions start from there.
Feature by feature,
against the competition.
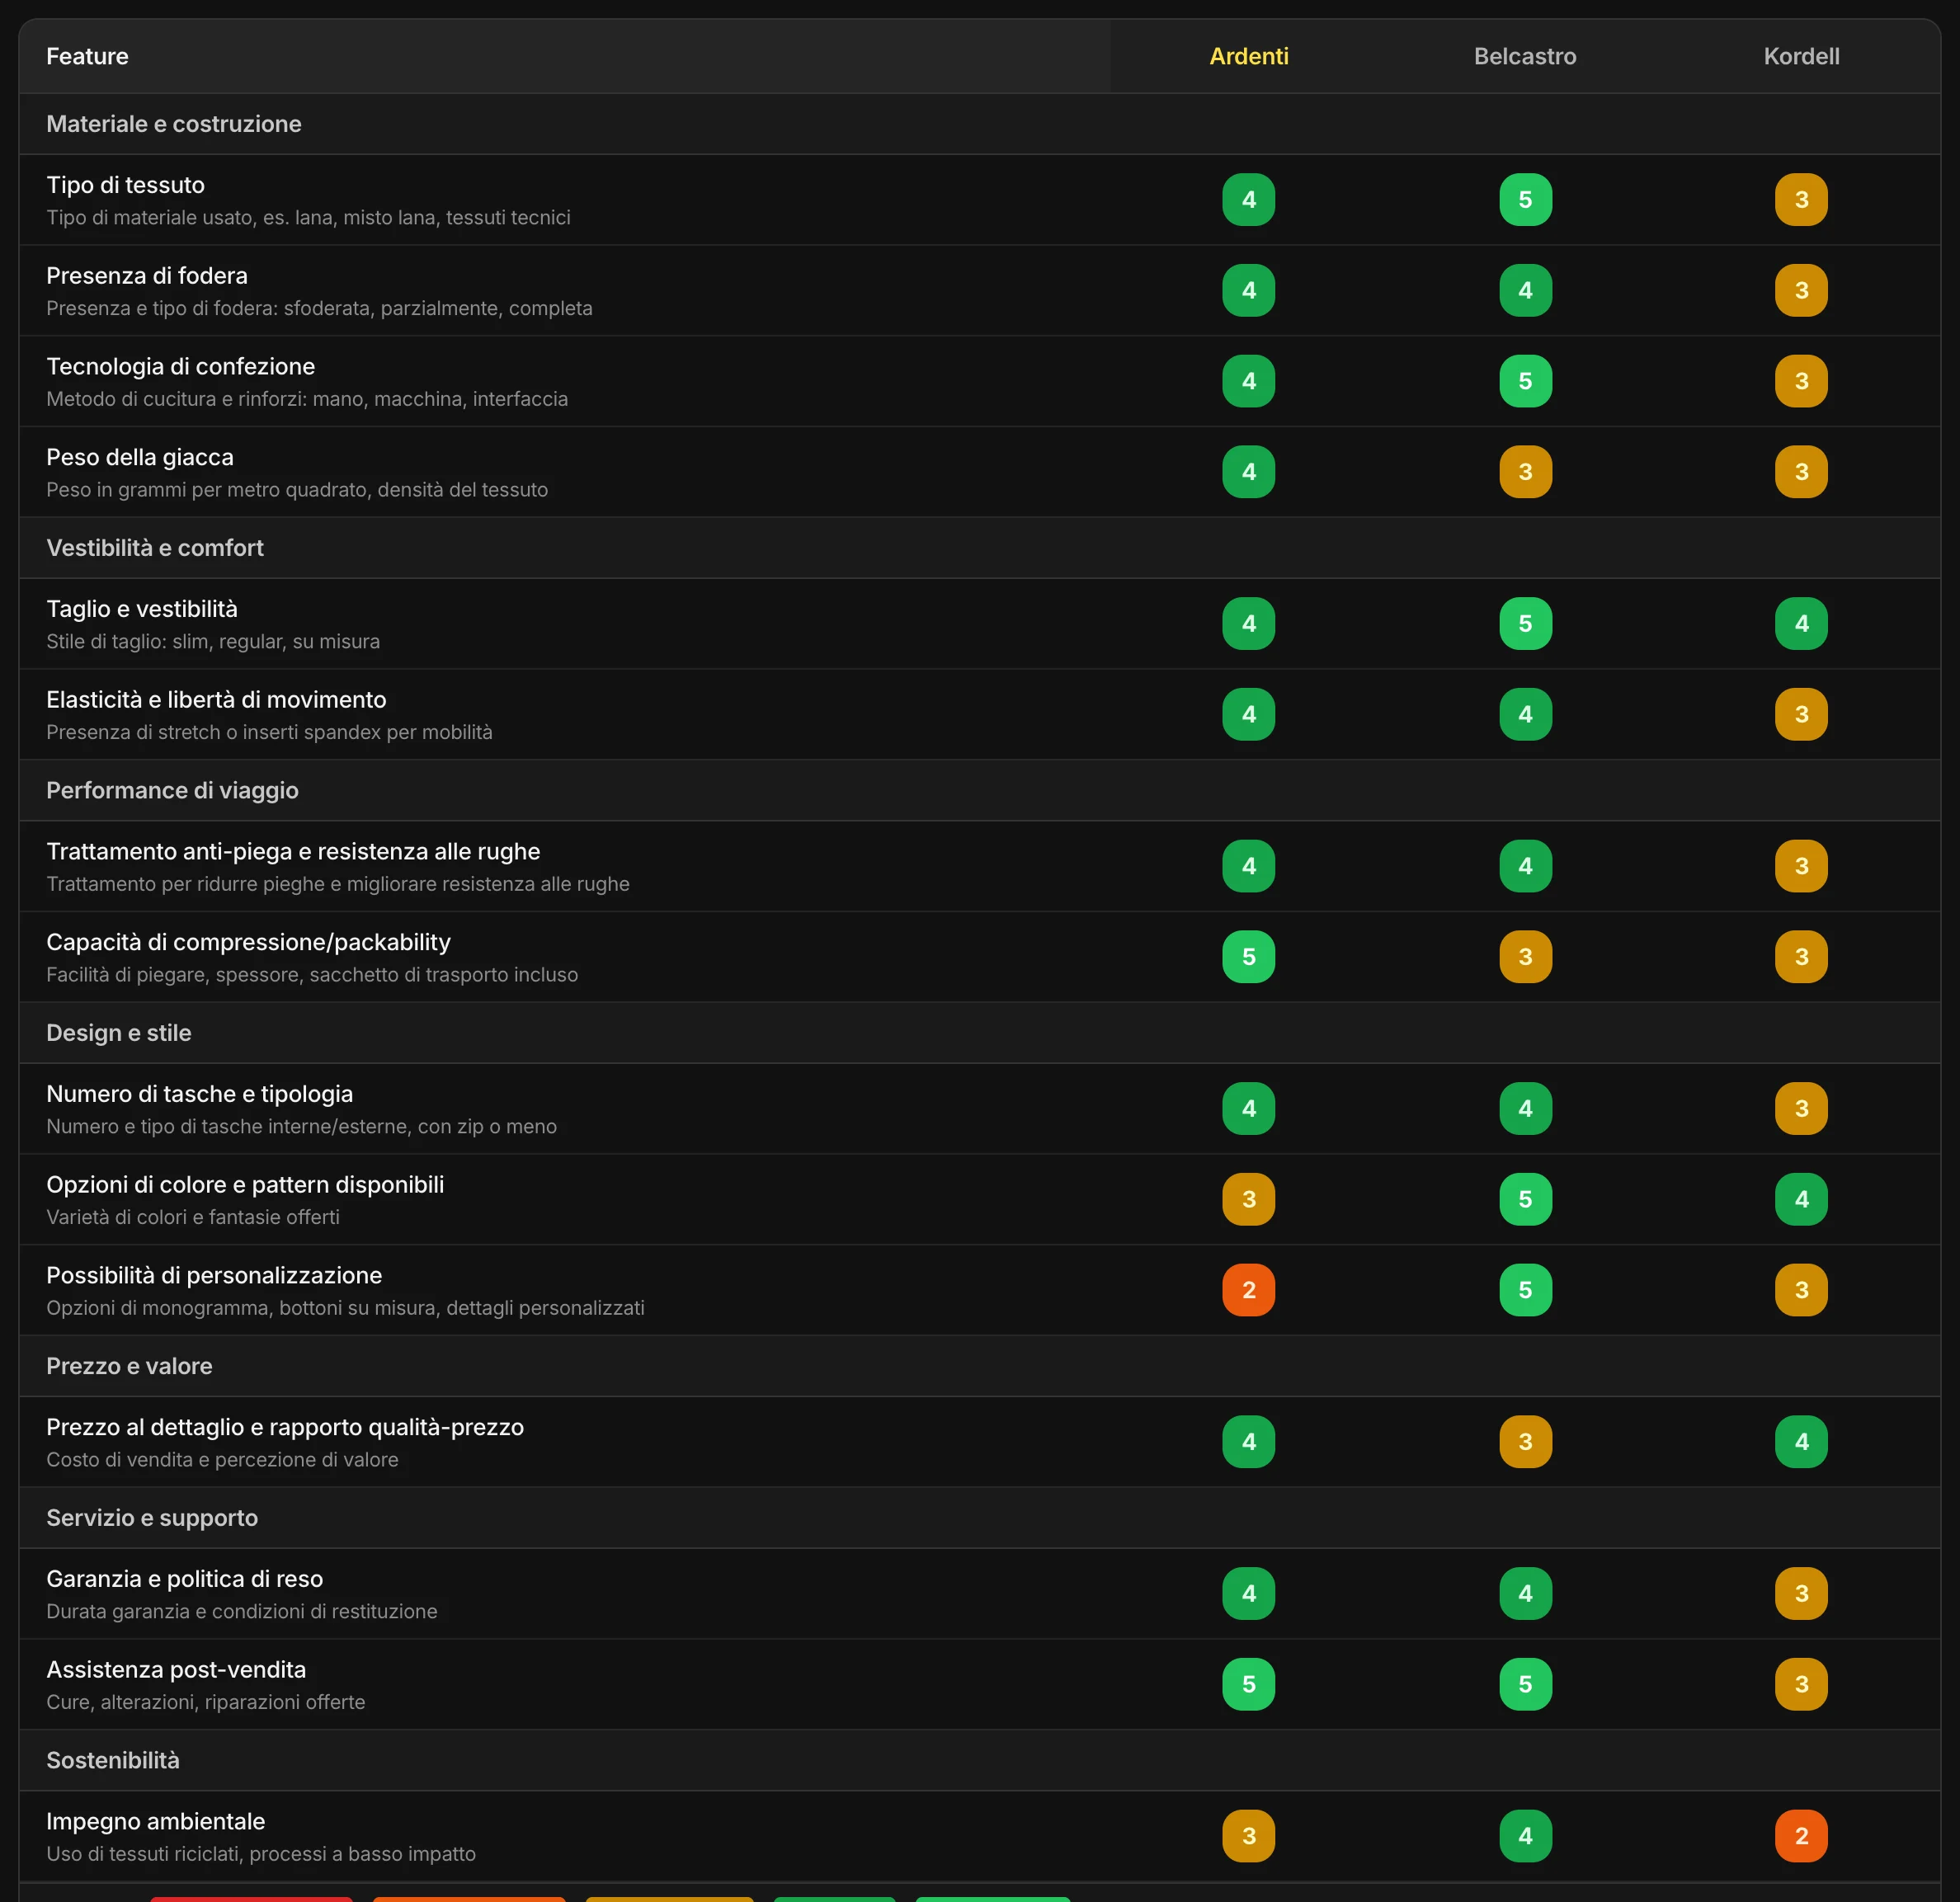
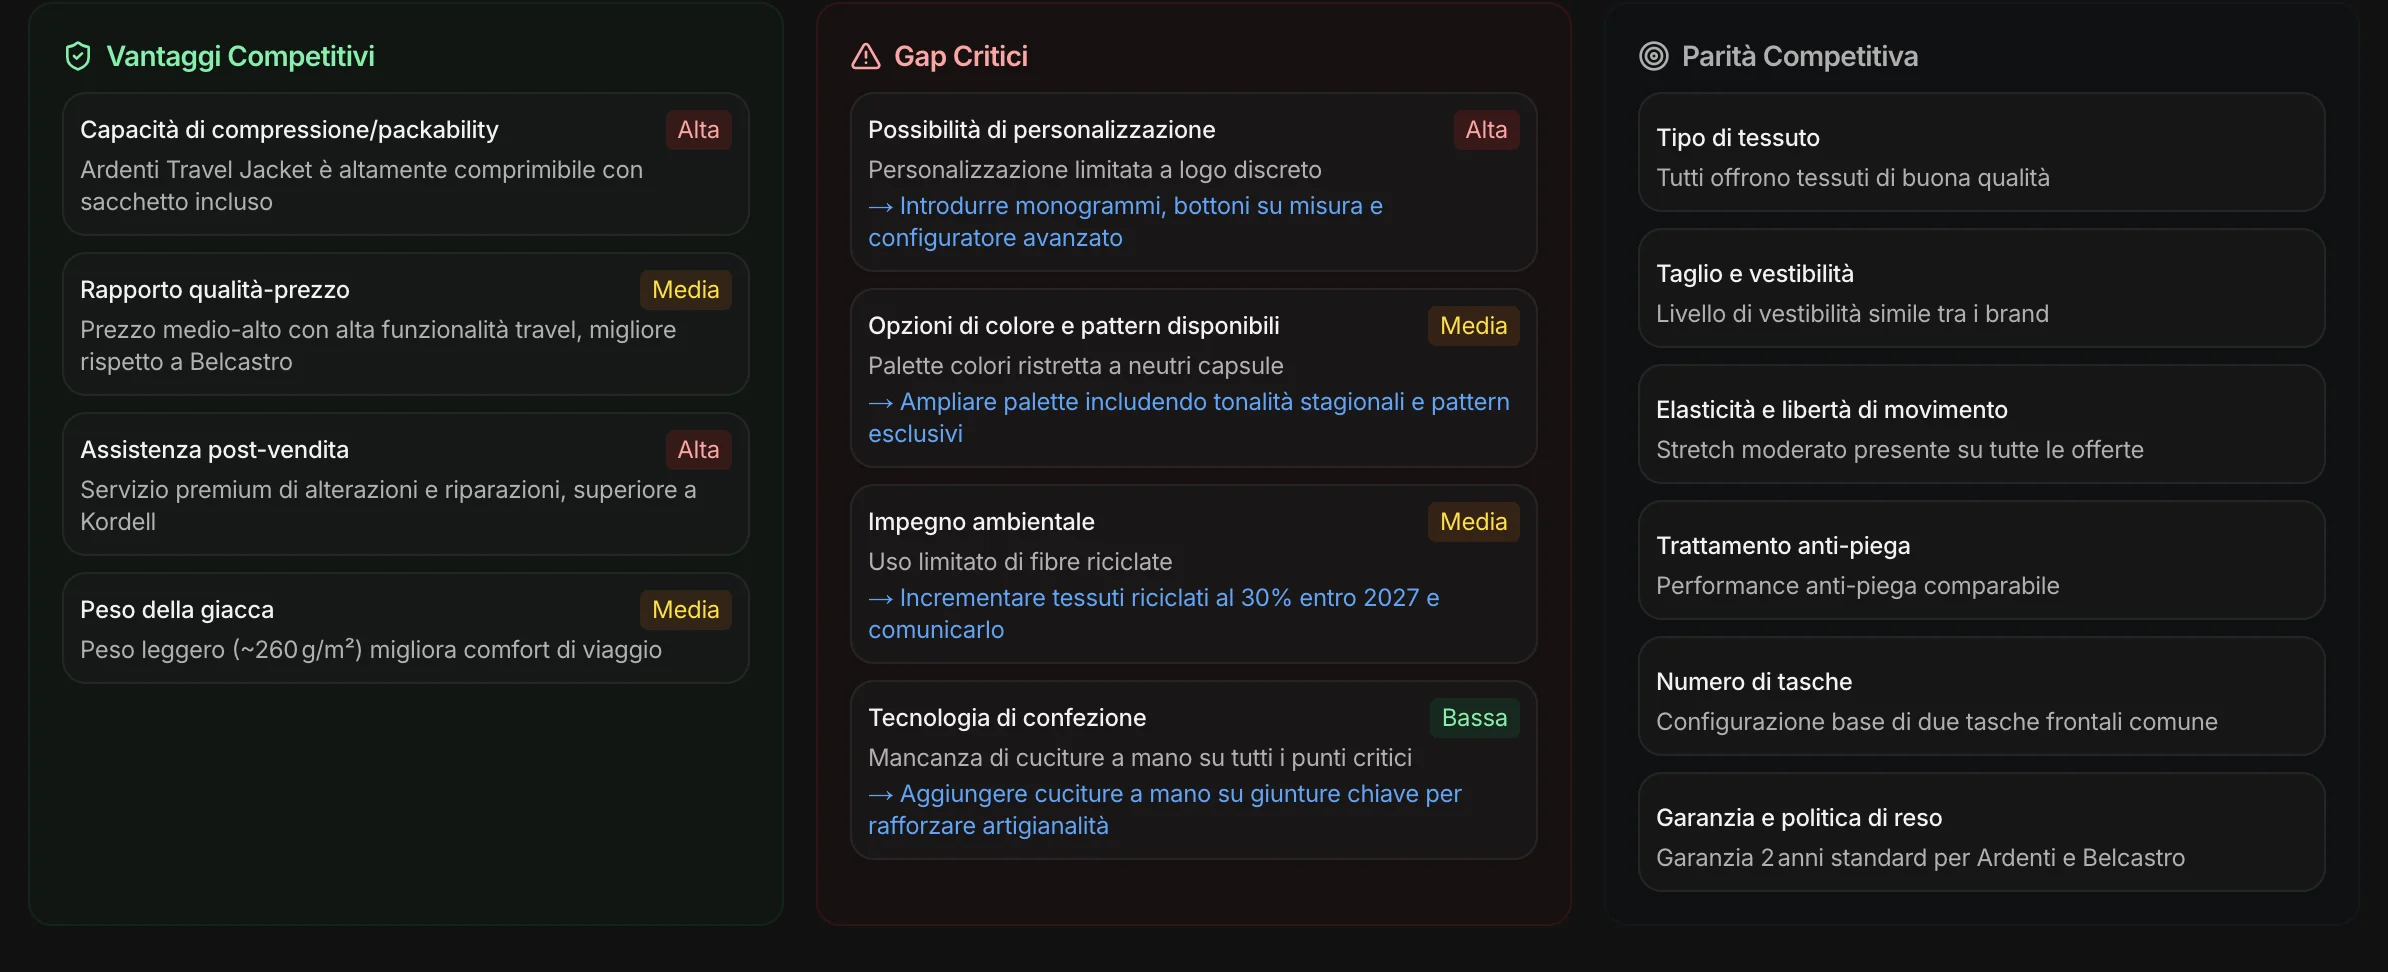
You choose the competitors and the features to compare — MAPS can suggest them, or search online for the ones competitors claim. Each feature gets a score from 1 to 5 for you and for each of them, with the reason. Out come the defensible advantages, the critical gaps with their severity, the features where you’re on par, and the priorities.
The right price,
and why.
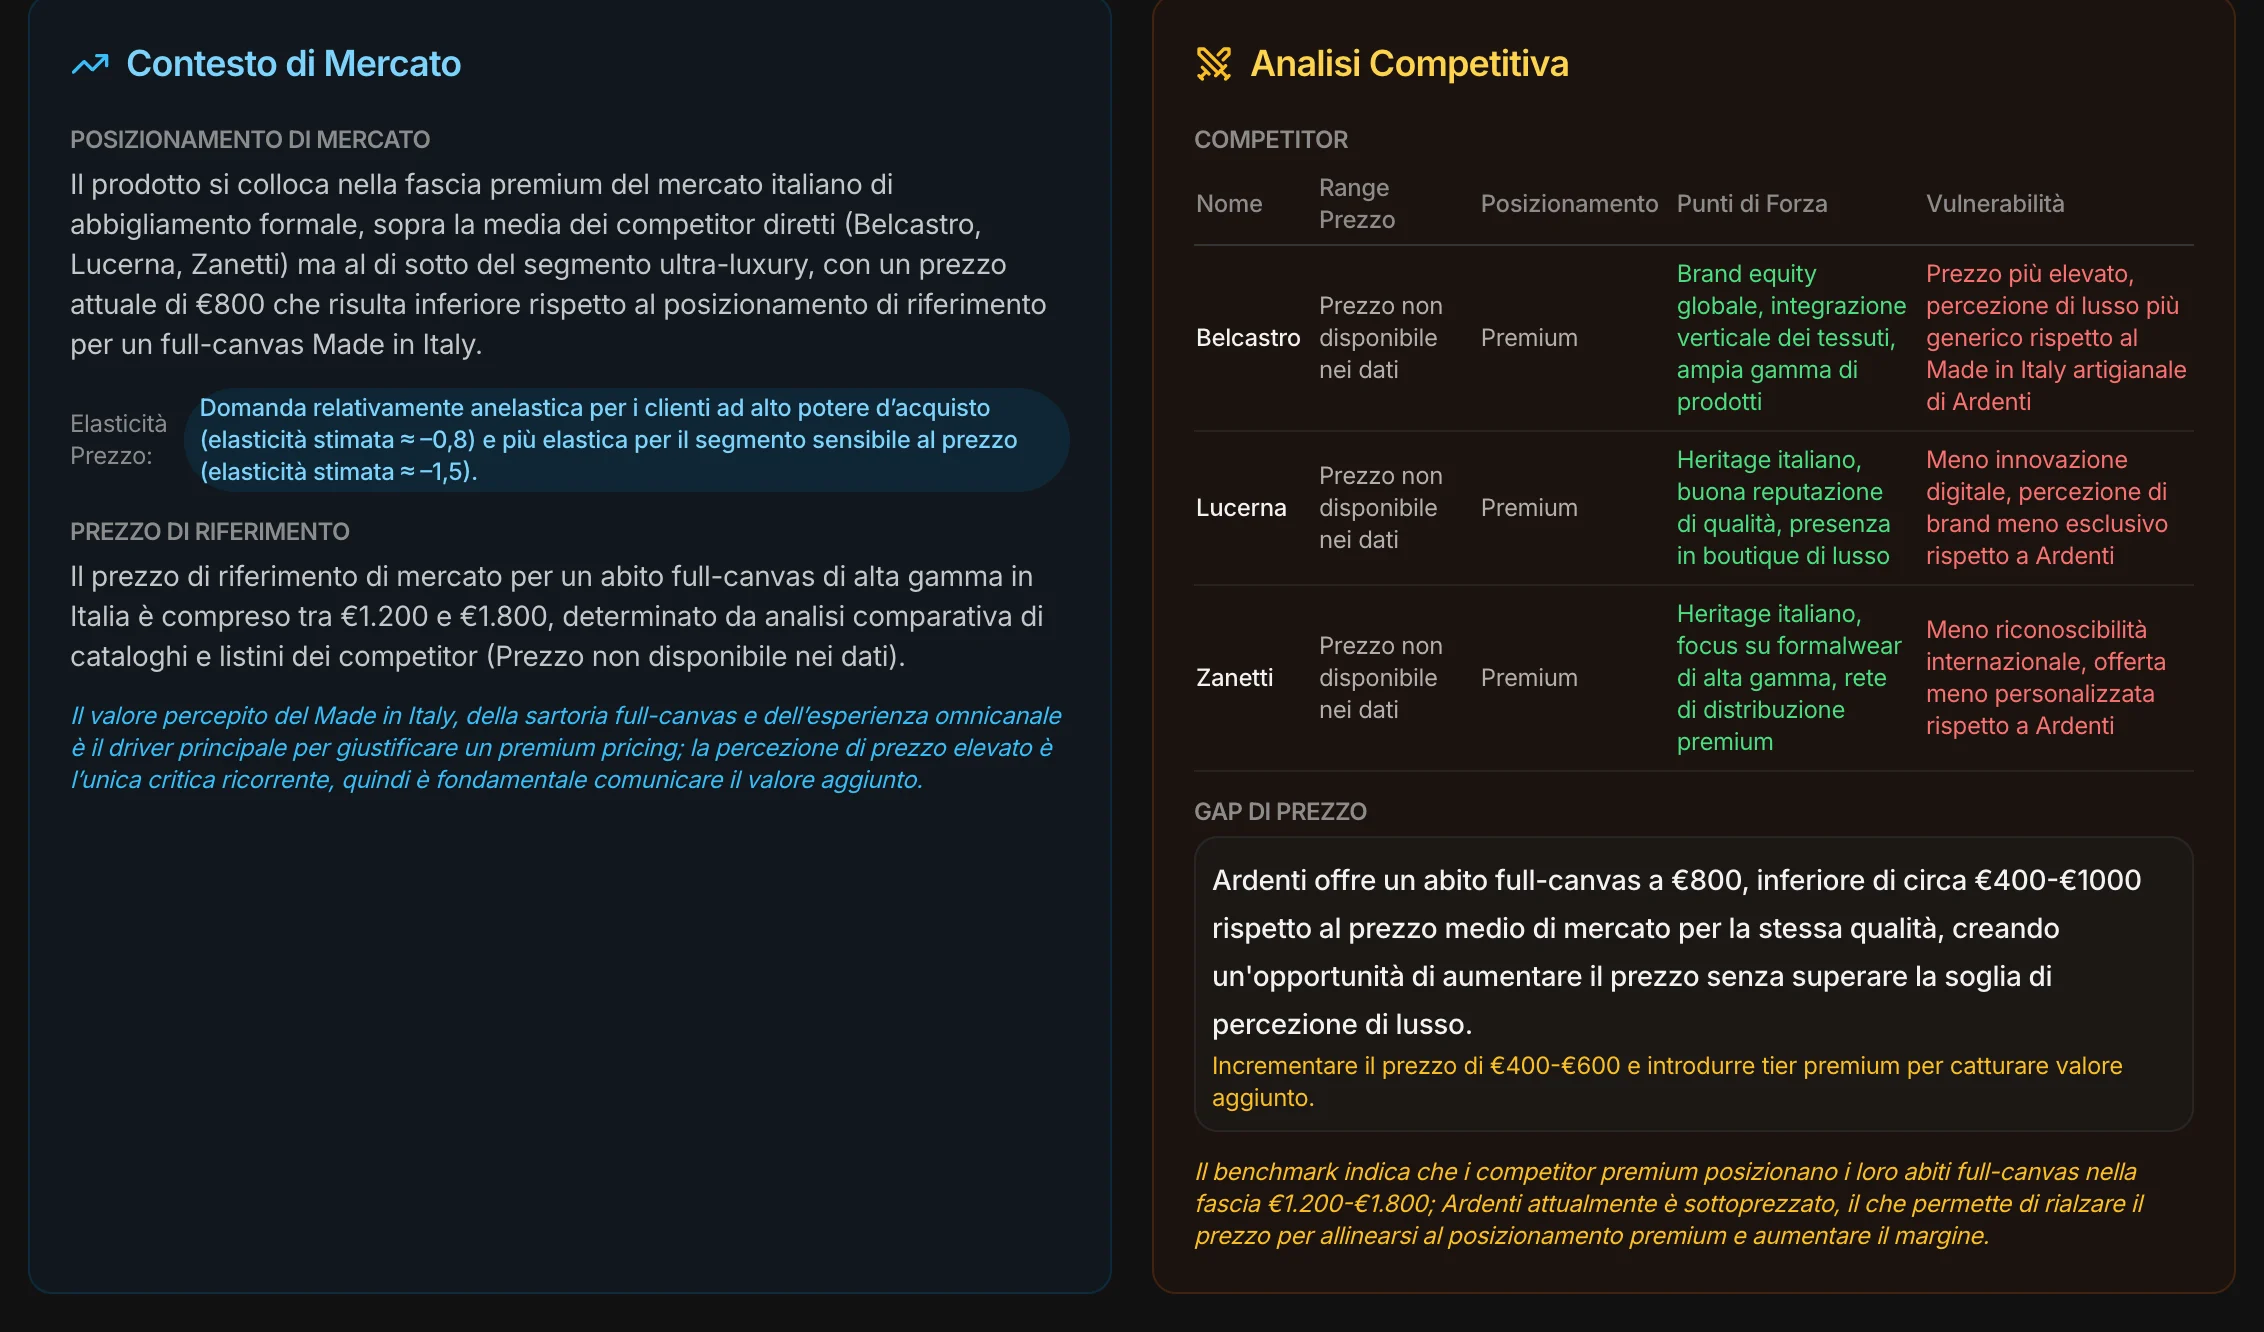
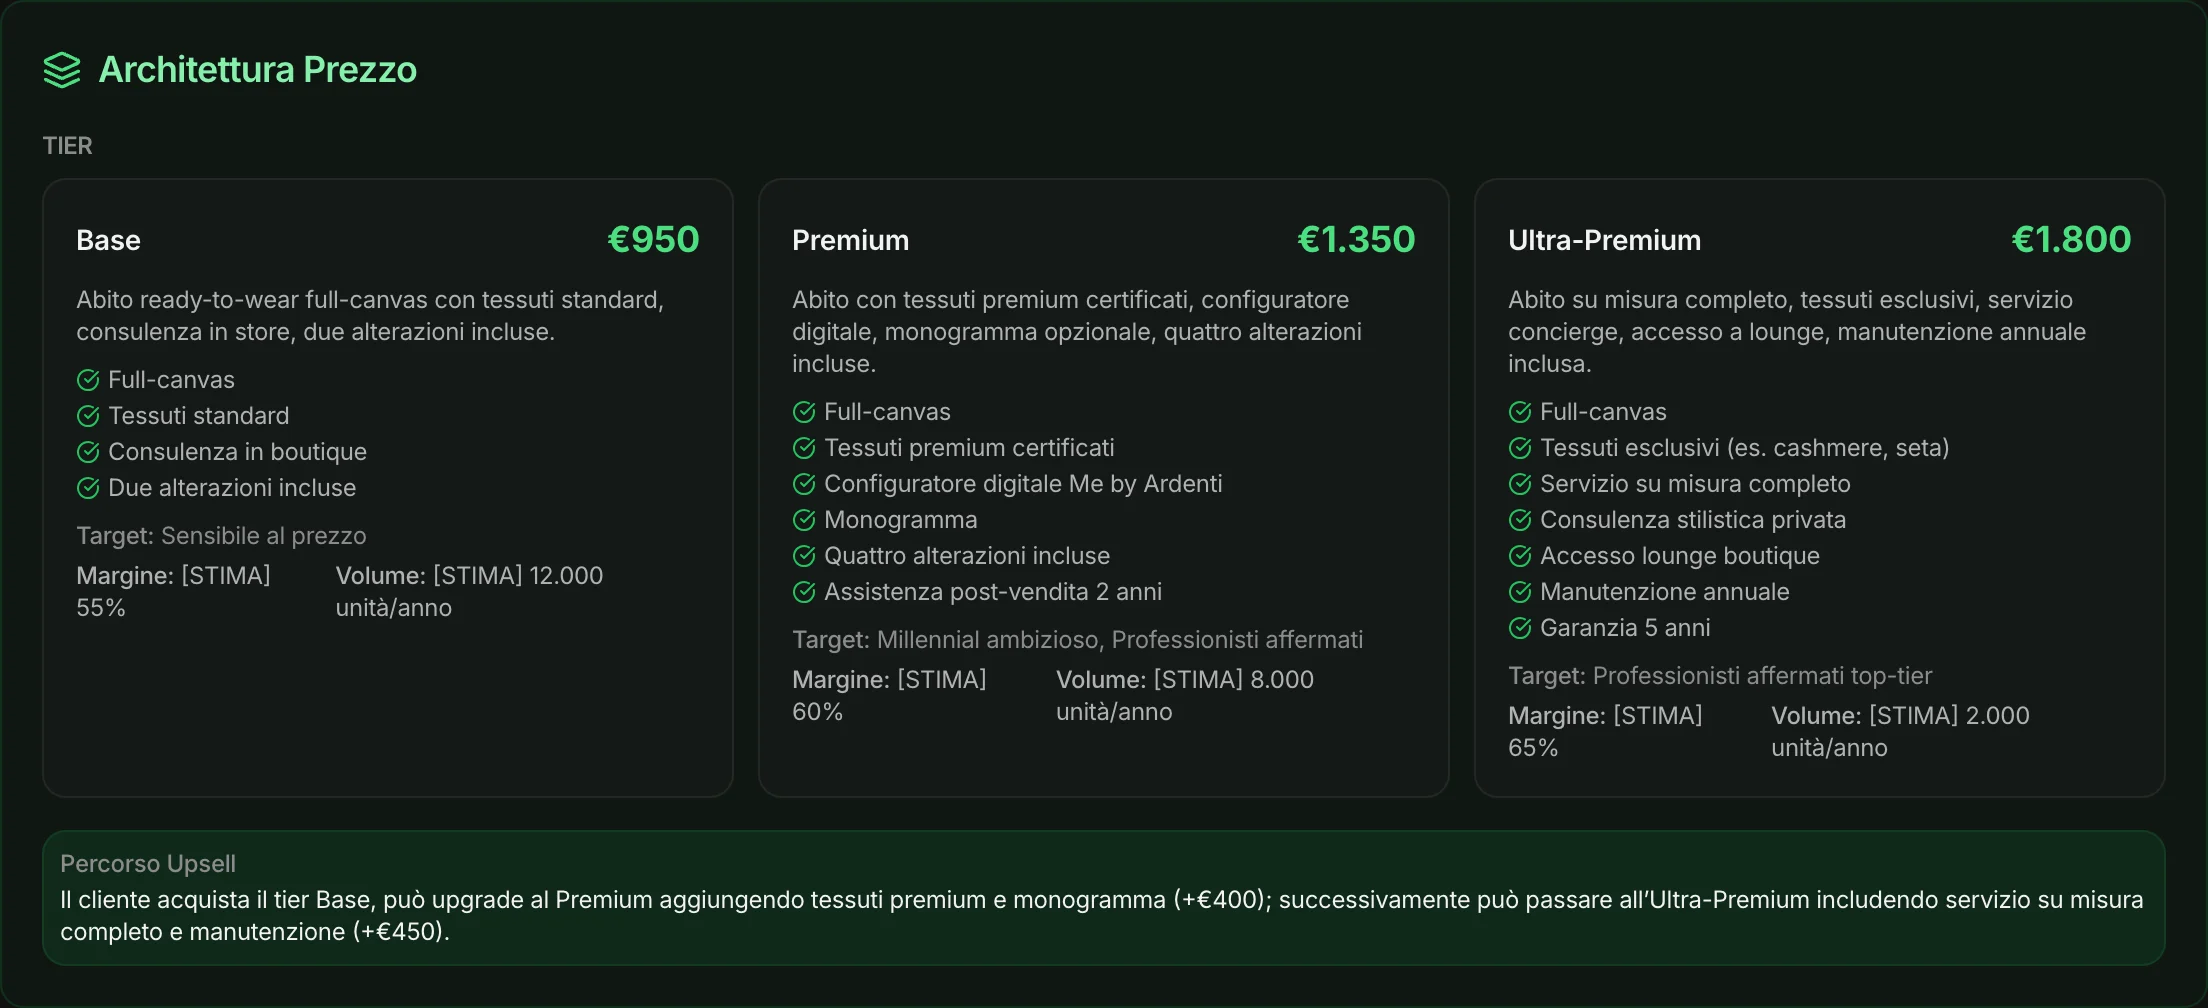
You state the goal — margin, penetration, premium positioning, competitiveness — and MAPS can search the market prices of competitors for you. Then it reads the concept and the feature matrix, and builds the strategy: where the price sits, how price-sensitive the market is, the offer tiers with their margins, the launch, the promotions, the break-even point, and what to do if a competitor responds.

The launch, in phases.
With the green light to move on to the next one.
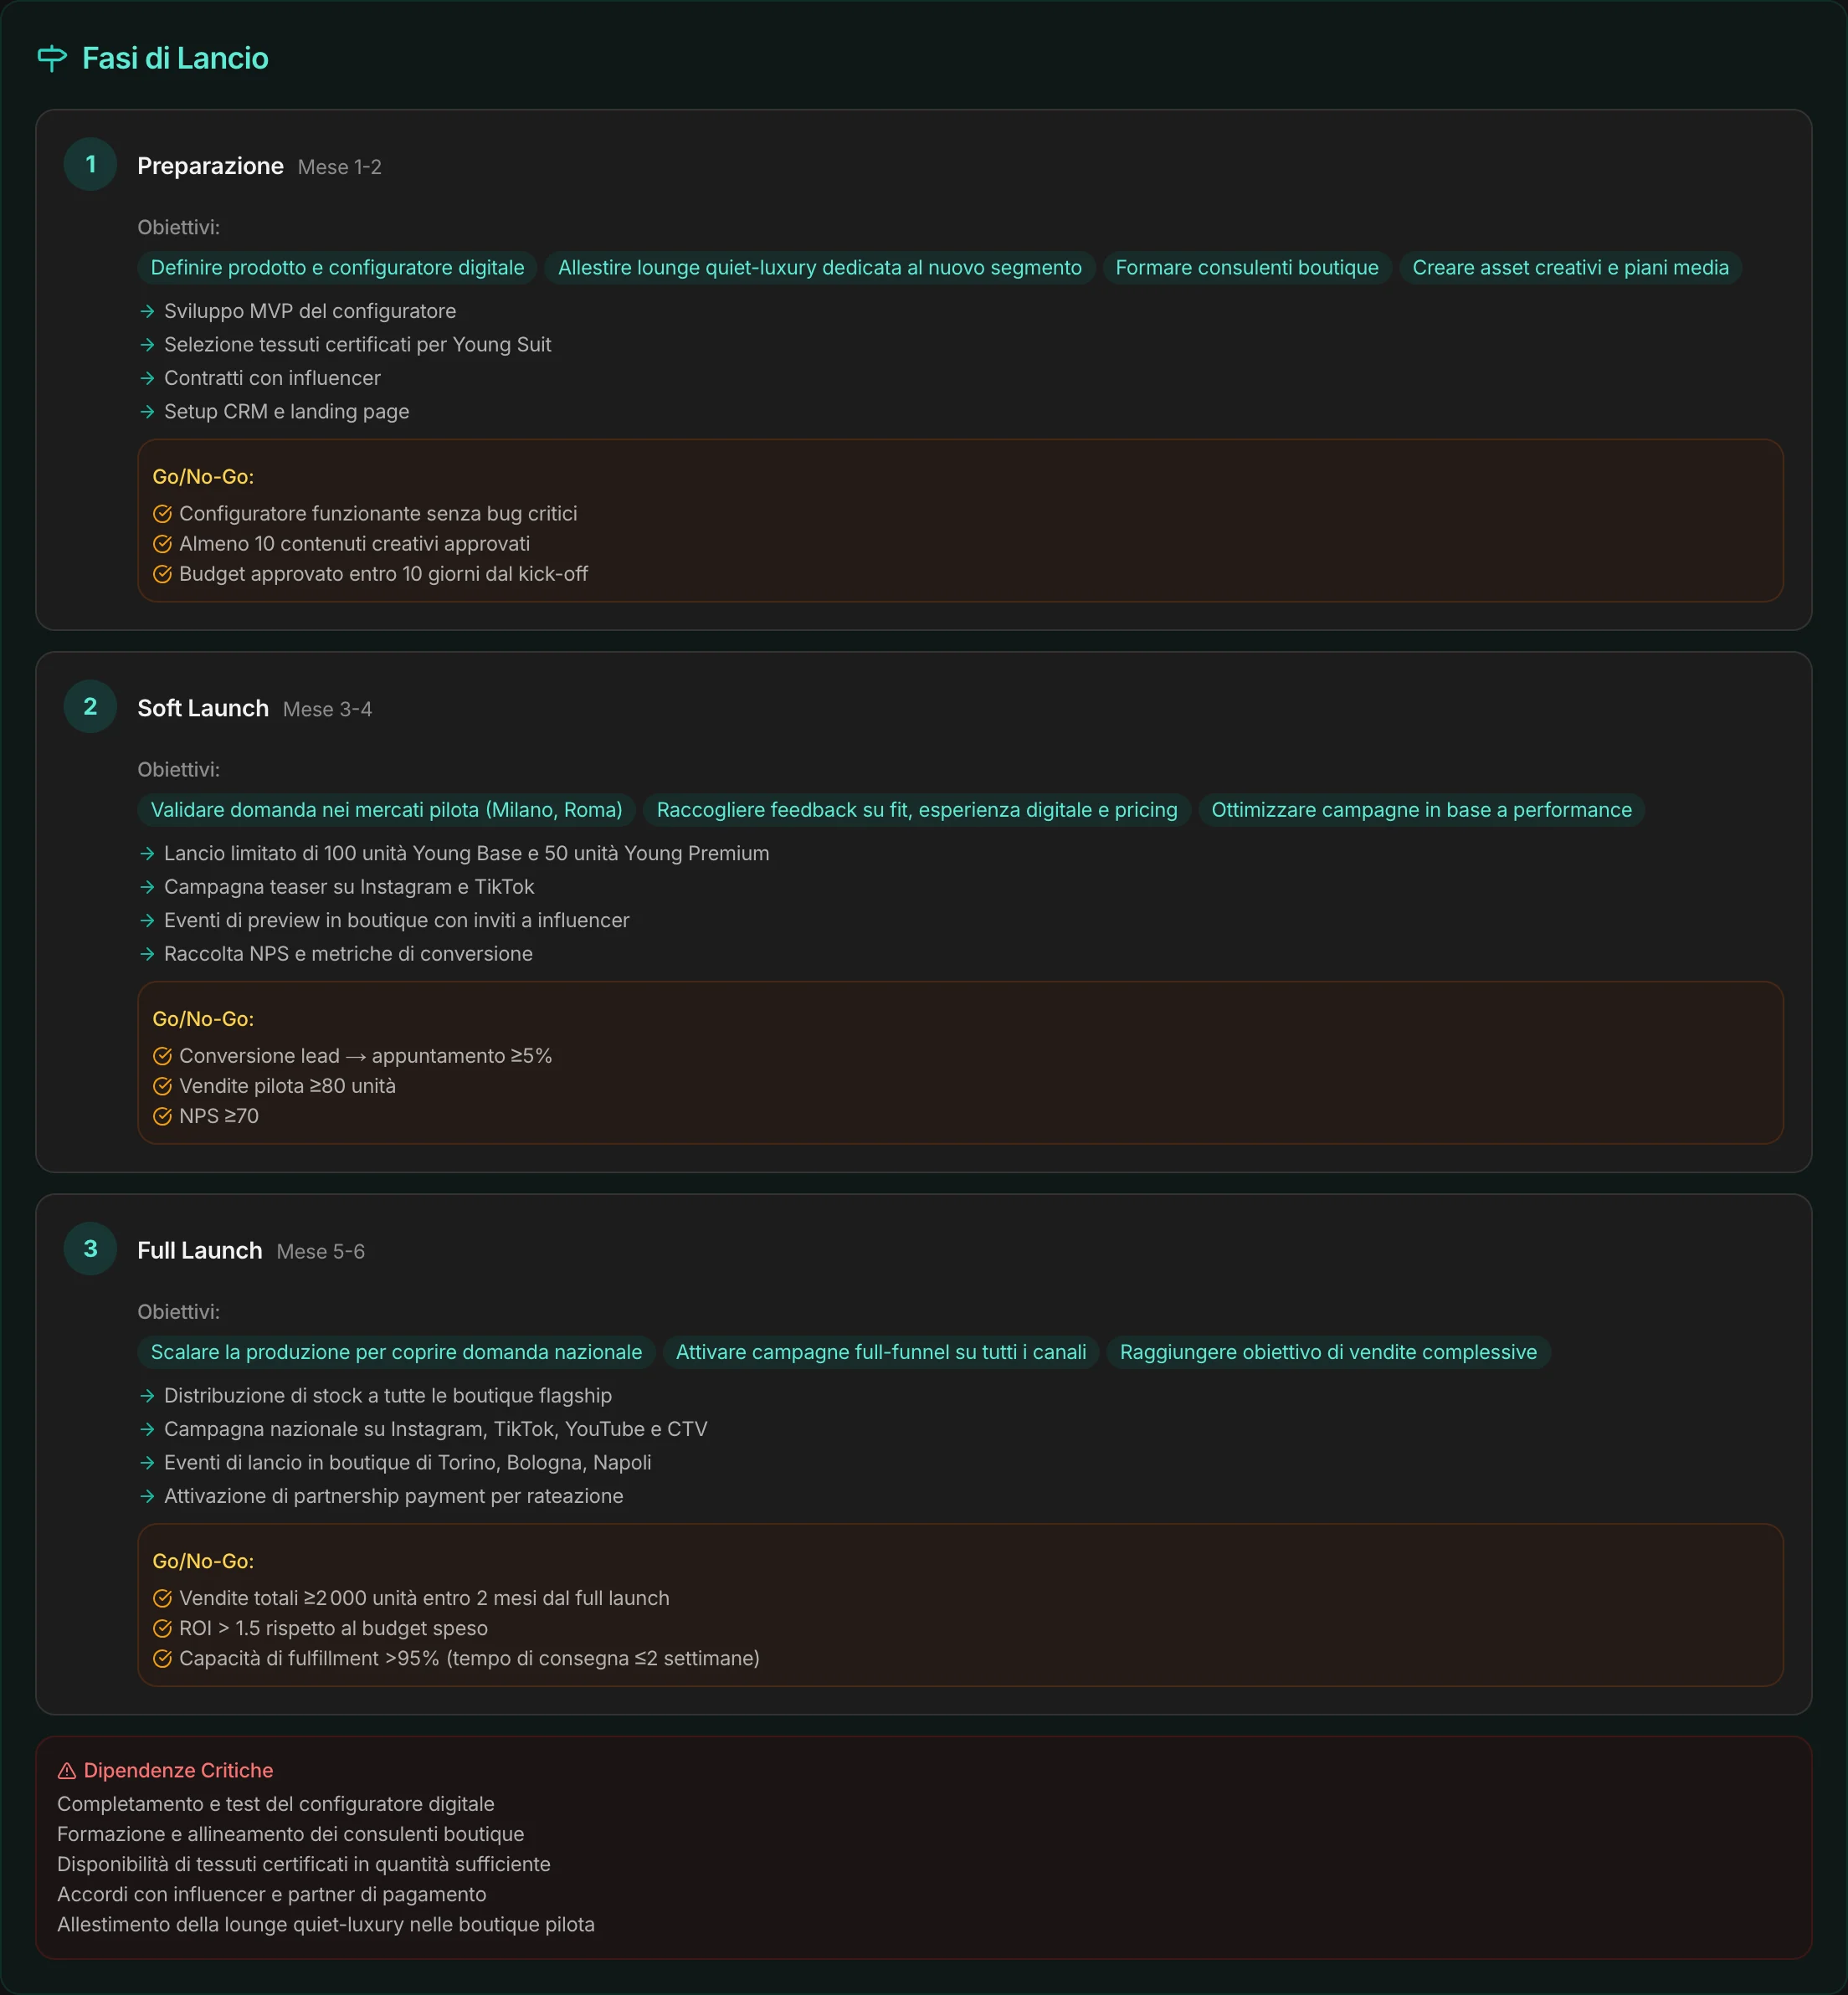
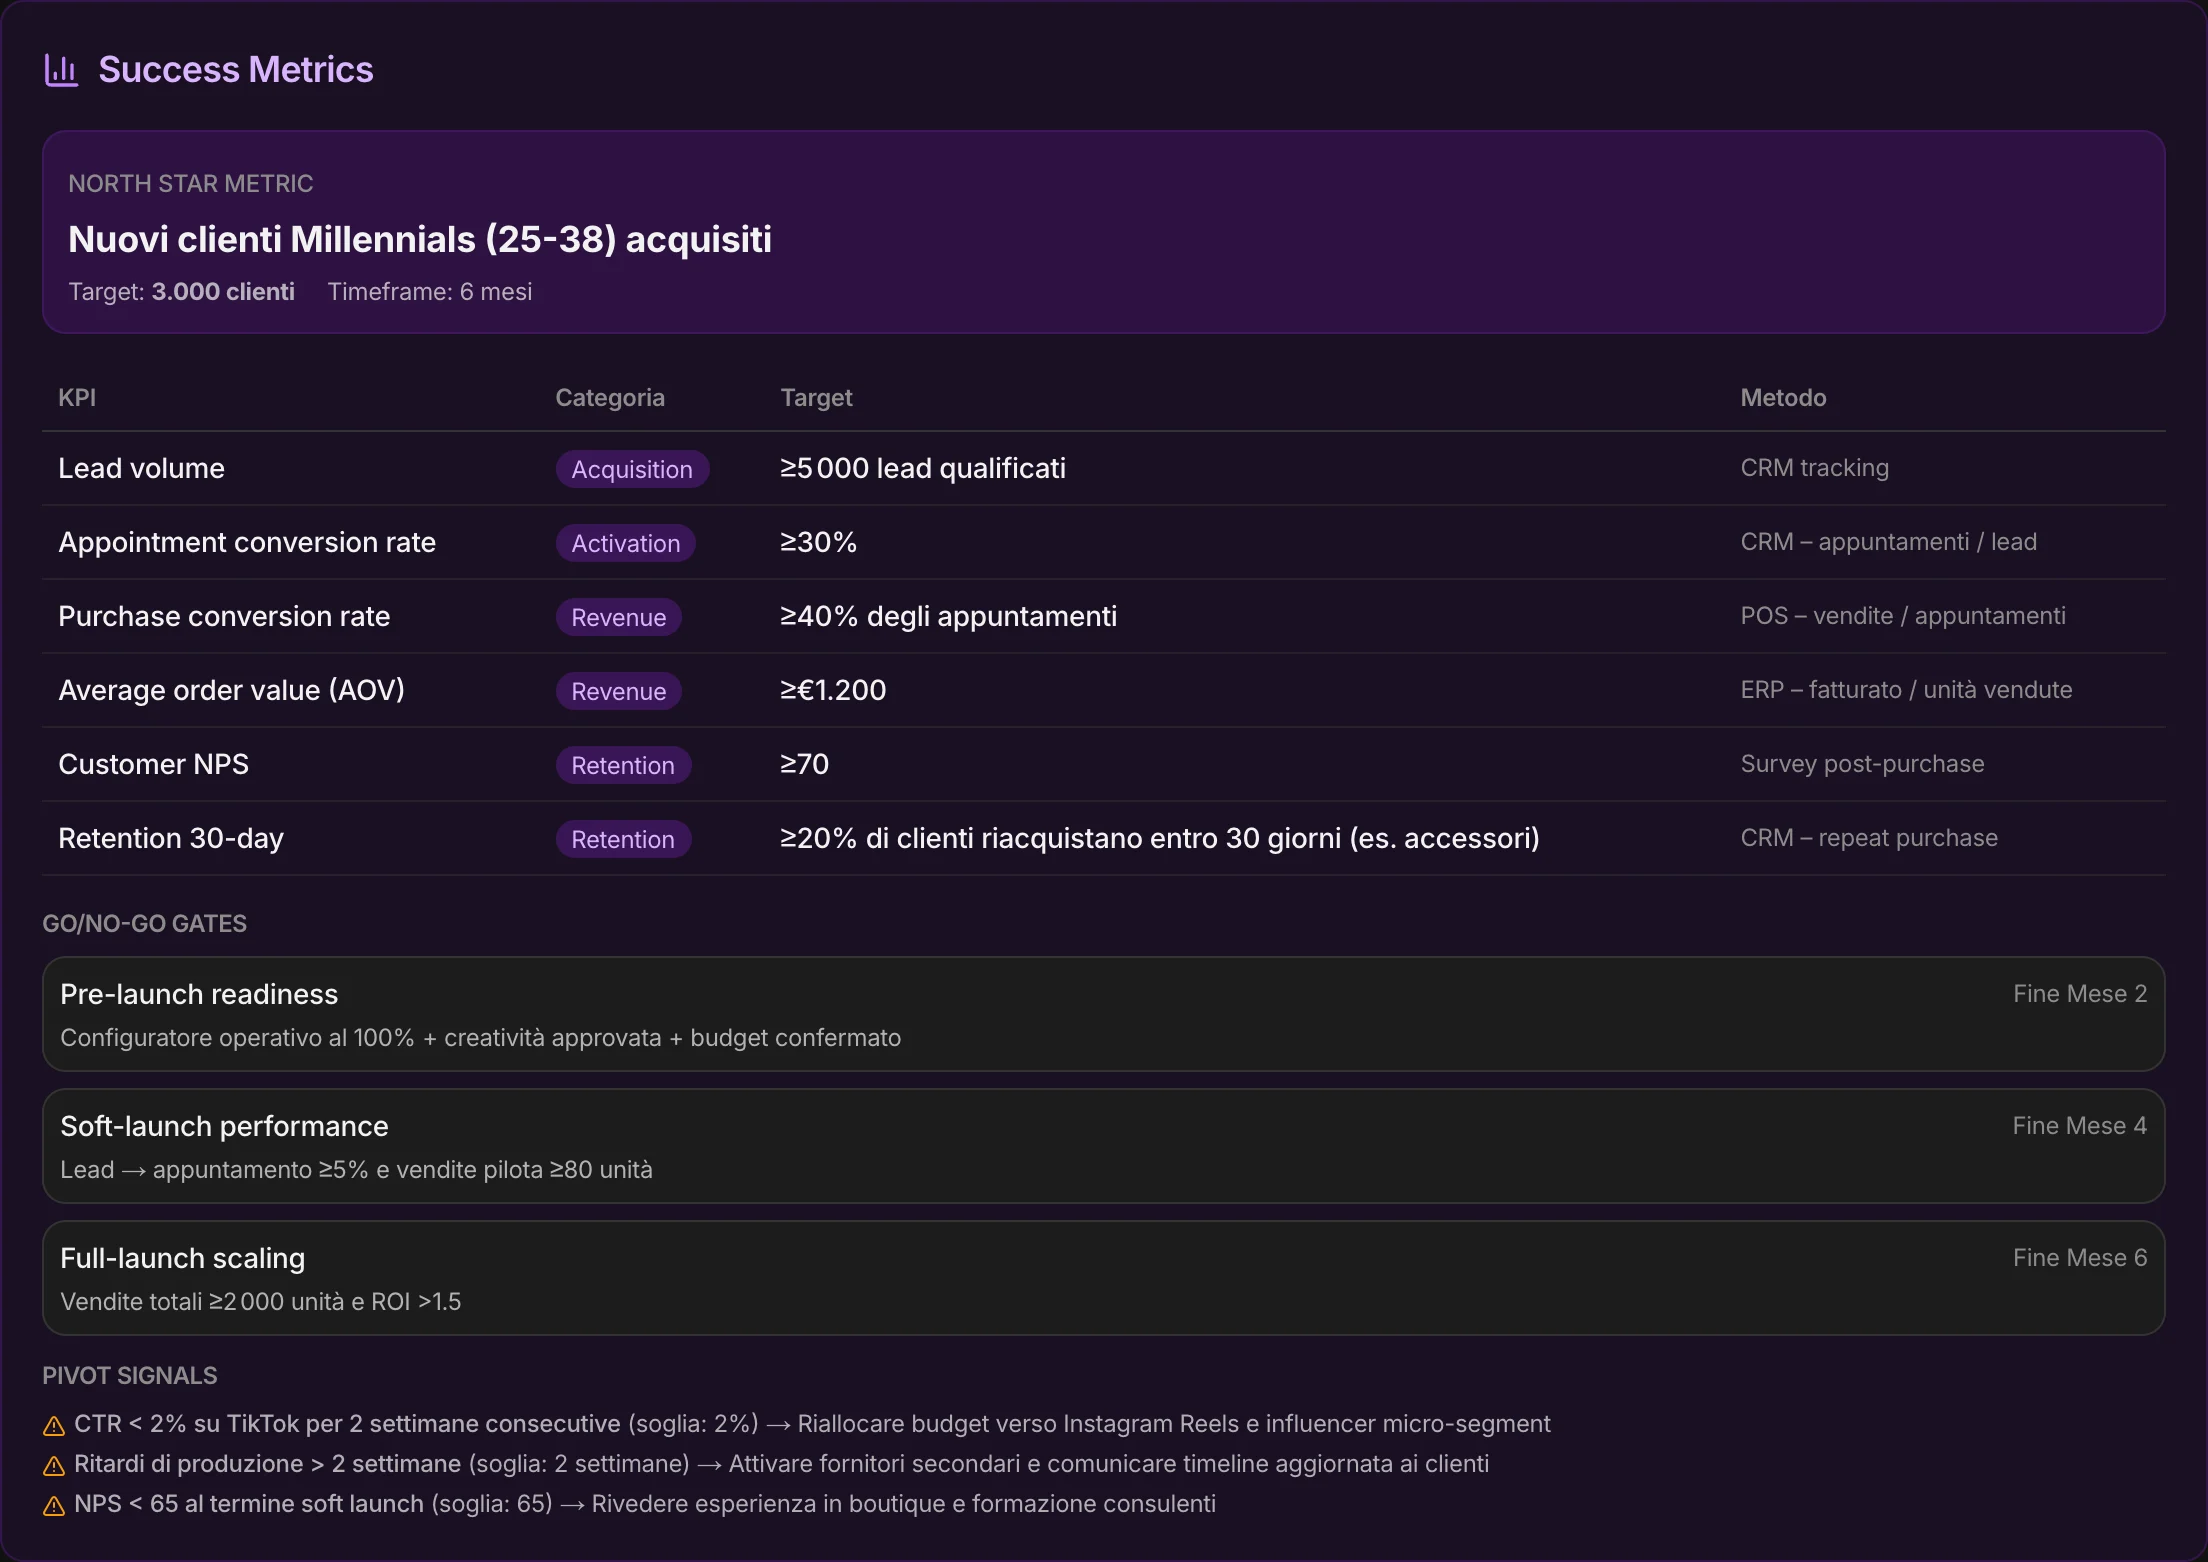
What kind of launch it is — a new product, a new market, a relaunch —, how it’s sold, over how many months, with what budget. MAPS builds the first segment to win, the ideal customer, market entry, demand generation, sales. And the phases: preparation, pilot launch, scale — each with its go/no-go criteria, the numbers to hit before moving forward.
The four Ps,
and whether they get along.
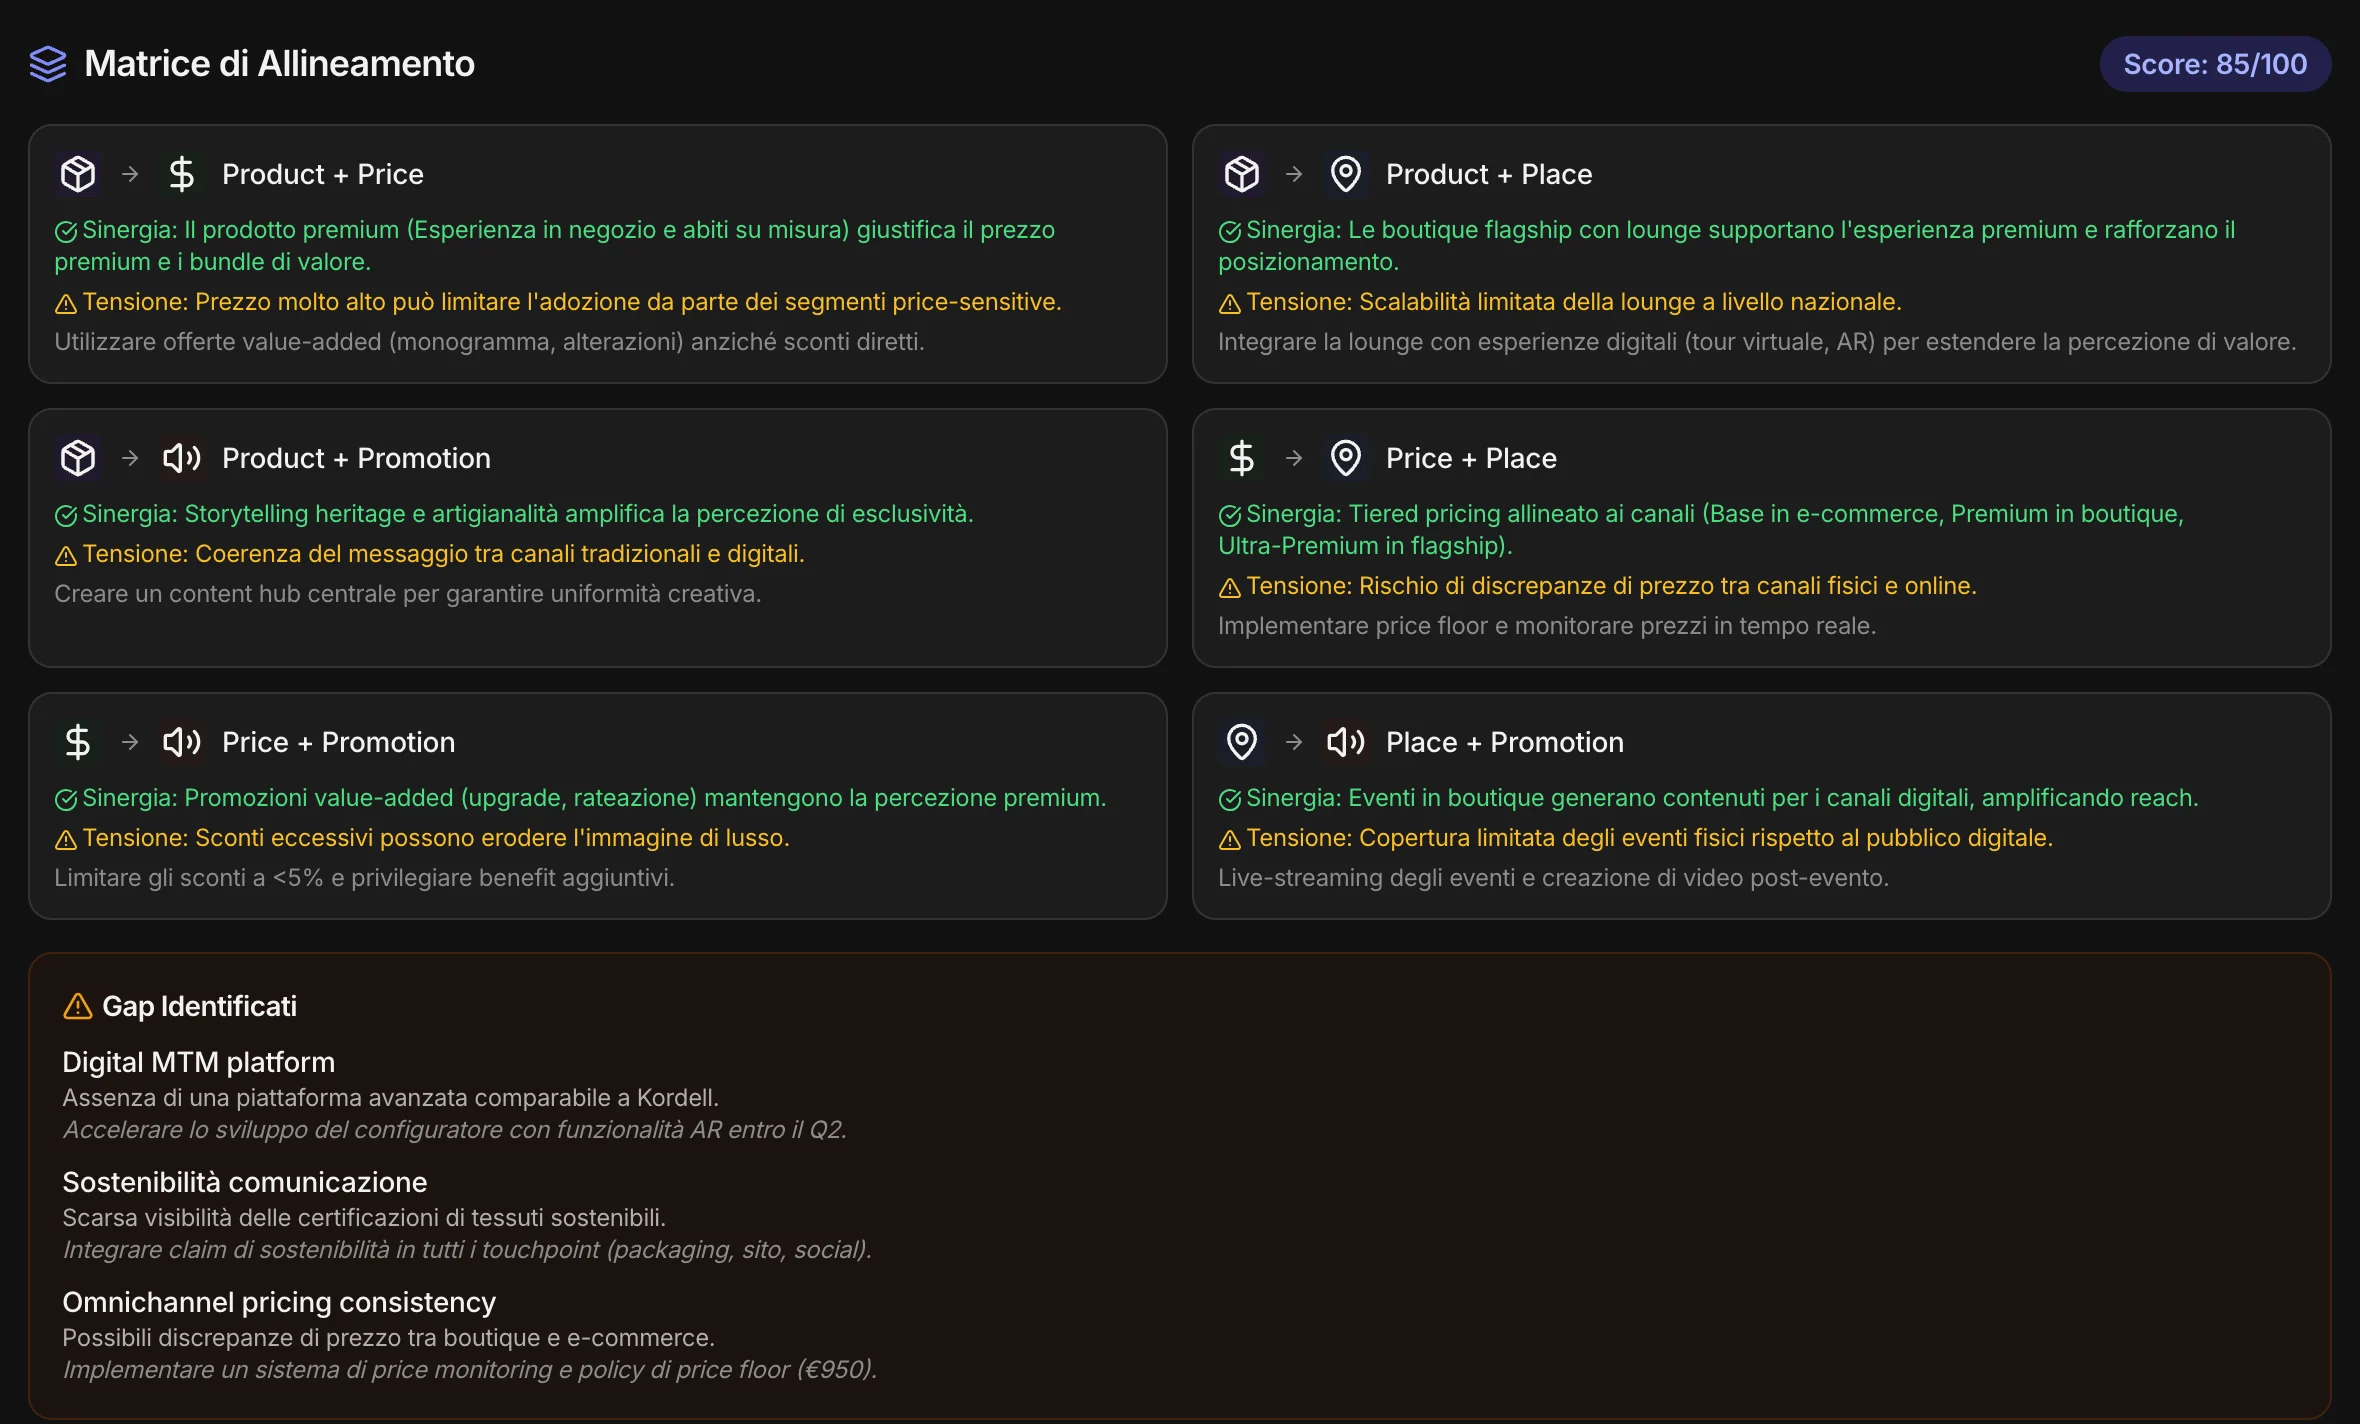
Product, price, place, promotion — each with its recommendations, and promotion with the media mix and the calendar. Then the alignment matrix: for every pair of Ps, where they reinforce each other and where they contradict each other, with a consistency score and the gaps to close.
The campaign,
ready to produce.
Campaign type, goal, audience, channels, duration, budget. MAPS reads the whole path upstream and writes the plan: the audience, the message — and how it changes on each channel —, the channel plan with budget and KPIs, the creative brief, the timeline, the budget, the risks.
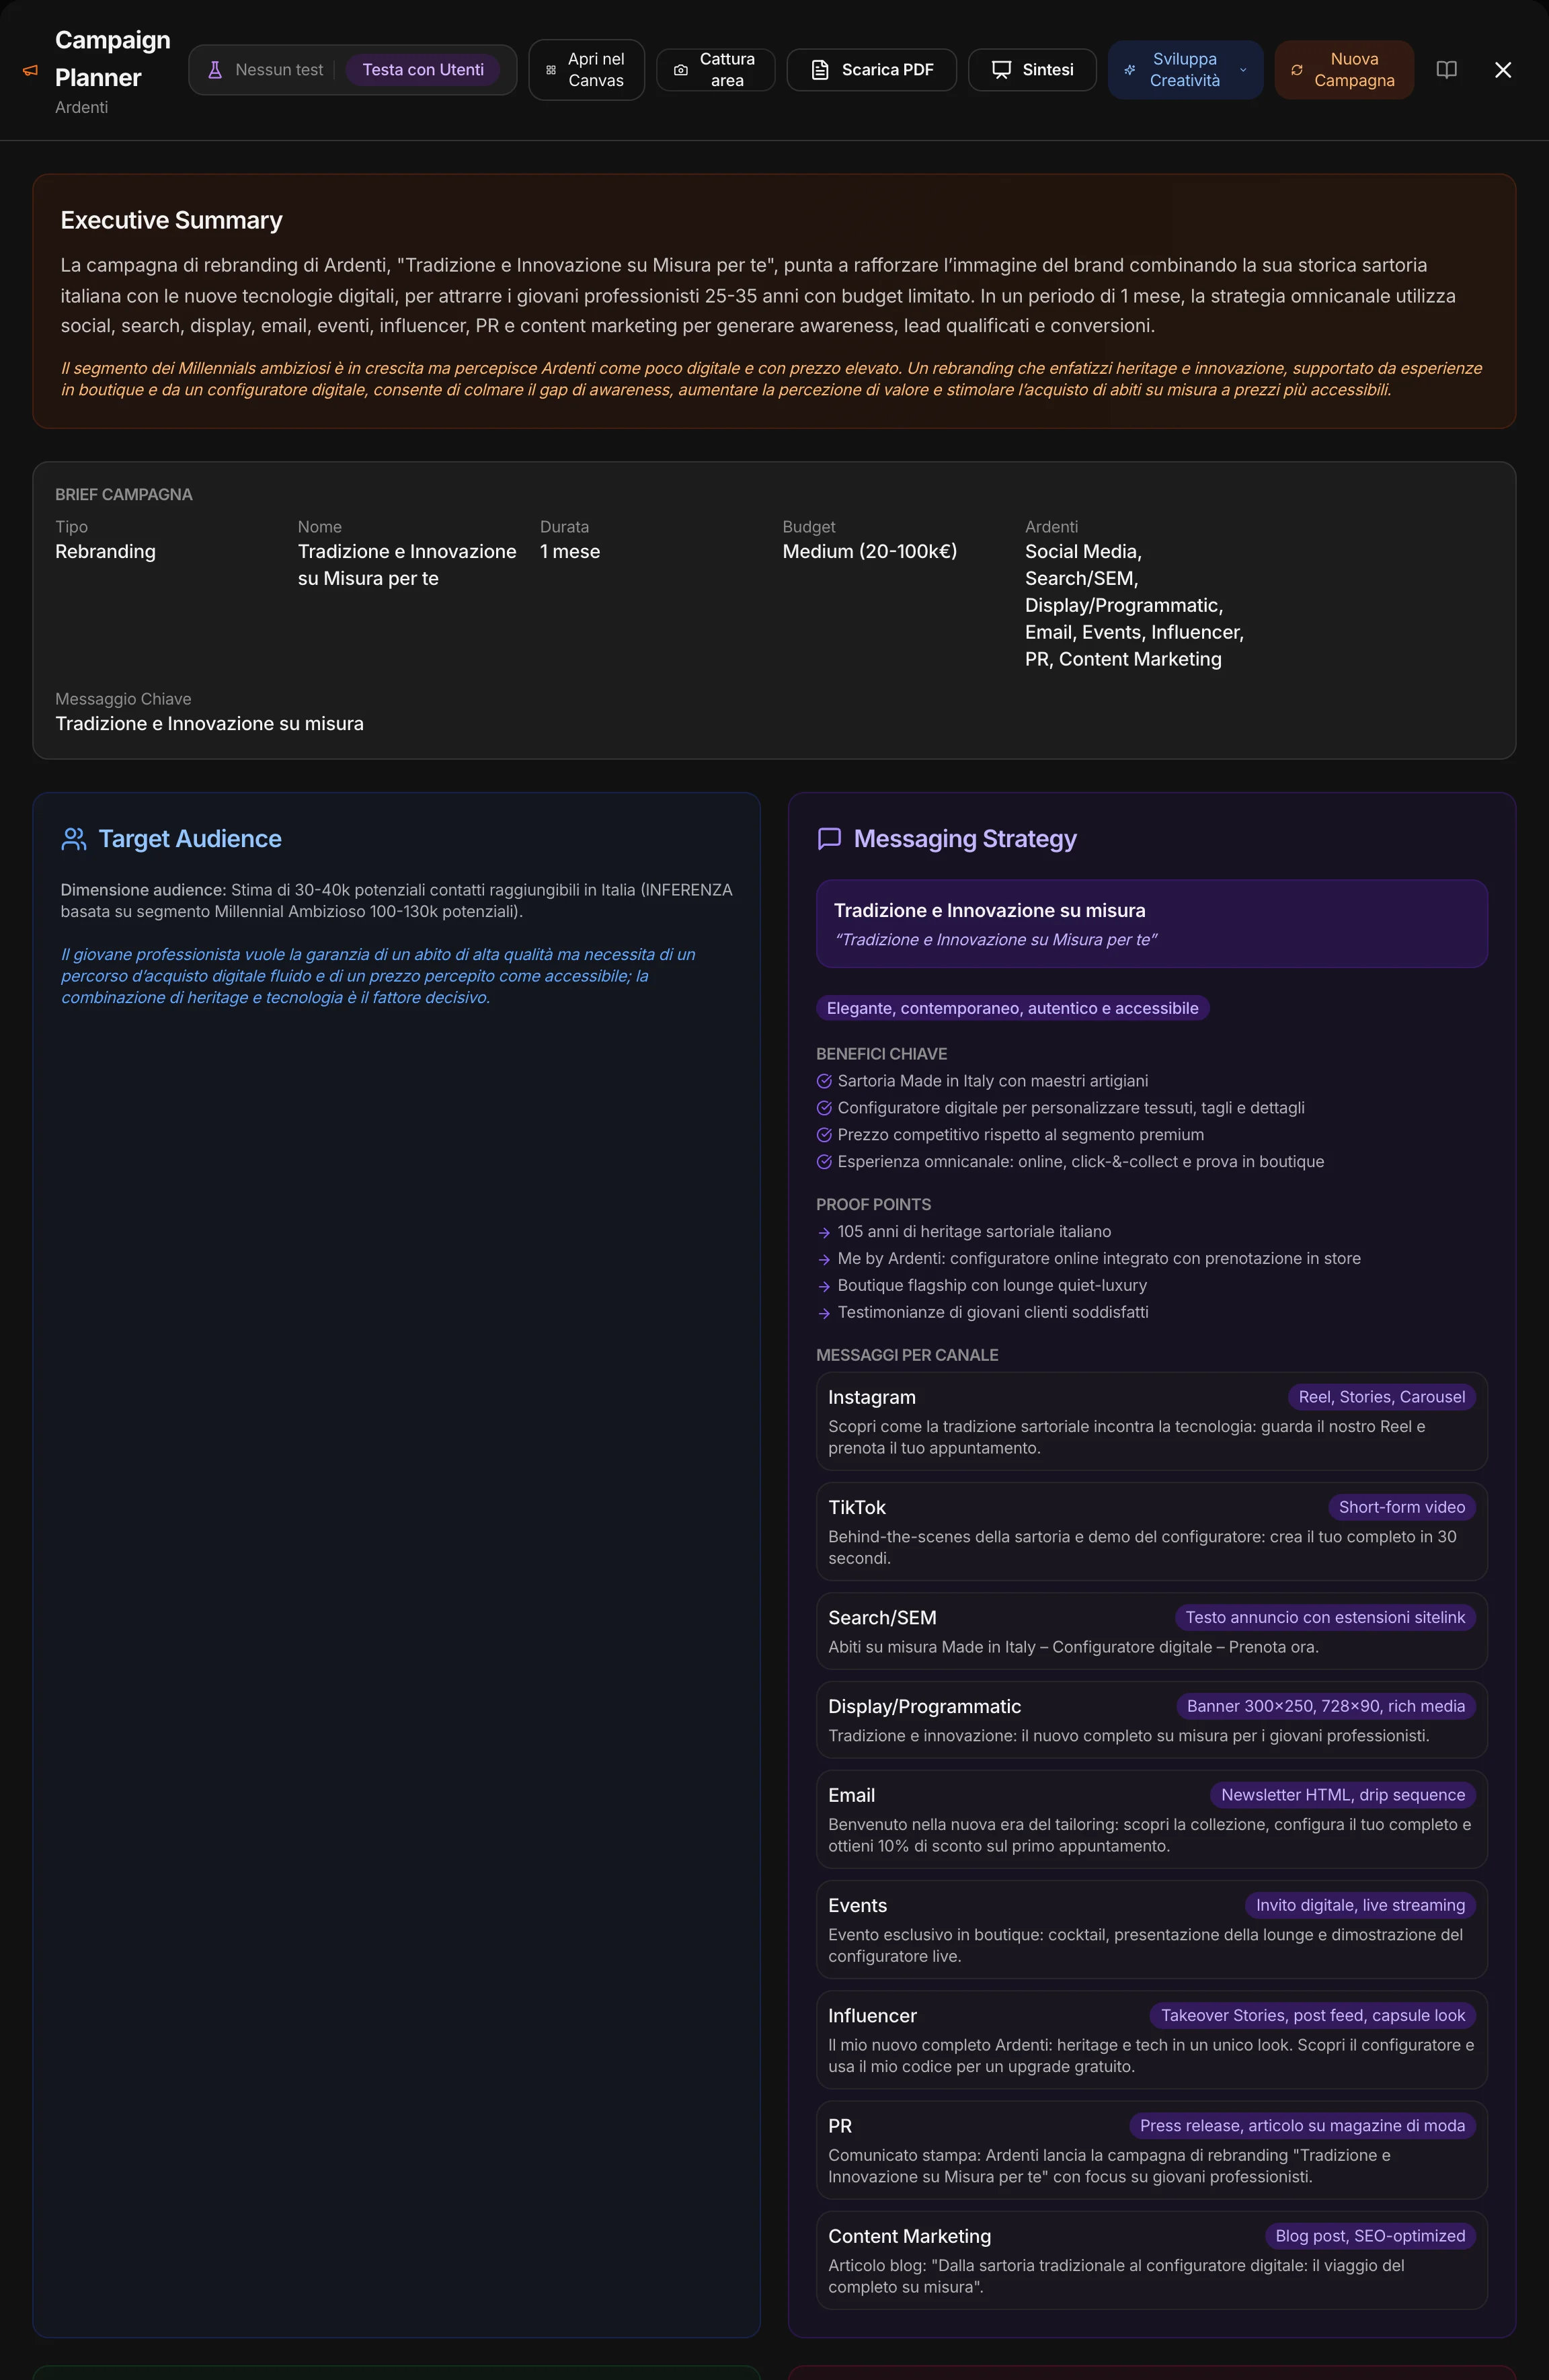
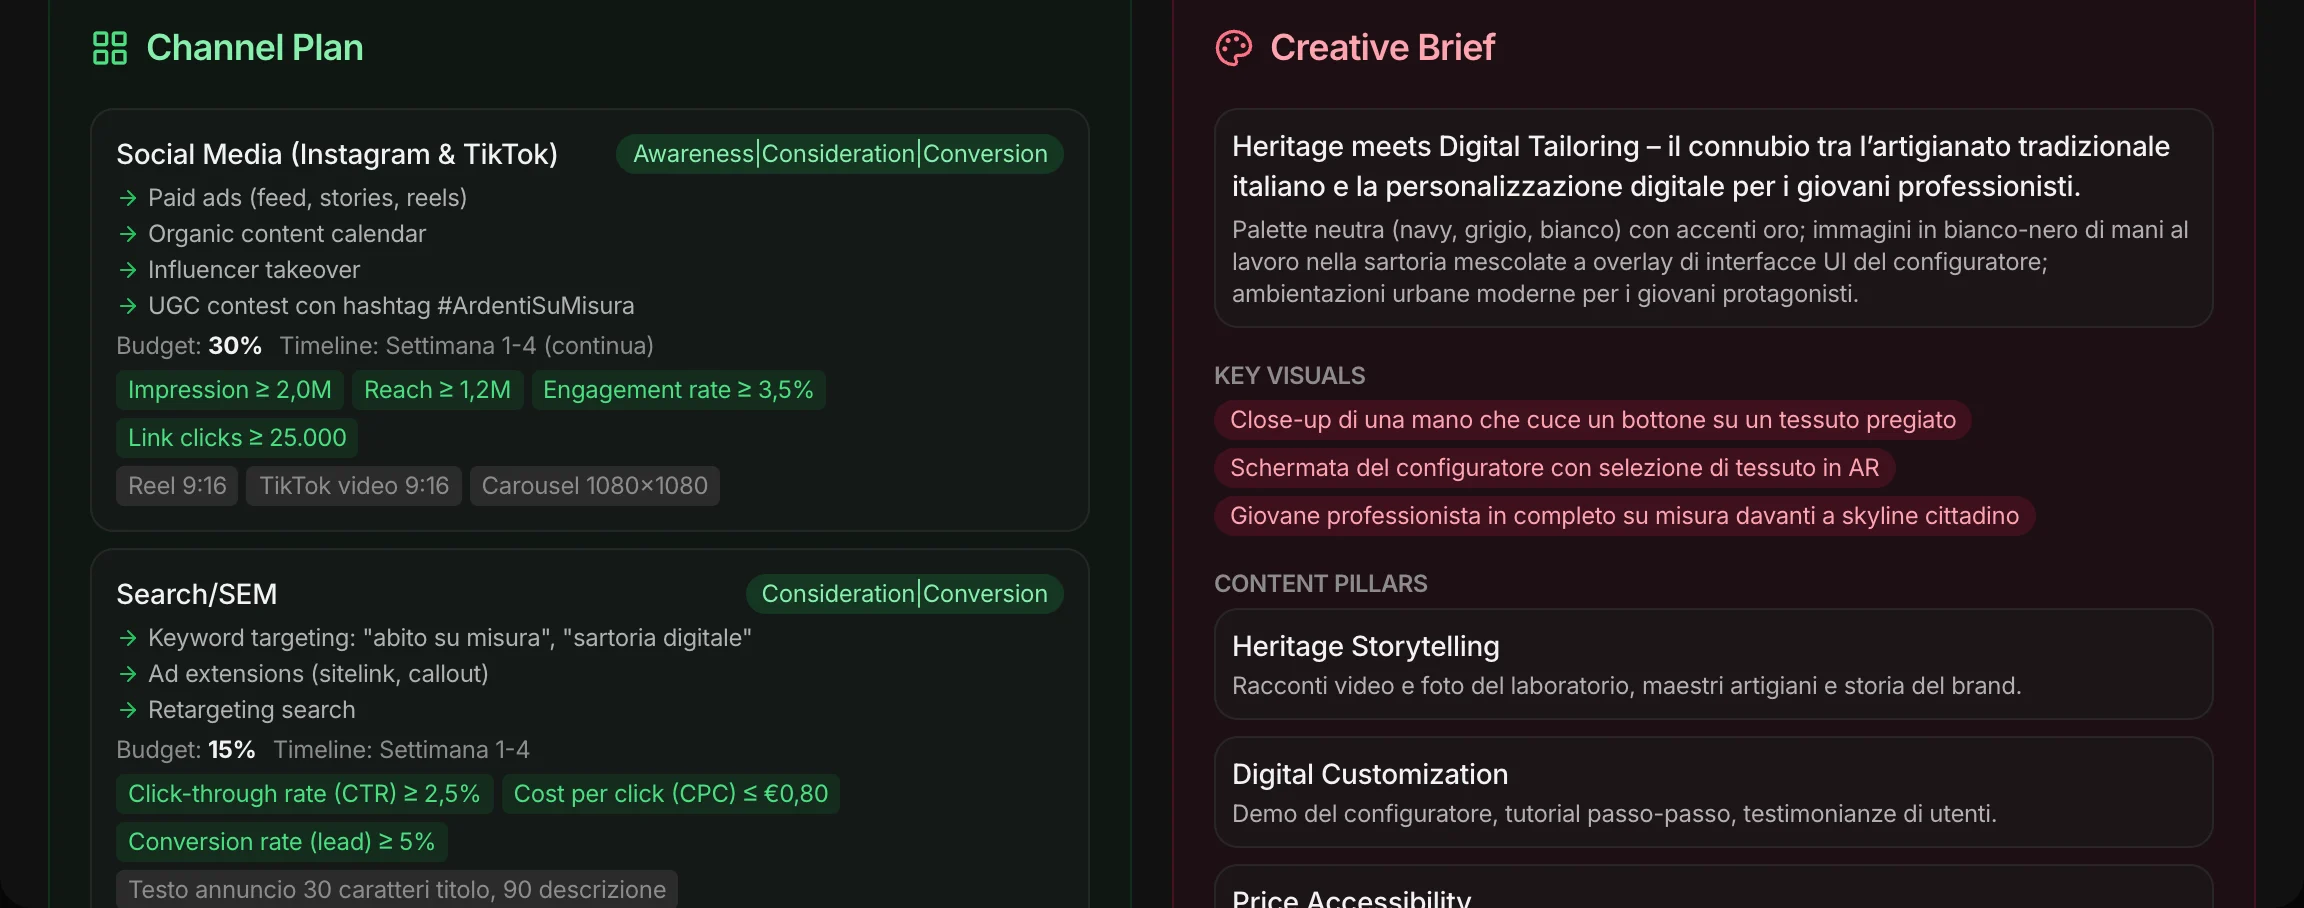
“Develop Creative”
From the campaign plan, one click takes the brief into Campaign Lab: you pick one of the eight creative methods — archetypes, benefit laddering, cultural tensions, jobs to be done, semiotics, insights, ideas from other industries, scenarios — and MAPS generates the concepts.
Change an assumption.
See where it leads.
New versions
A different price, a different audience, a different channel: every generation is a version, and the earlier ones stay.
More products
Several concepts in the same project, each with its own path.
Tested with people
Every tool can be tested with synthetic users, and the tests stay in the history.
B2B and startups too
In B2B the customer is a company and the price is a price list; for a startup, the product is an MVP and the launch starts from the first customers.