
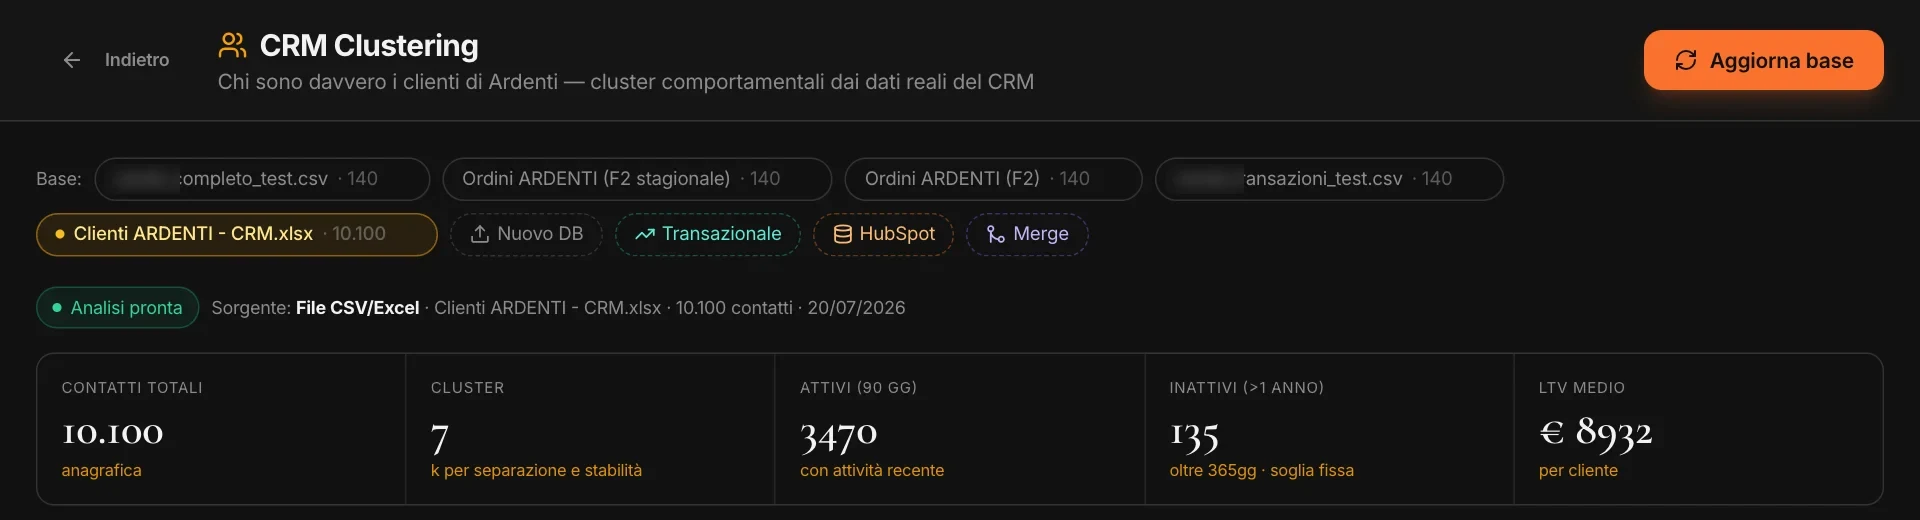
From a file,
or straight from HubSpot.
Four routes, and you can use them all: each database stays separate, and you compare them.
New DB
An export from any CRM, CSV or Excel, up to 100,000 contacts. The AI proposes what each column corresponds to — looking only at samples with emails, phone numbers and names masked — and you confirm.
Transactional
The orders file, one row per purchase. MAPS rebuilds each customer’s profile and unlocks questions about purchases: who bought what, together with what, when.
HubSpot
Connect your portal in one click. MAPS reads deals, orders or contacts, categories from products, companies in B2B — in the background, even for large databases.
Merge
Combines several databases into a single customer view: people who appear in more than one channel are recognized, value and purchases add up. Omnichannel customers stand out at a glance.
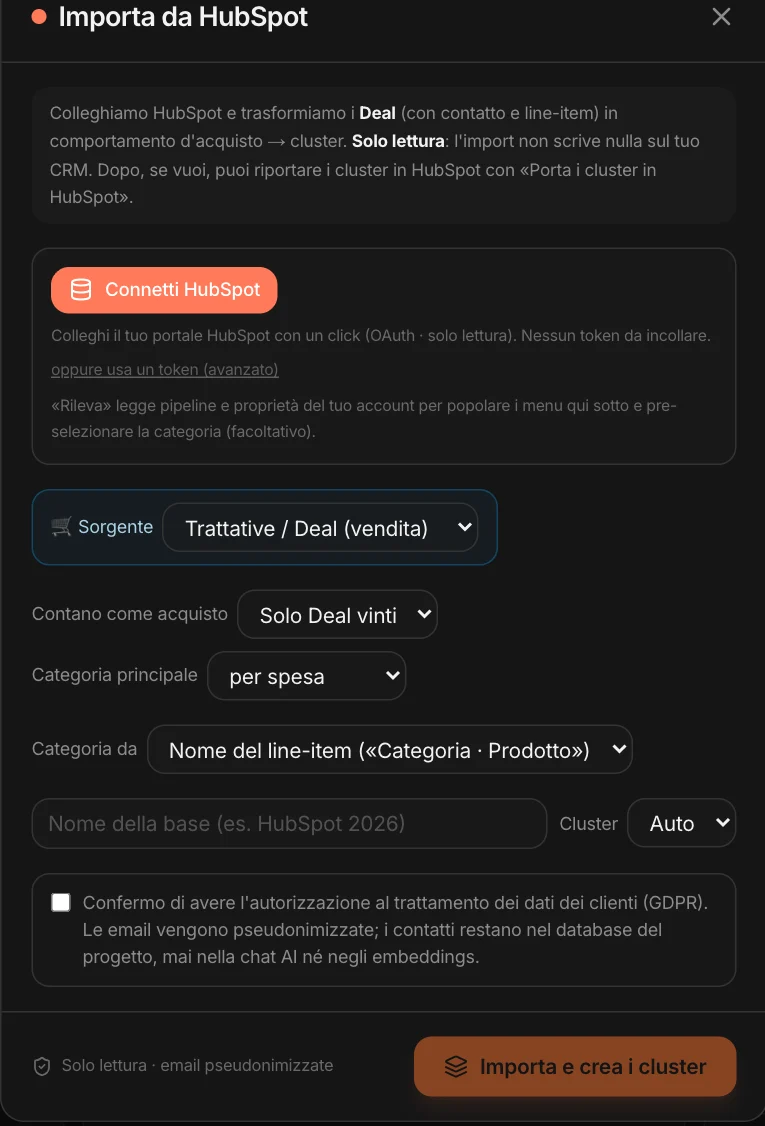
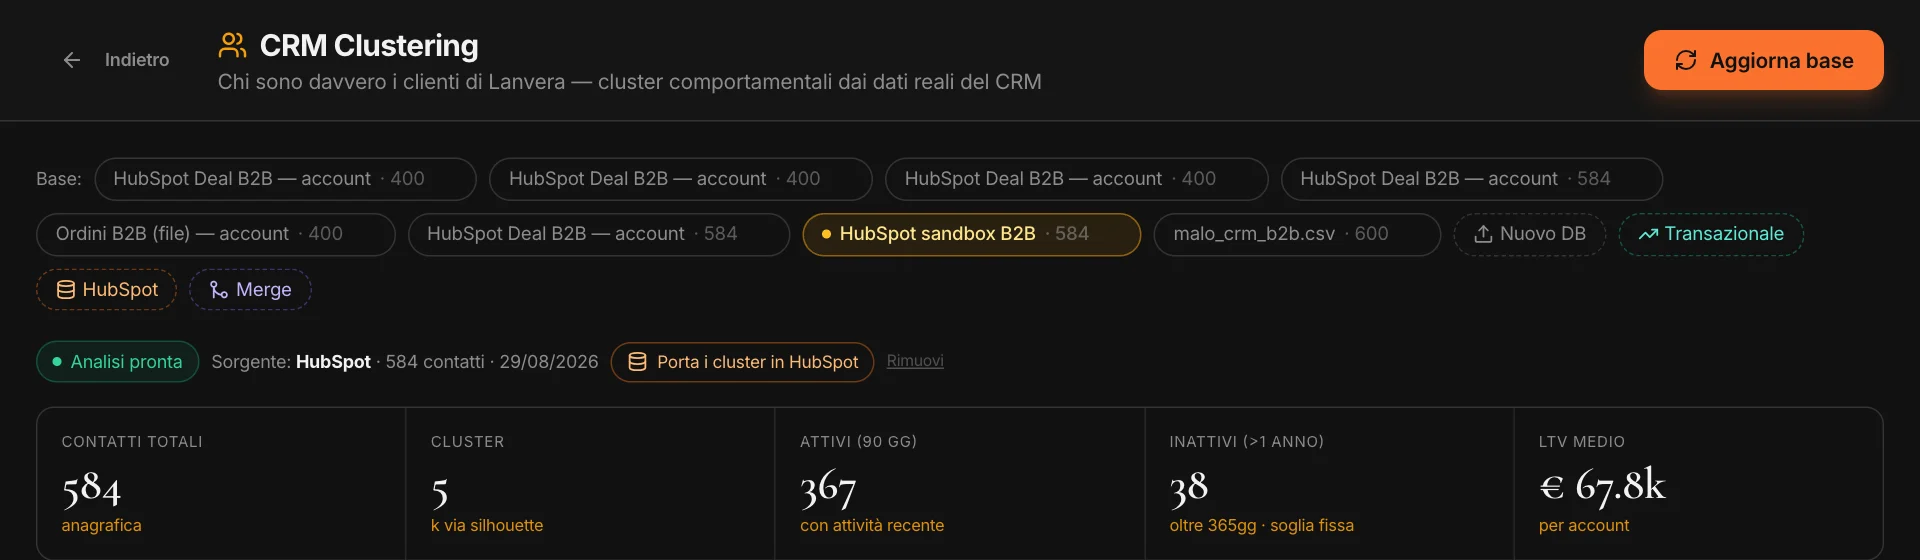
Read from HubSpot. Send the groups back to HubSpot.
The import only reads. You choose what counts as a purchase — only won deals, or all of them —, where to take the category from, the currency. “Detect from my HubSpot” proposes the settings by looking at your portal.
Then, if you want, “Send clusters to HubSpot”: each contact — or company, in B2B — receives its group, value and status. Your team finds them in the CRM they use every day, for lists and automations. And they can be removed in one click.

The groups that exist.
Not the ones you imagine.
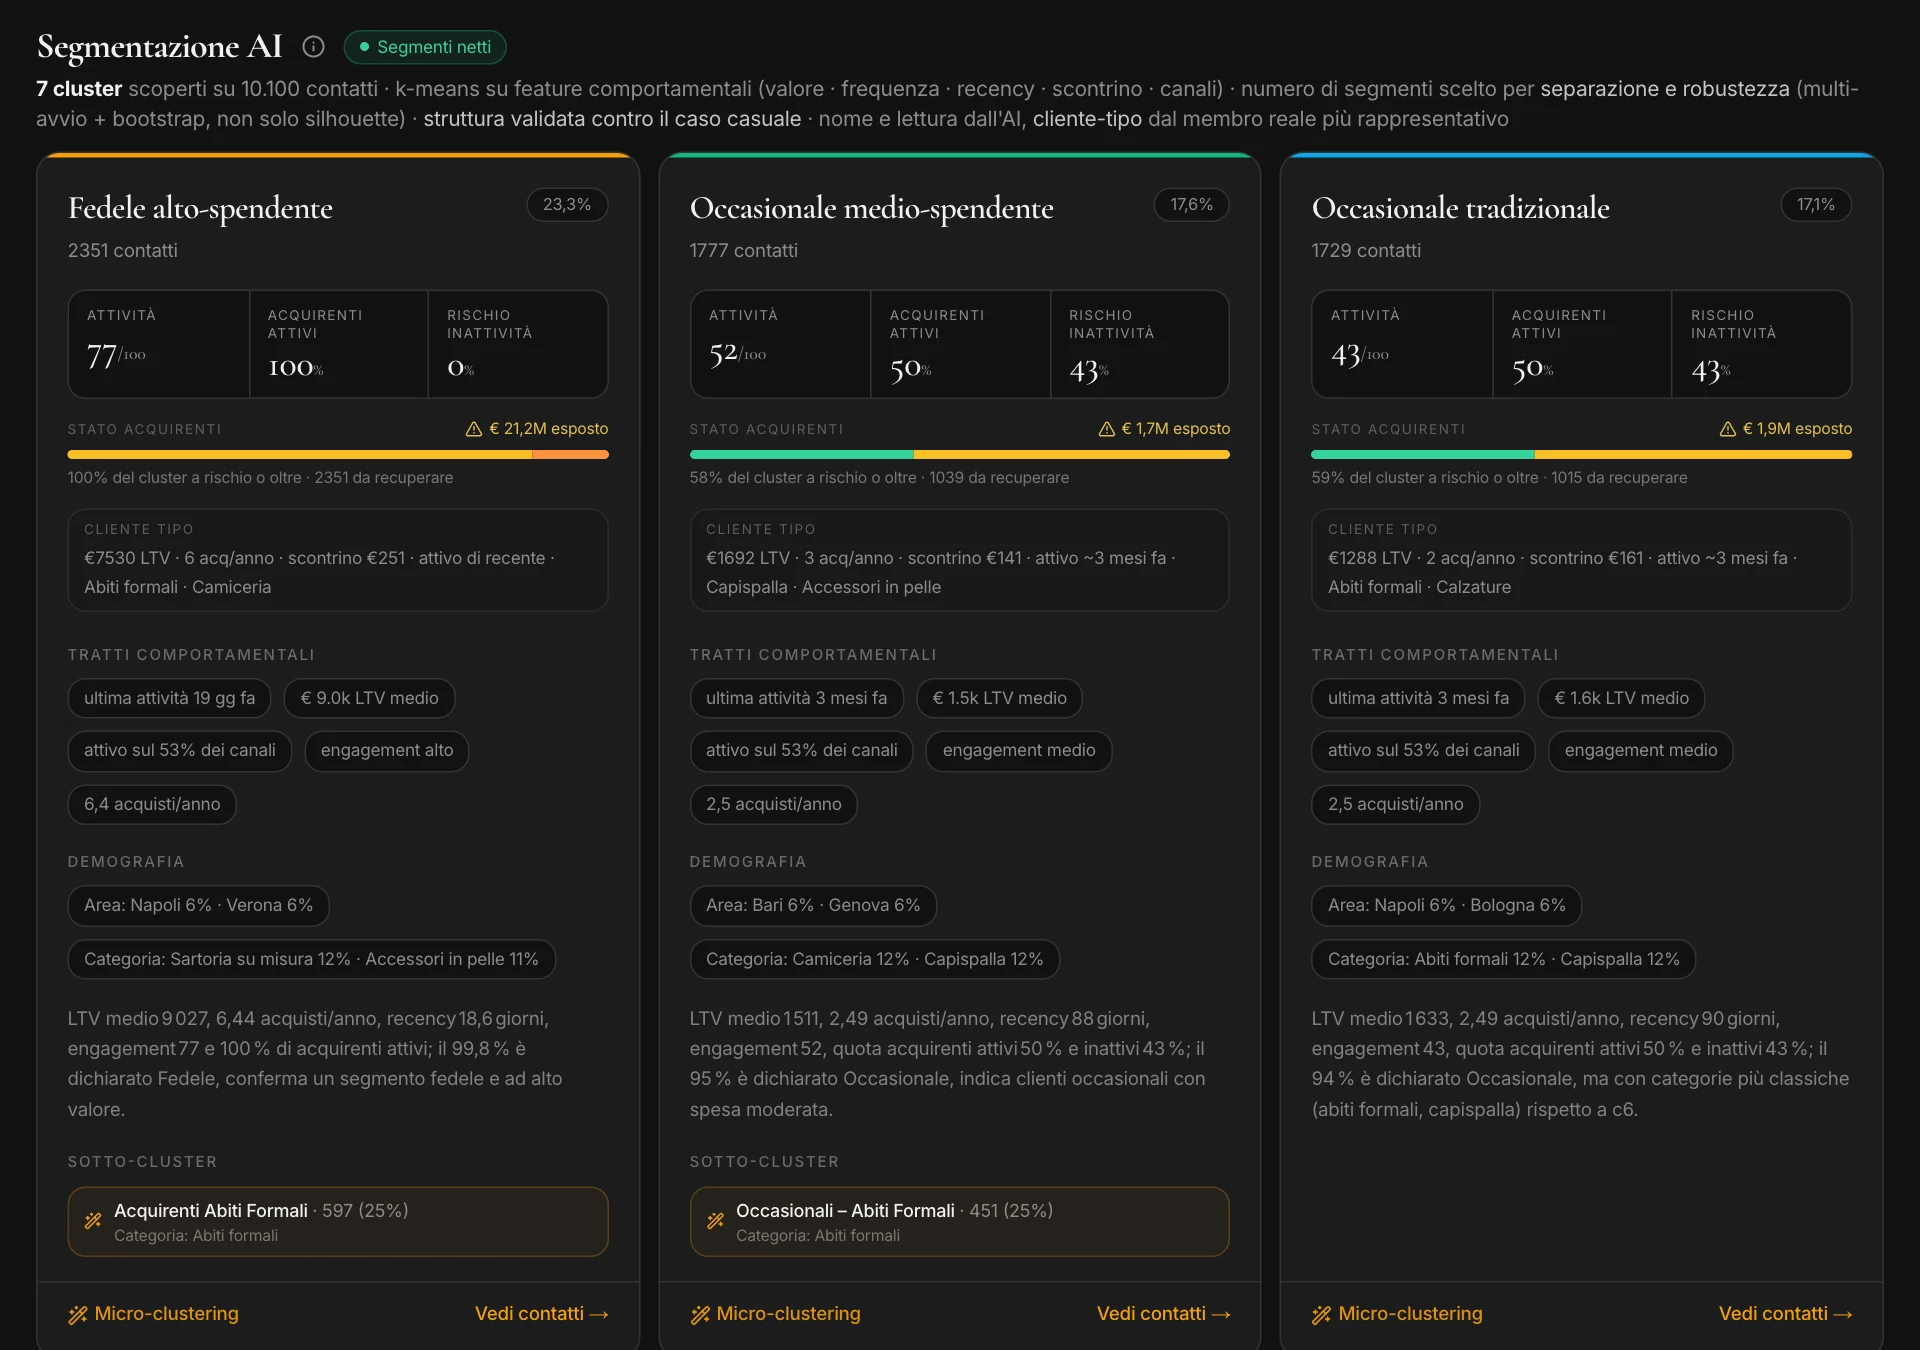
MAPS groups customers by how they behave — value, frequency, how long ago they bought, basket size, channels used — and decides how many groups to make by looking at how well separated they are and how stable they stay if the calculation is run again. Then it tests the result against chance: if your customer base is homogeneous, it tells you so instead of inventing segments. The AI gives each group a name and a reading; the typical customer is the most representative real customer.
Who you’re losing
For each customer, how far behind their own buying rhythm they are: active, at risk, dormant, lost. And the value at stake — what the customers slipping away are worth.
The typical customer
Value, purchases per year, basket size, last activity, categories: a real customer, not an average.
A finer cut
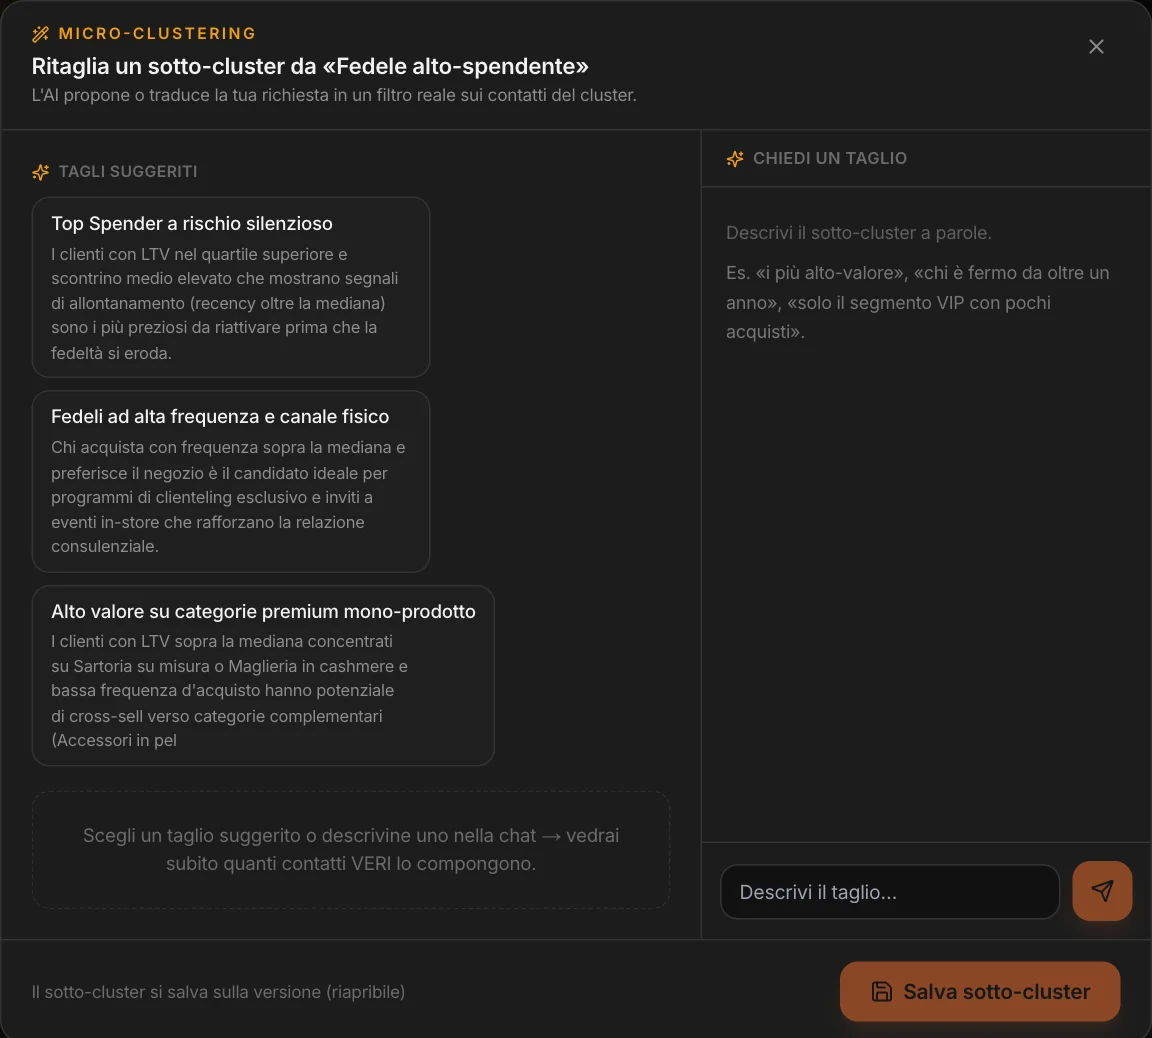
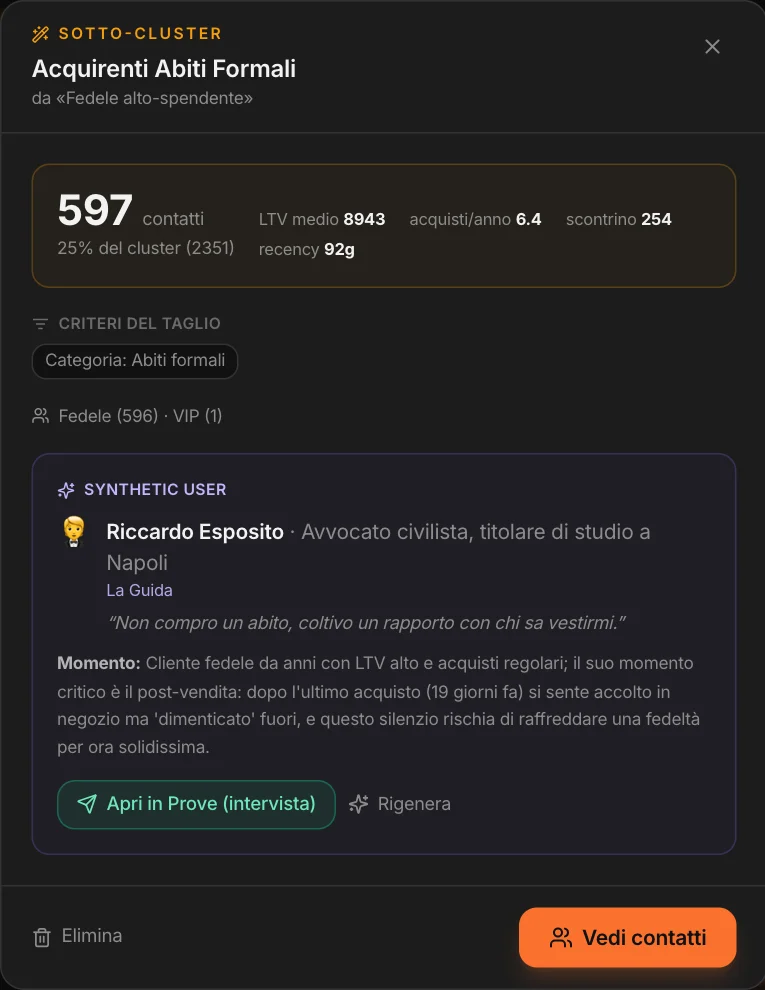
Micro-clustering carves out a sub-group: the AI proposes the cuts, or you ask in plain words — “who hasn’t bought in over a year” — and you immediately see how many real customers are in it.
With orders, what they buy too.
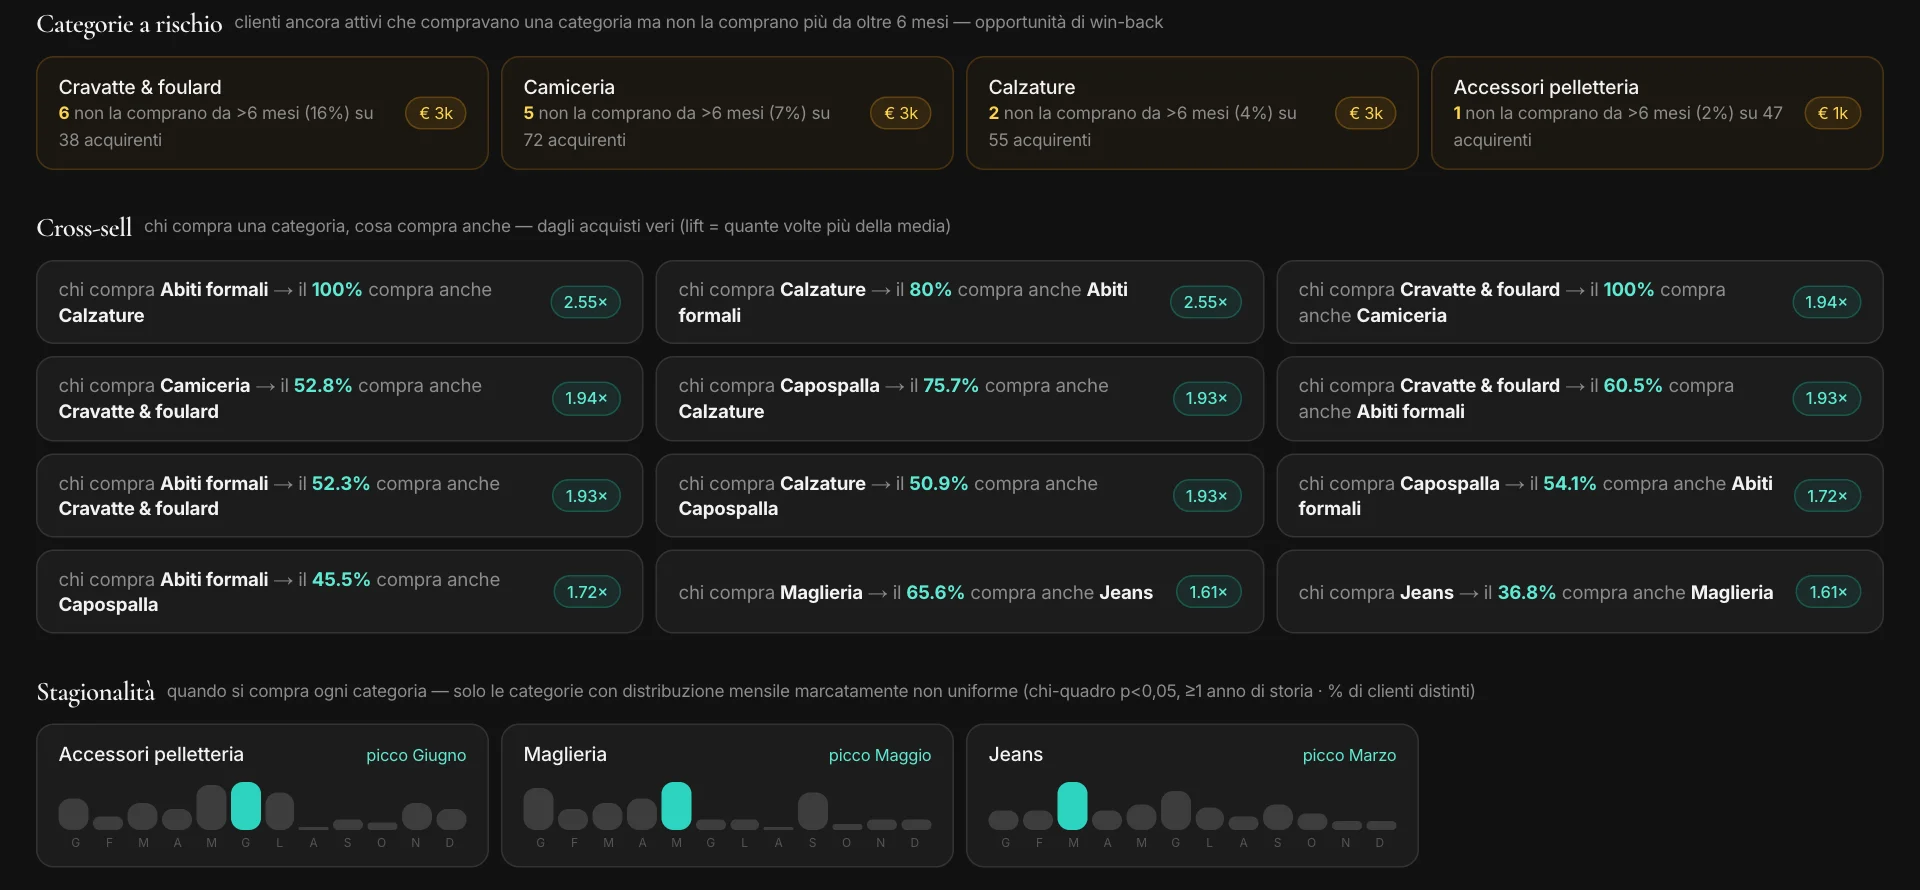
From the orders file: categories at risk — active customers who have stopped buying a category —, cross-sell — who buys A also buys B, and how much more than usual —, and each category’s seasonality, only when it’s statistically real.
From the group,
to the people.
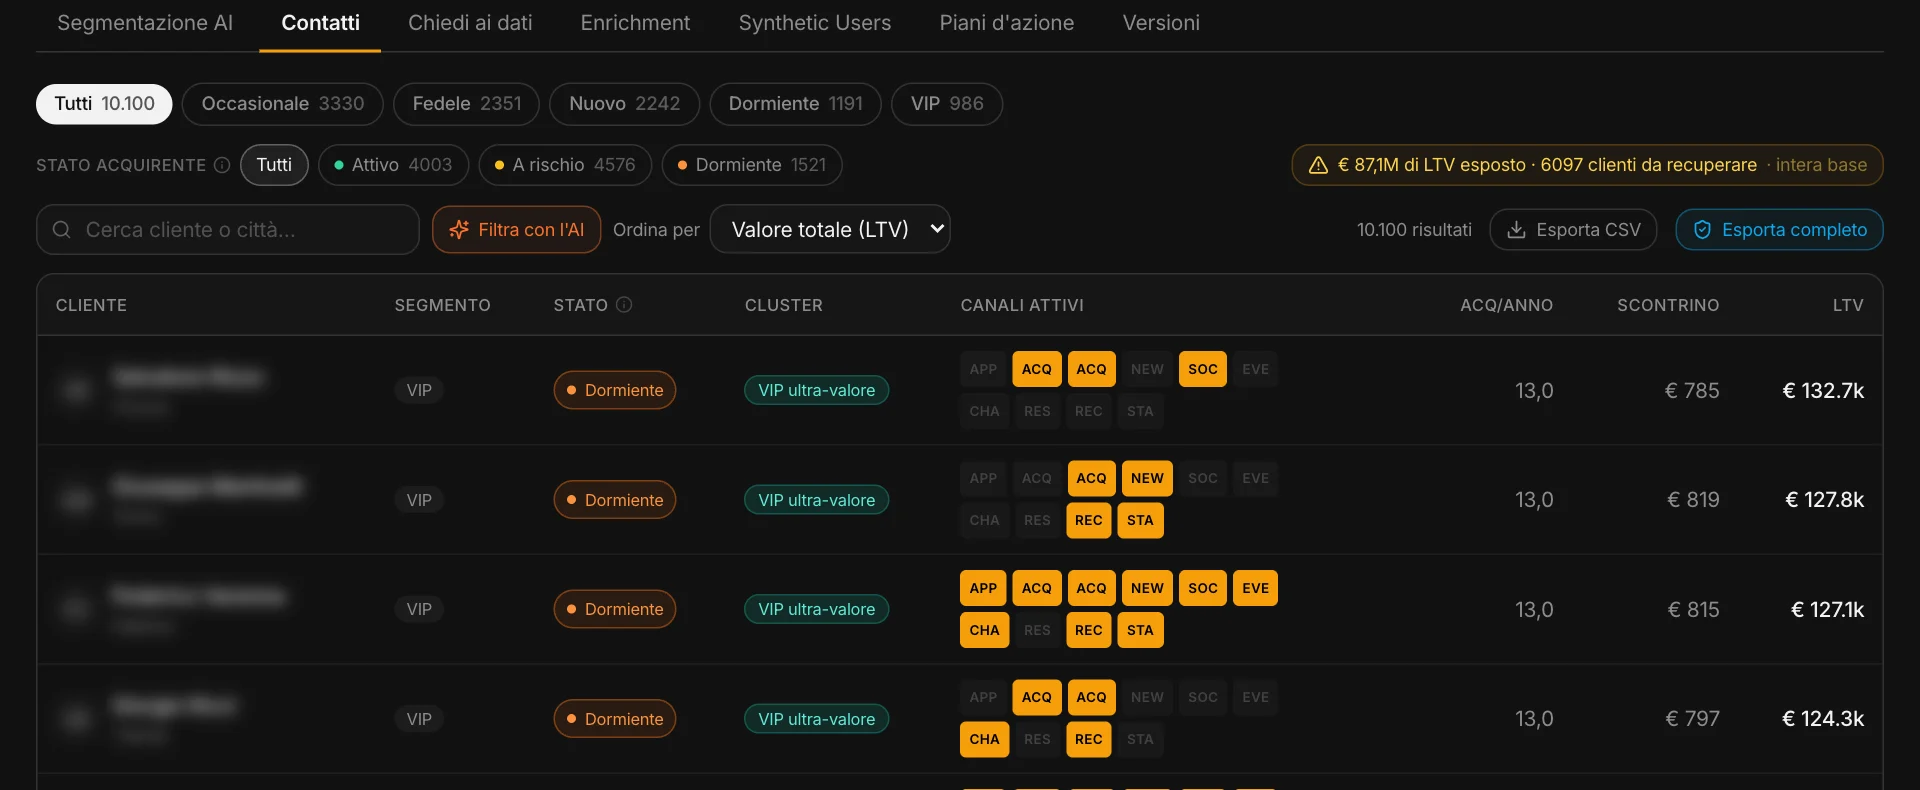
Filter by group and by status, search, sort — or describe who you want to see and the AI turns it into a filter. At the top, how much value you risk losing across the whole database. Every list can be exported.
One question.
The real numbers.
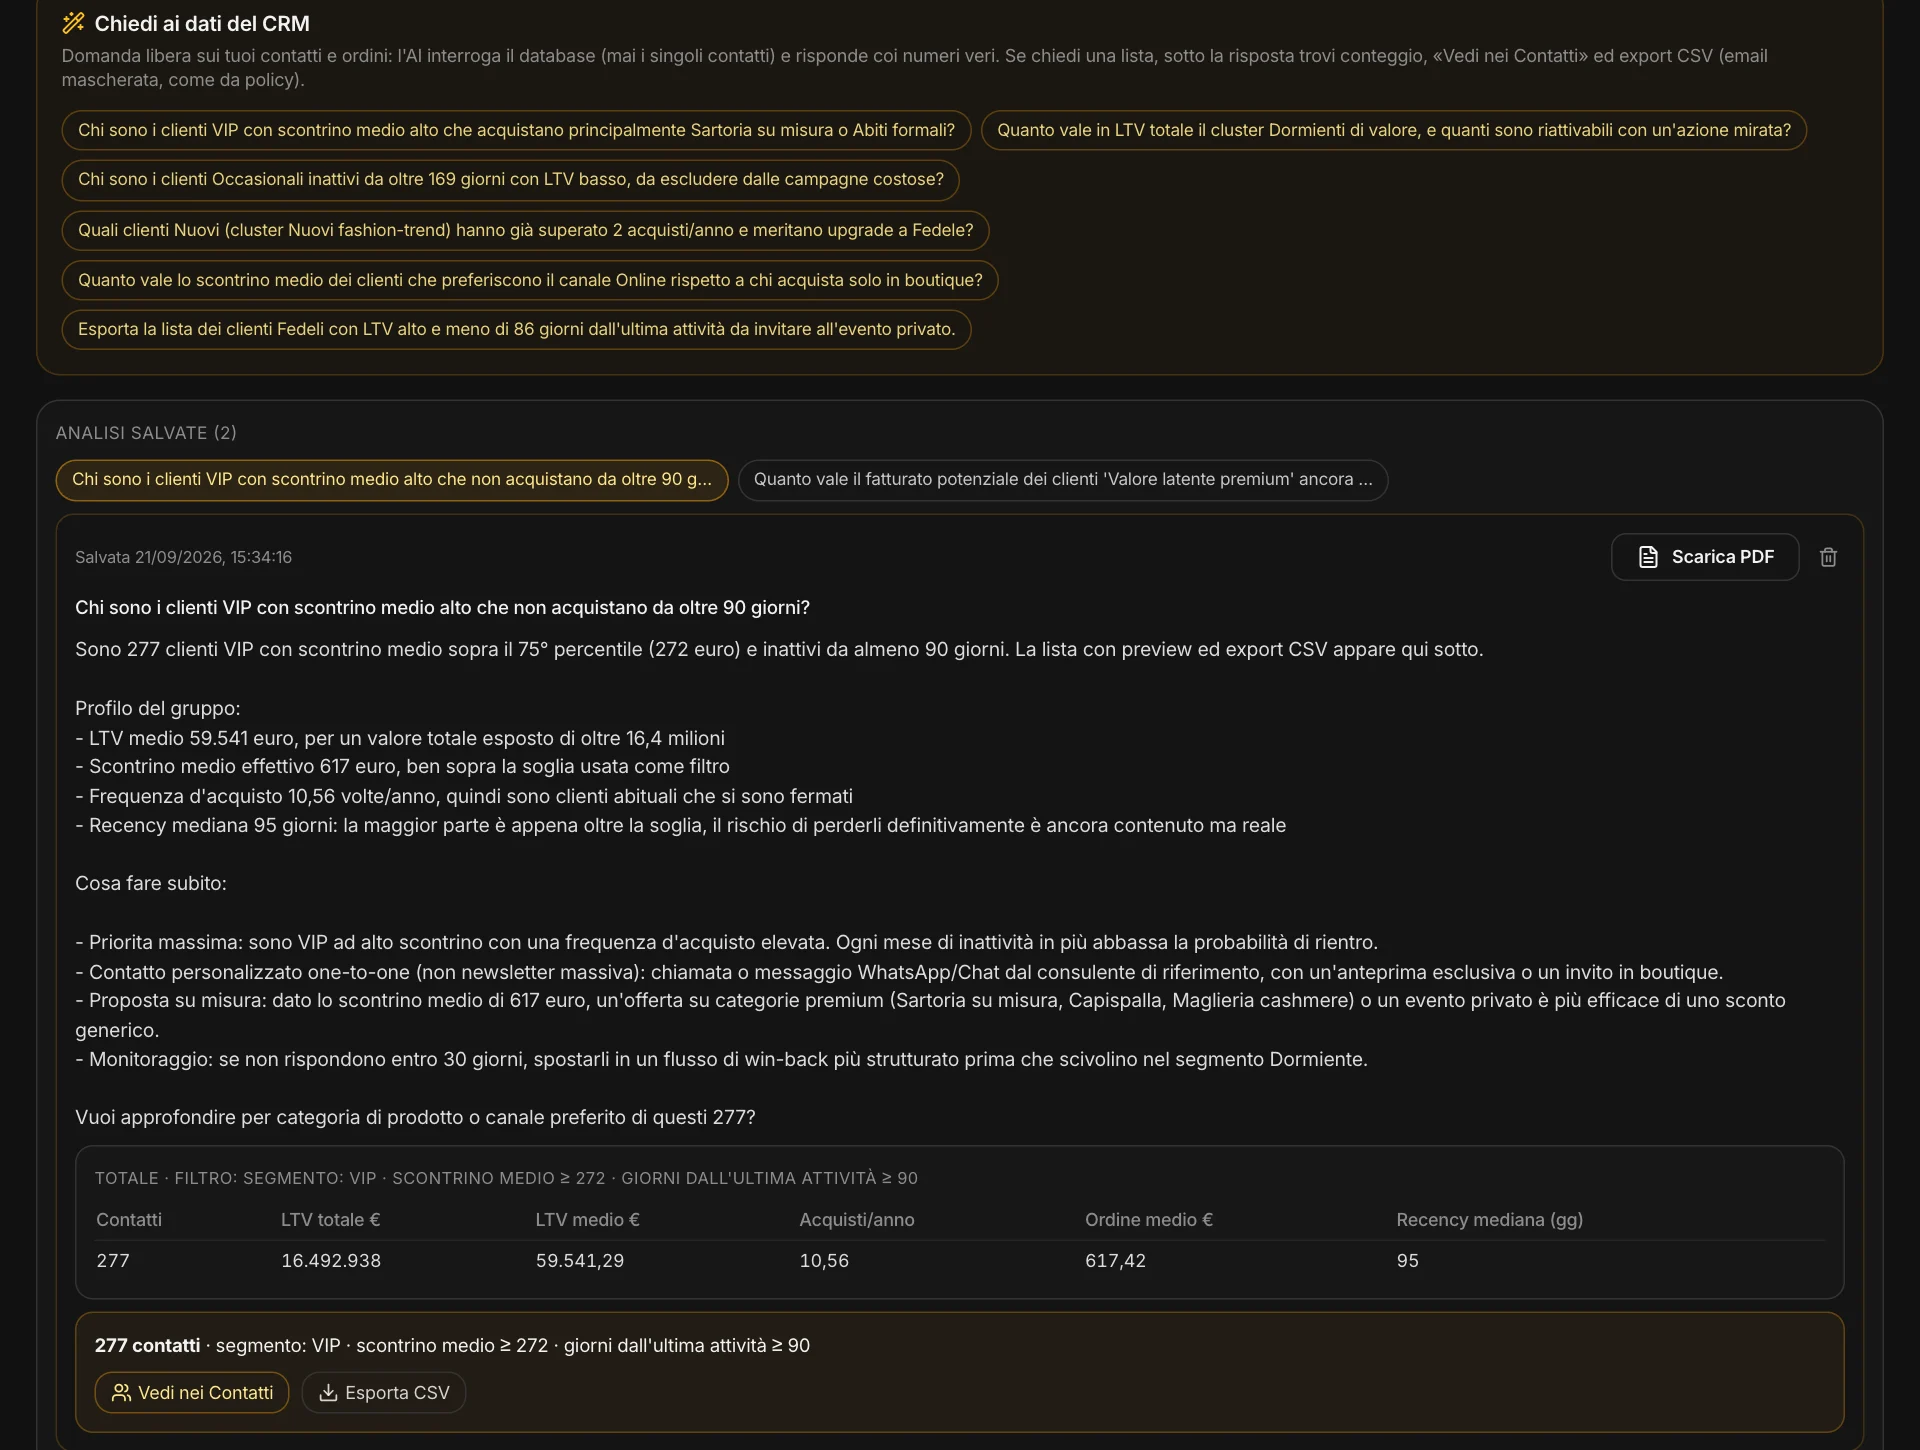
“Who are the high-basket VIP customers who haven’t bought in over 90 days?” The AI doesn’t remember your contacts and doesn’t see them: it queries the database and answers with the numbers that come out of the calculation. If you ask for a list, you open it in the contacts or export it. Answers can be saved and exported to PDF.
Behavior tells you what they do.
The rest tells you why.
Add the layers you have: NPS, a survey — MAPS recognizes its dimensions —, qualitative research in PDF, Word, Excel, and the Monitor’s market data. Each answer is attributed to its group; then Claude Opus merges it all into a strategic reading for each group: what’s happening, the opportunity, the risk, with the sources.
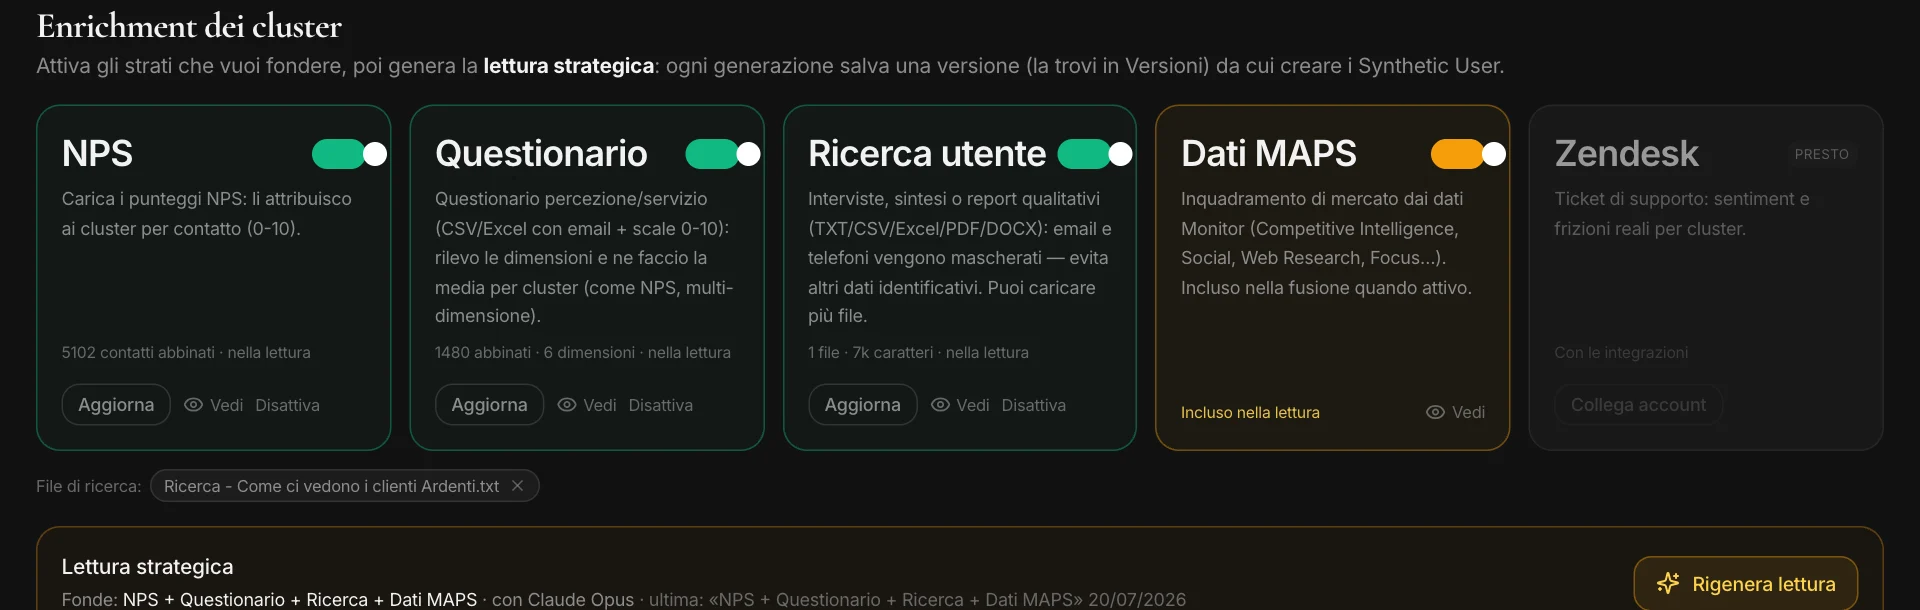
One group, read from every angle.
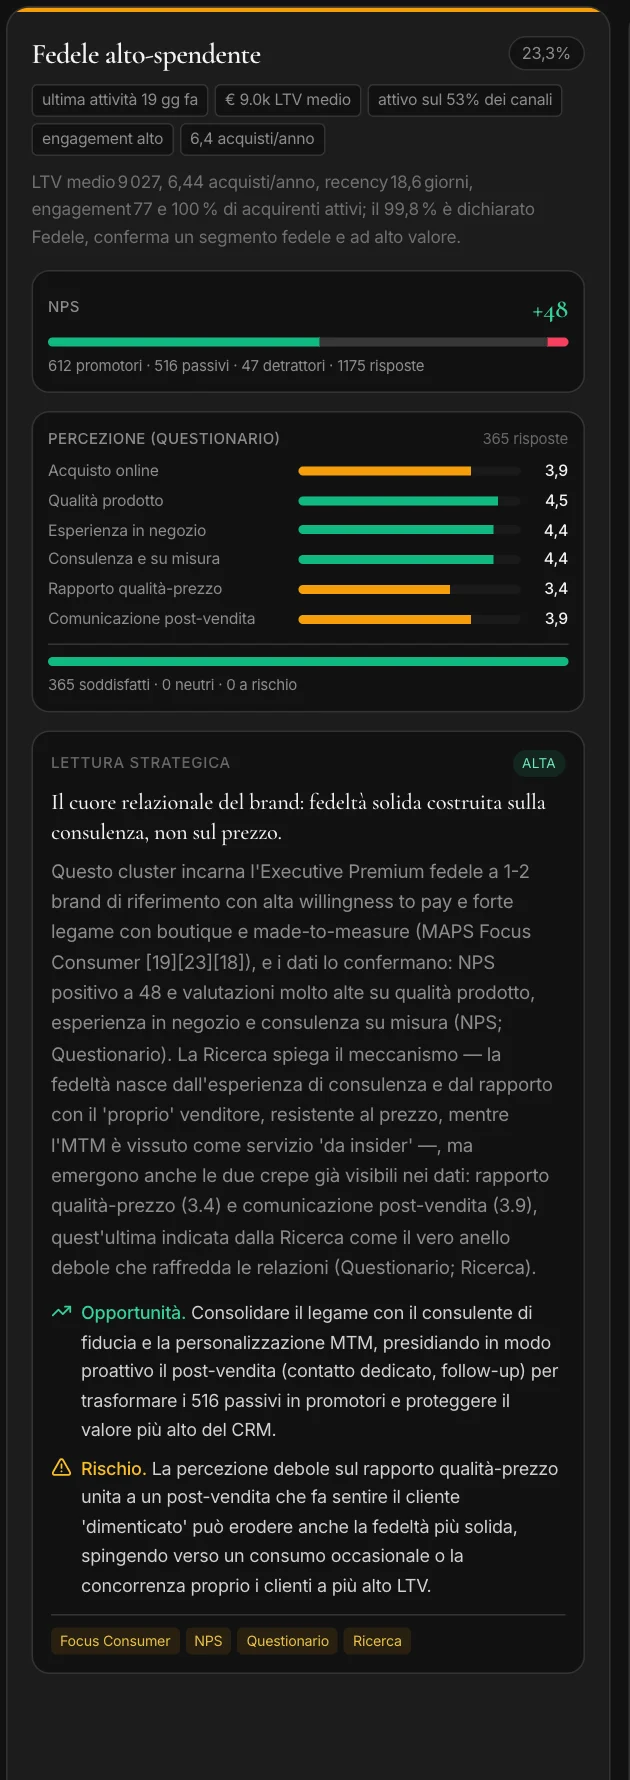
The behavior, the NPS with promoters and detractors, the survey dimensions, and the reading: for loyal high-value customers, the crack is after-sales service. Every reading is a version: you compare them over time.
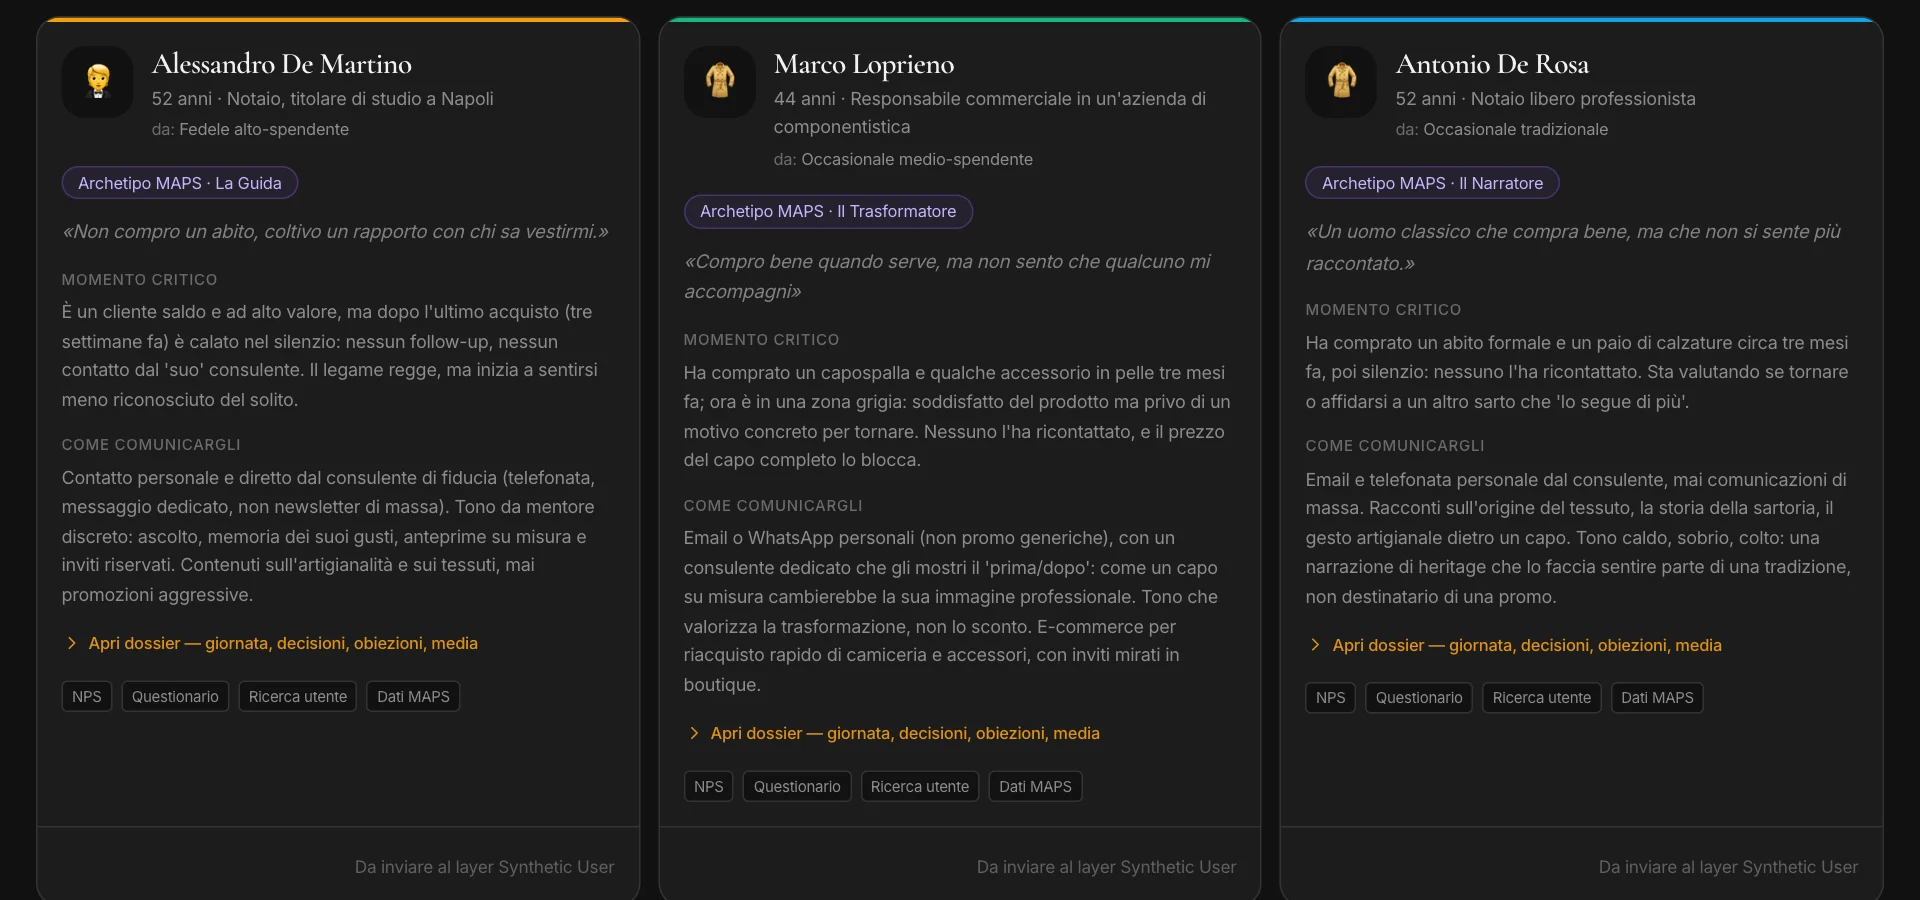
Every group becomes a persona.
And a plan.
For each group, a deep synthetic persona — their day, how they decide, their objections, the critical moment, how to talk to them —, built from the group’s numbers and the enrichment, never from individual customers. You send it to Prove and interview it.
Then, what to do.
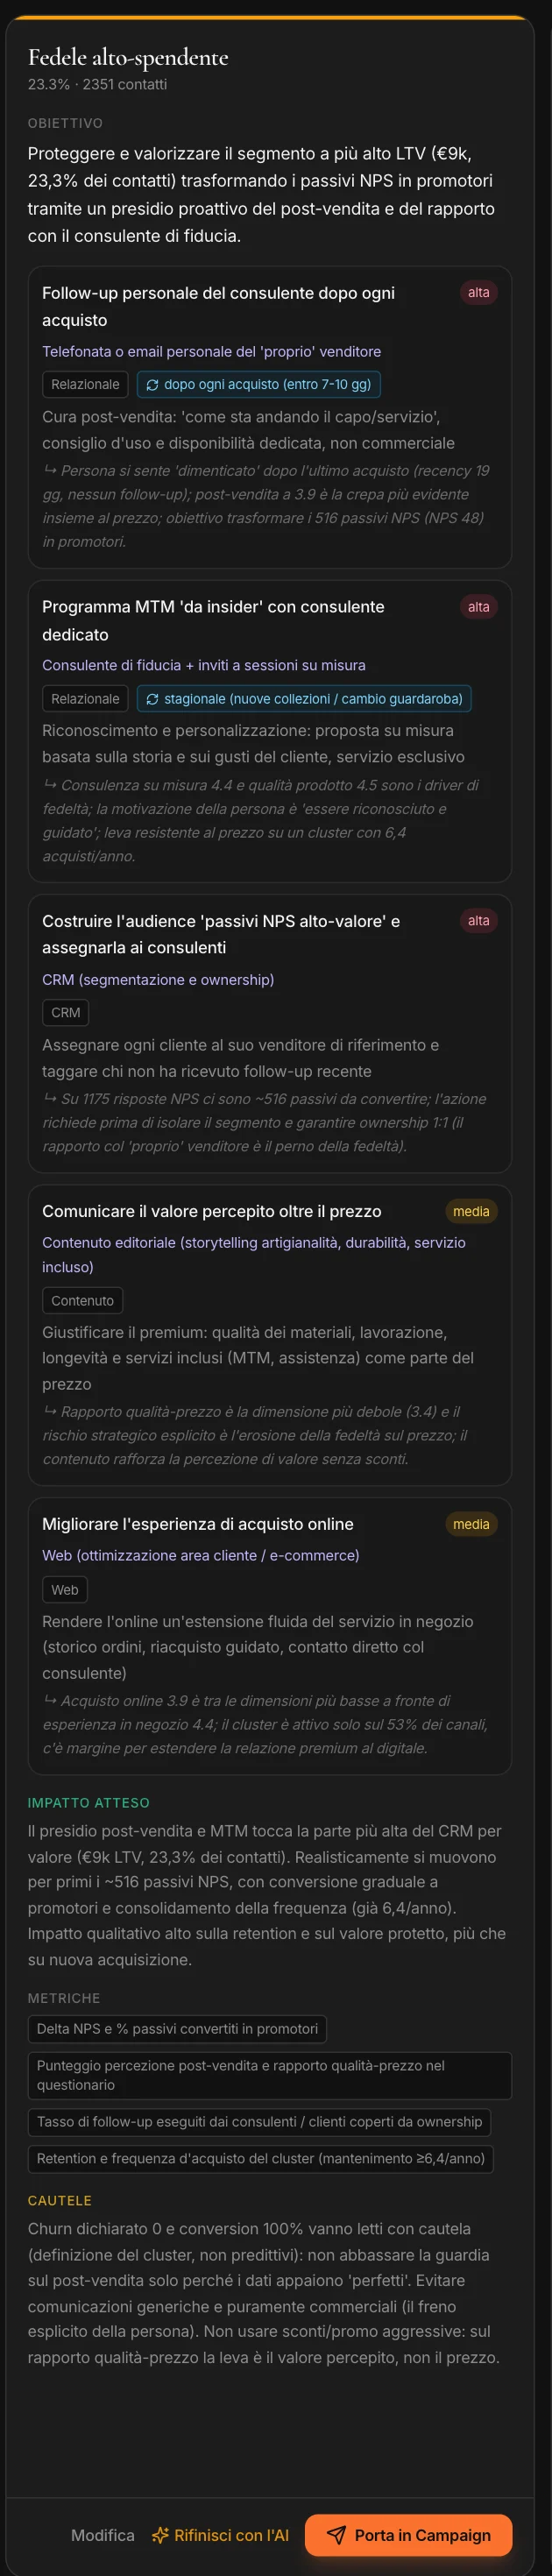
For each group, a plan: the objective, the actions with their channel and the reason — the signal they come from —, the expected impact, the metrics, the caveats. You refine it by talking it through with the AI.
With “Move to Campaign” the plan becomes a campaign: emails, social posts and content open in the Studios with the brief already written; relationship actions become tasks for the team.
Your customers
stay yours.
Never to the AI
Contacts stay in the project’s database: never in the chat, never in the memory. Only aggregate numbers reach the AI.
Pseudonymized emails
Each customer is recognized by an encrypted fingerprint of their email: databases, NPS and surveys are matched without using the plain-text email.
A key only you have
If you want to export emails in plain text, you protect them with a passphrase we don’t store: if you lose it, not even we can recover them.
Versions and deletion
Every import is a version: you see who changed, who is new, who left. And one click deletes everything.
In B2B too
The unit becomes the company: pipeline, open deals, win rate and sales cycle go into the calculation. And from a CRM account comes the buying committee to simulate in Prove.