
Start from your file.
As it is.
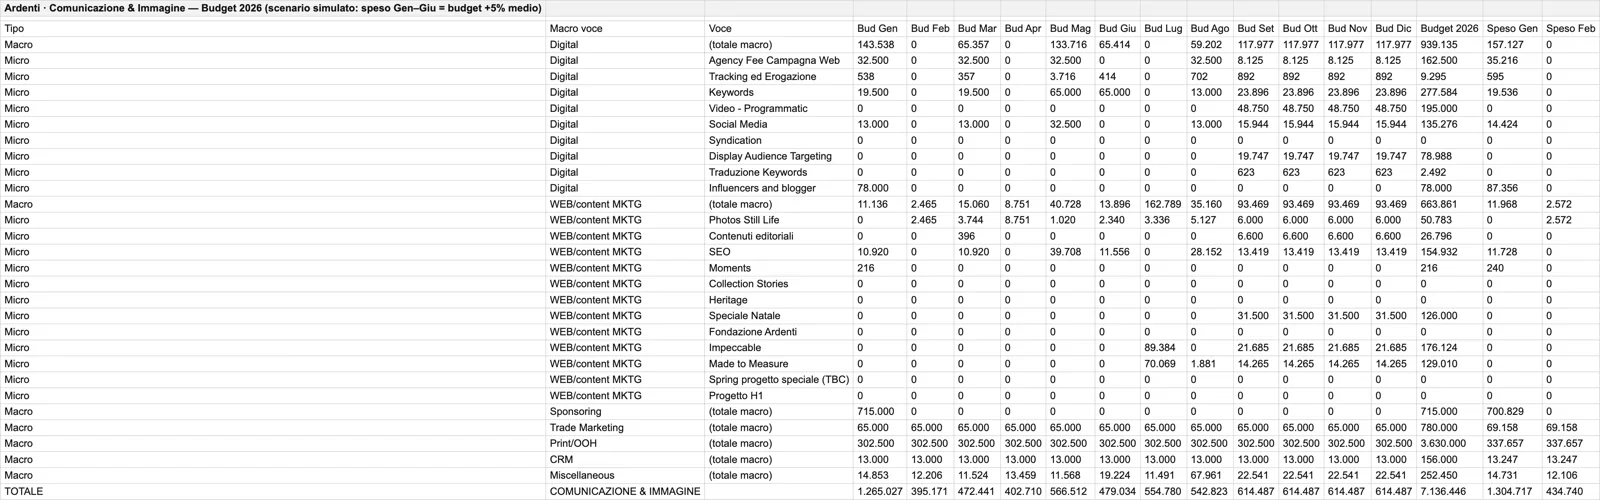
Excel, CSV, PDF, Word: every marketing department has its own format, with its own total rows, months in columns, actuals alongside. MAPS reads it and understands it — macro items, micro items, months, the year’s spend, previous years’ actuals — and tells you what it understood. You check, correct, save. Whatever isn’t in the file stays empty: nothing spread out, nothing estimated.
Four ways
to look at the same budget.
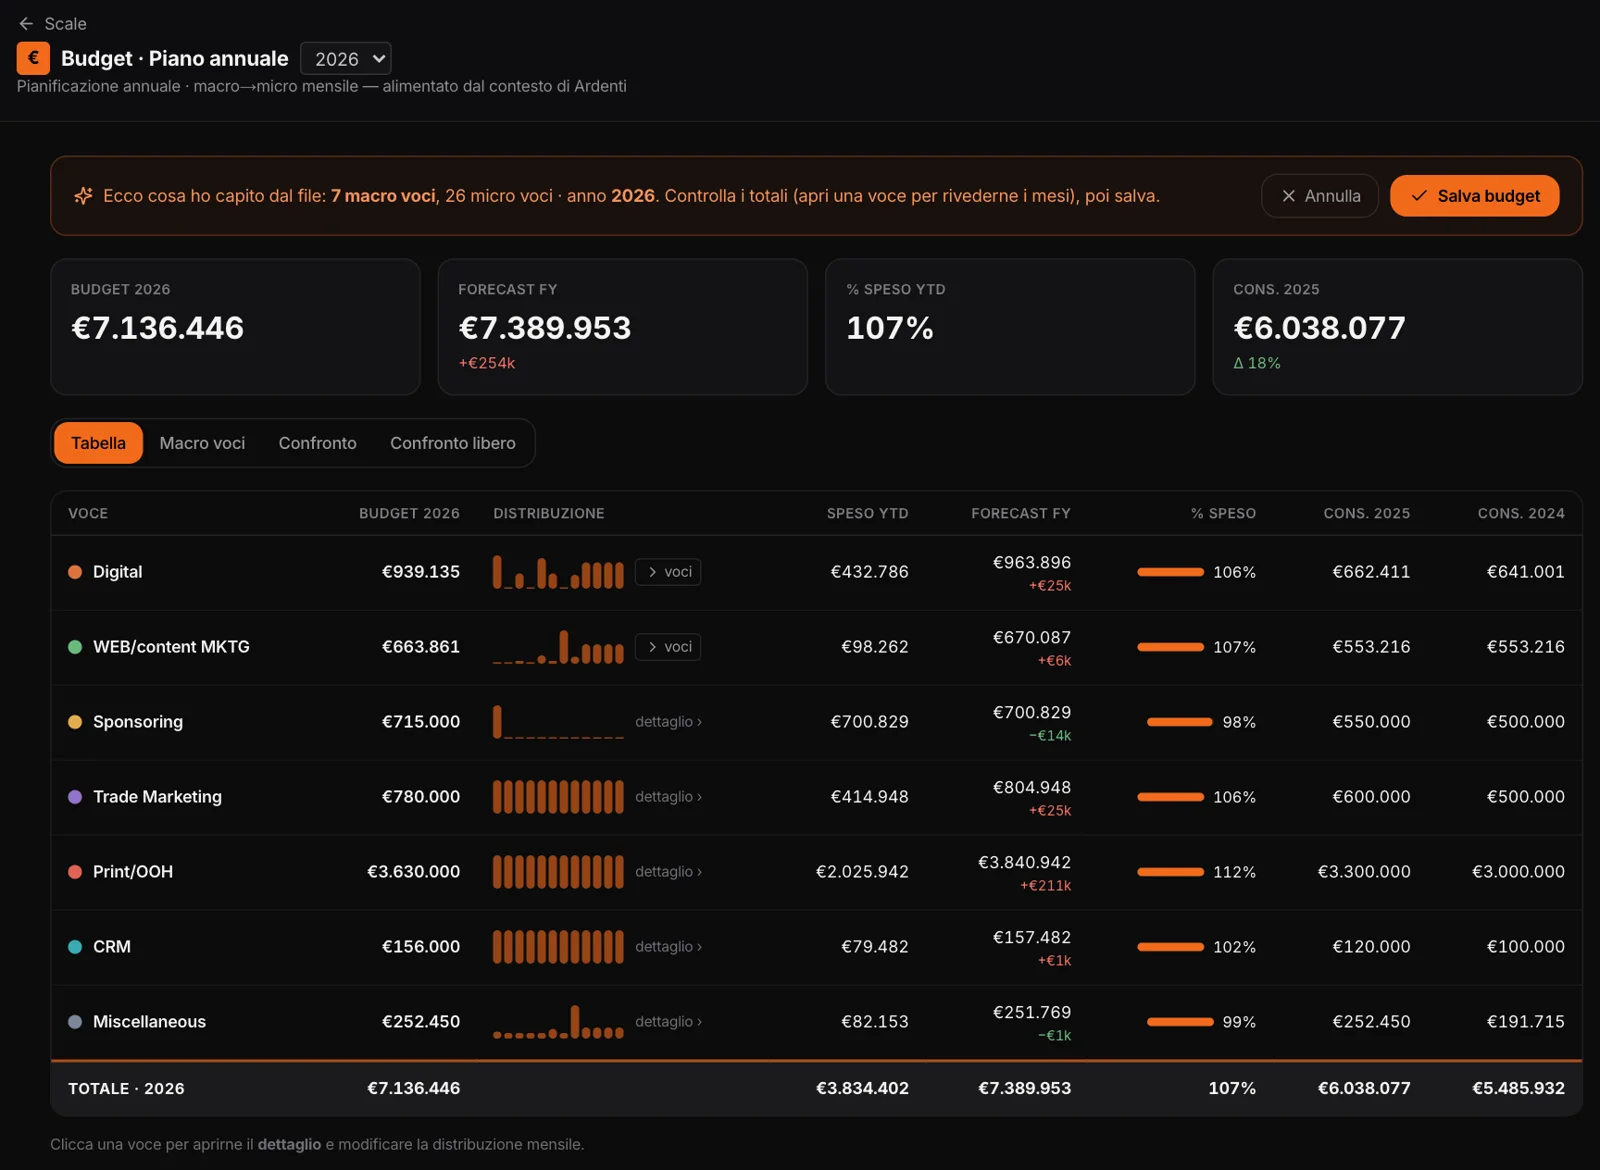
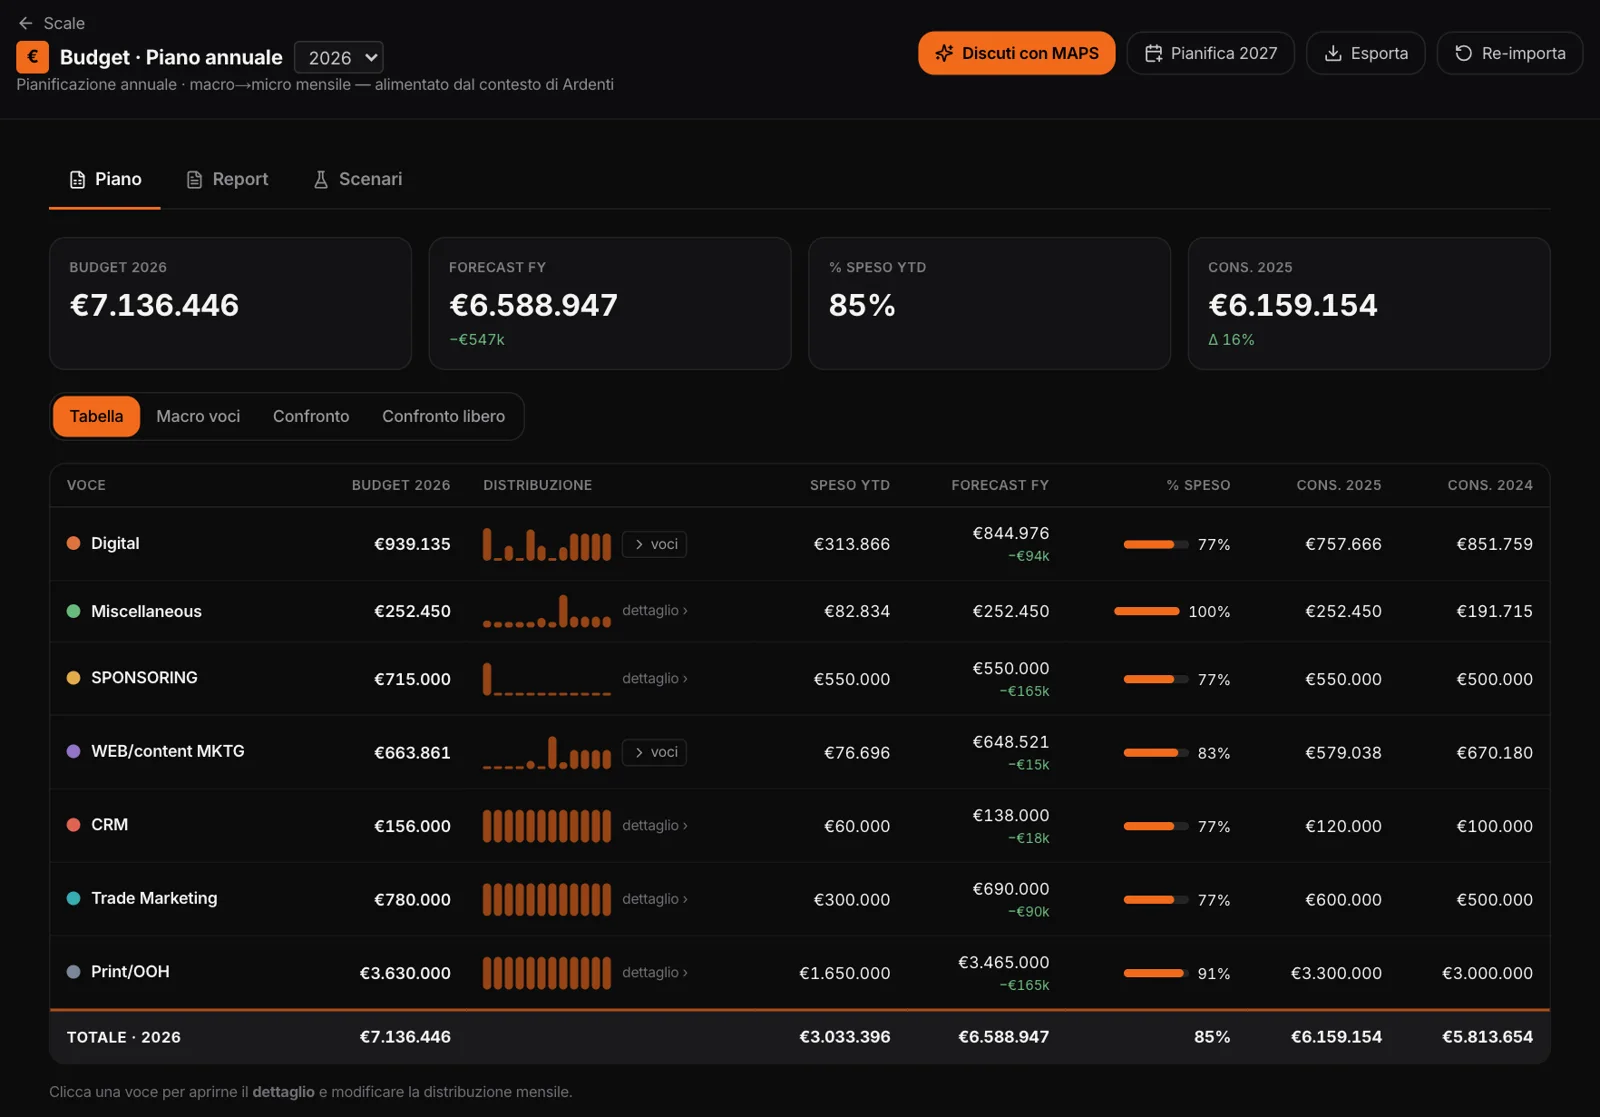
At the top, the numbers that matter: the budget, the year-end forecast and the variance, the percentage spent so far, the previous year’s actuals. Below, the line items, each with its distribution across the twelve months.
Table
Macro and micro items with budget, spend, forecast, variance and the actuals from the two previous years.
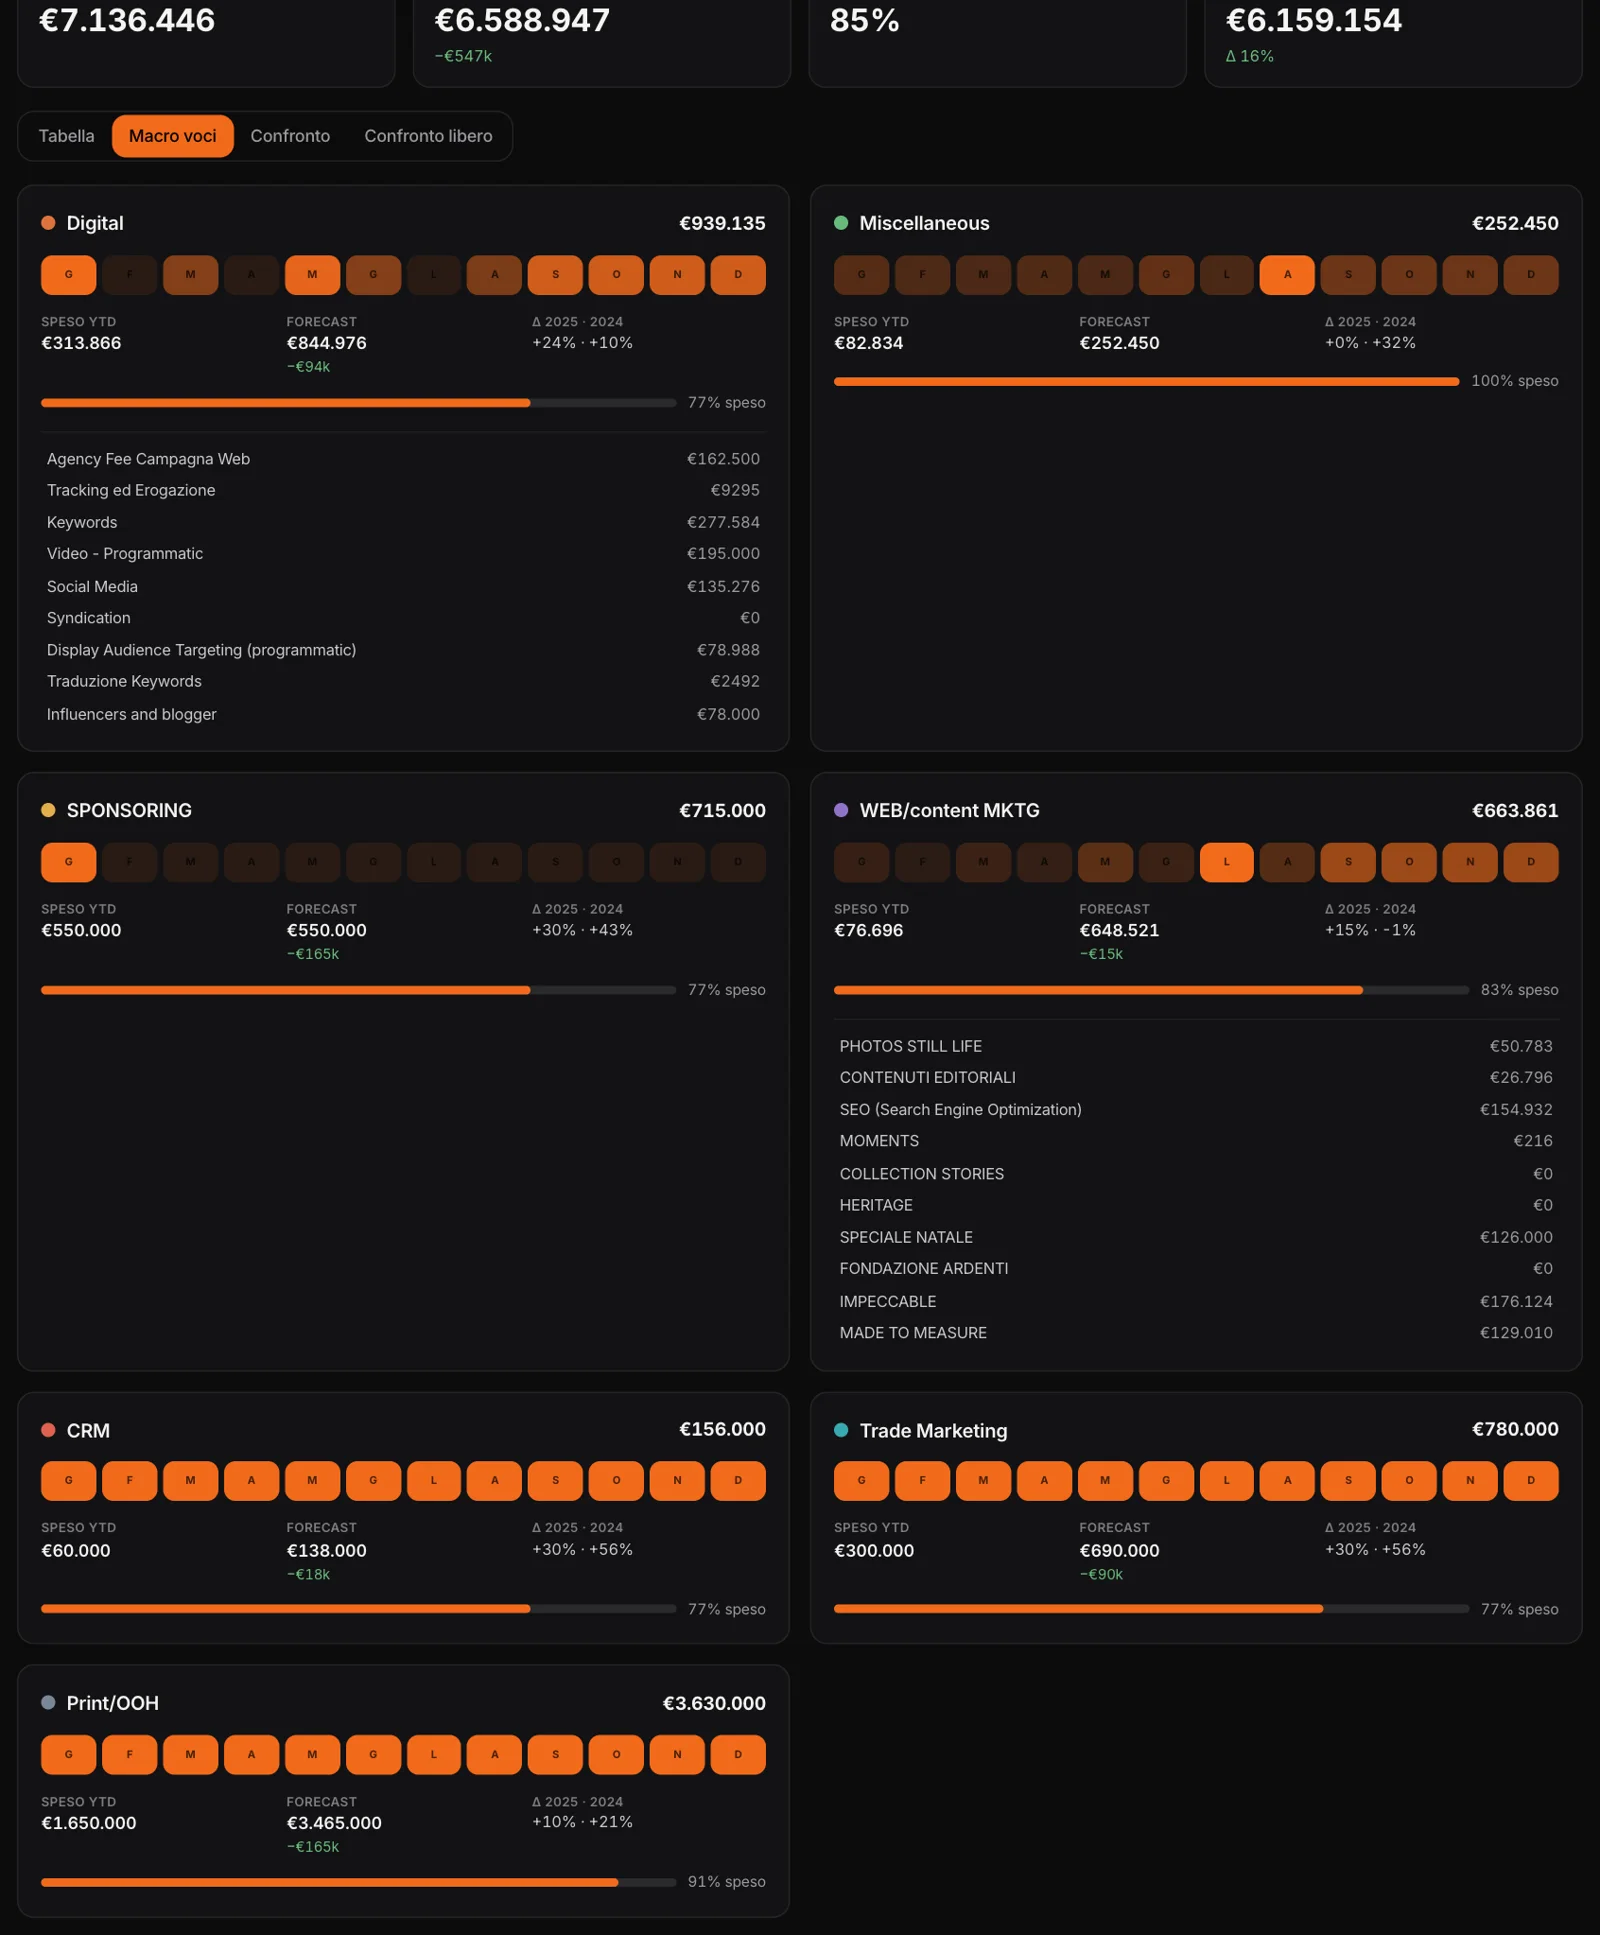
Macro items
One card per macro item, with a heat map of the twelve months and its micro items.
Comparison
The macro items year on year — actuals, budget, forecast — with the change against the baseline you choose.
Free comparison
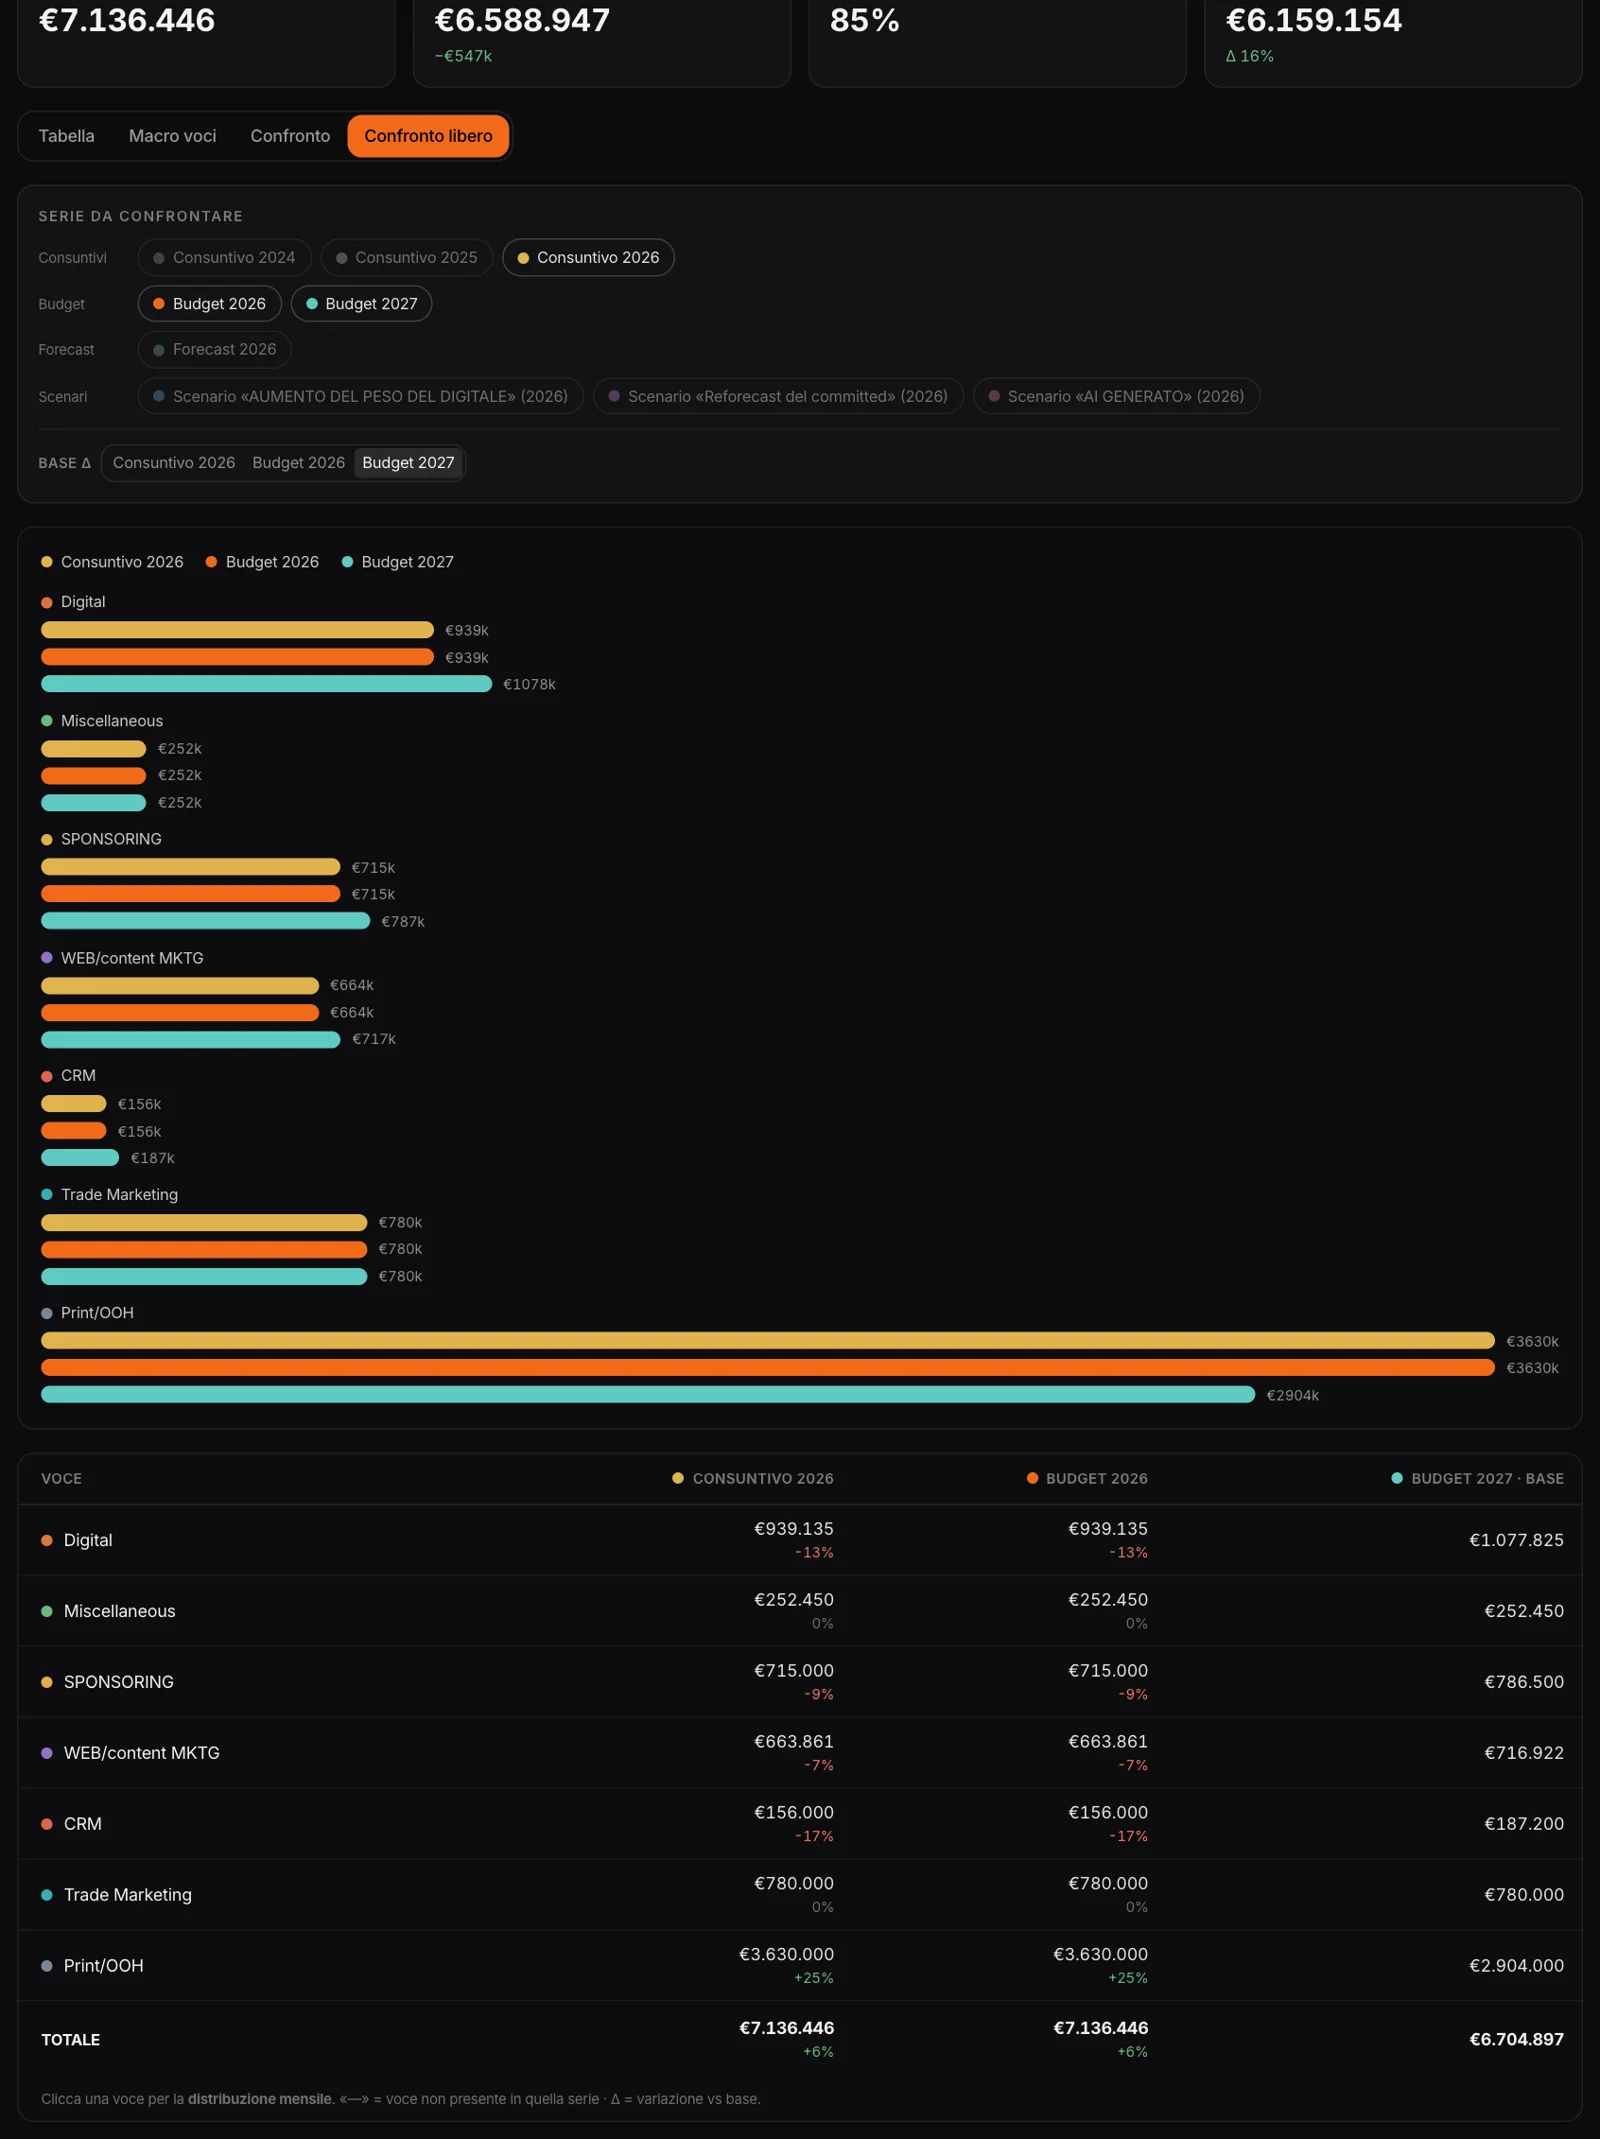
Any series against any other: several years, the plan against a scenario, a scenario against next year’s plan.
Every line item,
month by month.
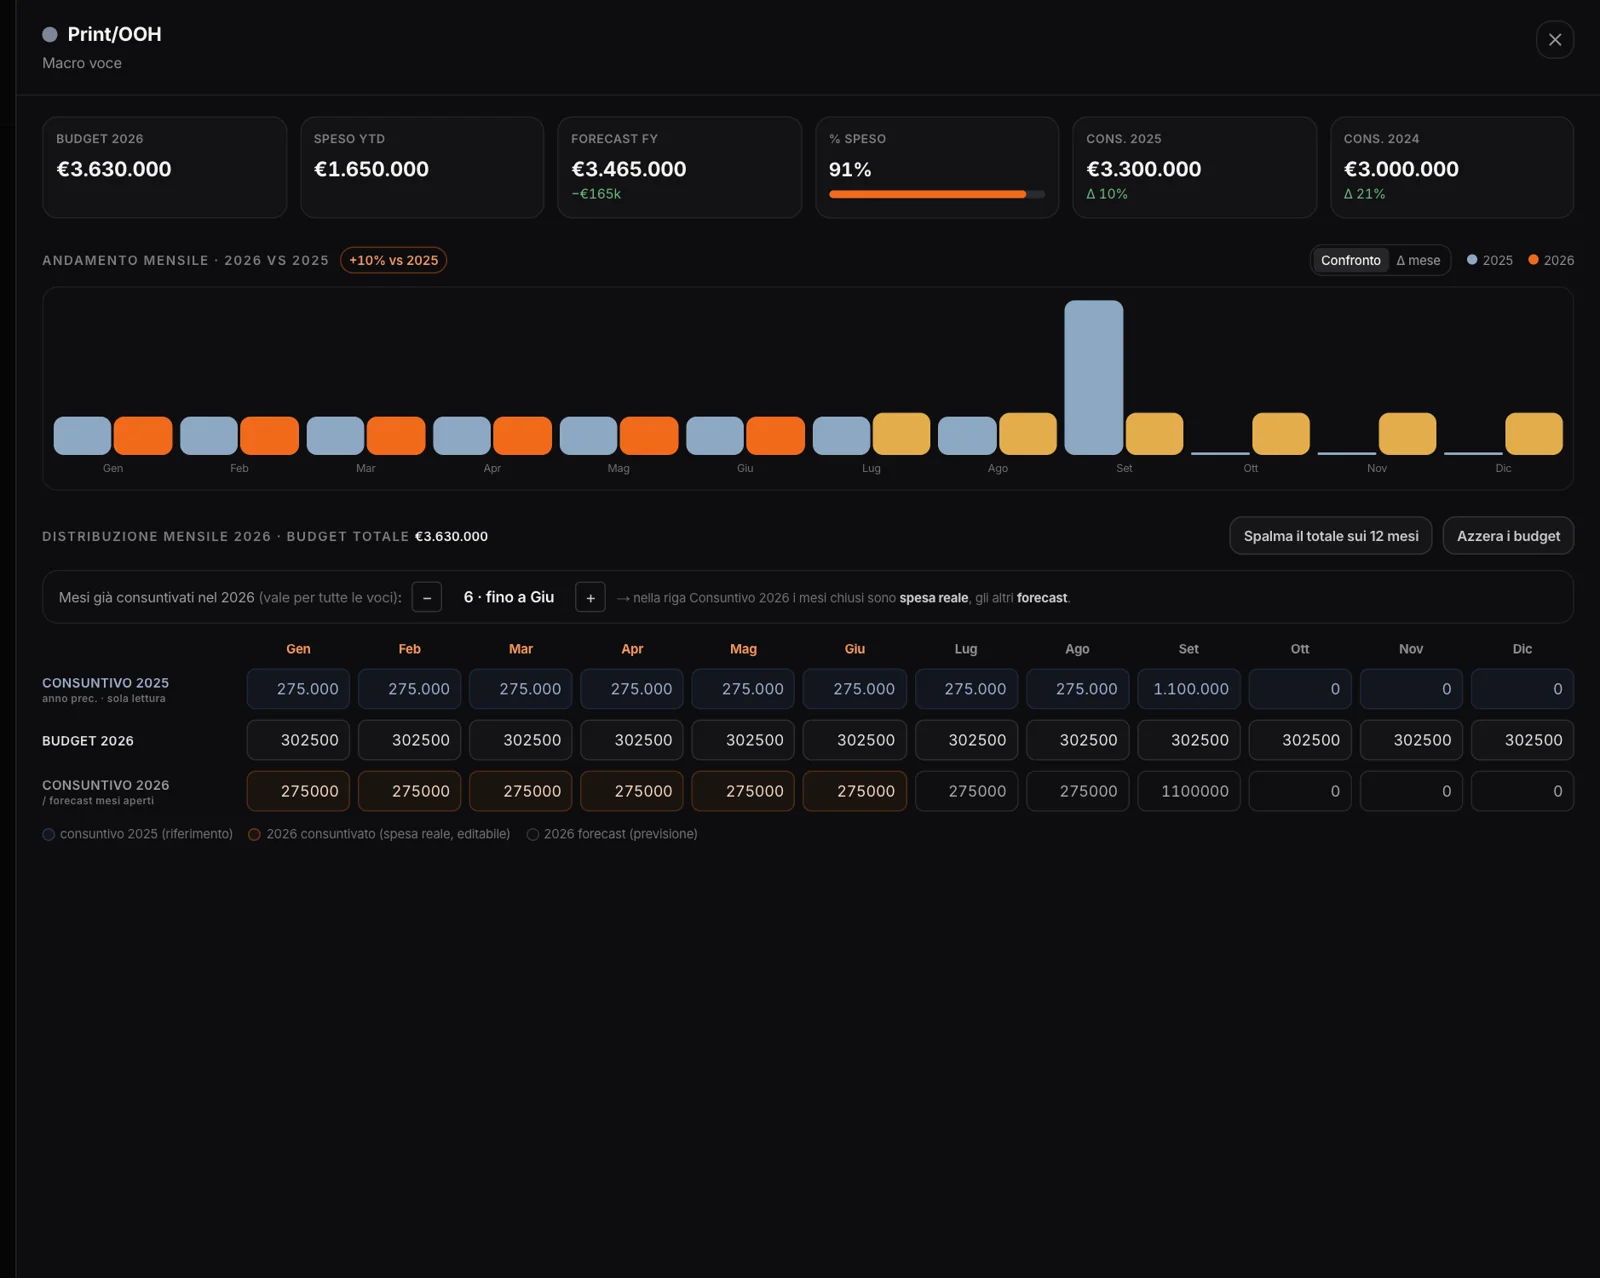
Open a line item and see it over time: this year against last year, month by month, with each month’s change. Below, three rows just like in real files — last year’s actuals, the budget, this year’s actuals — with the months already closed separating actual spend from the forecast.
You can edit the months one by one, or spread the total across the whole year. Every number recalculates instantly.
Ask your budget questions.
It answers with the right numbers.
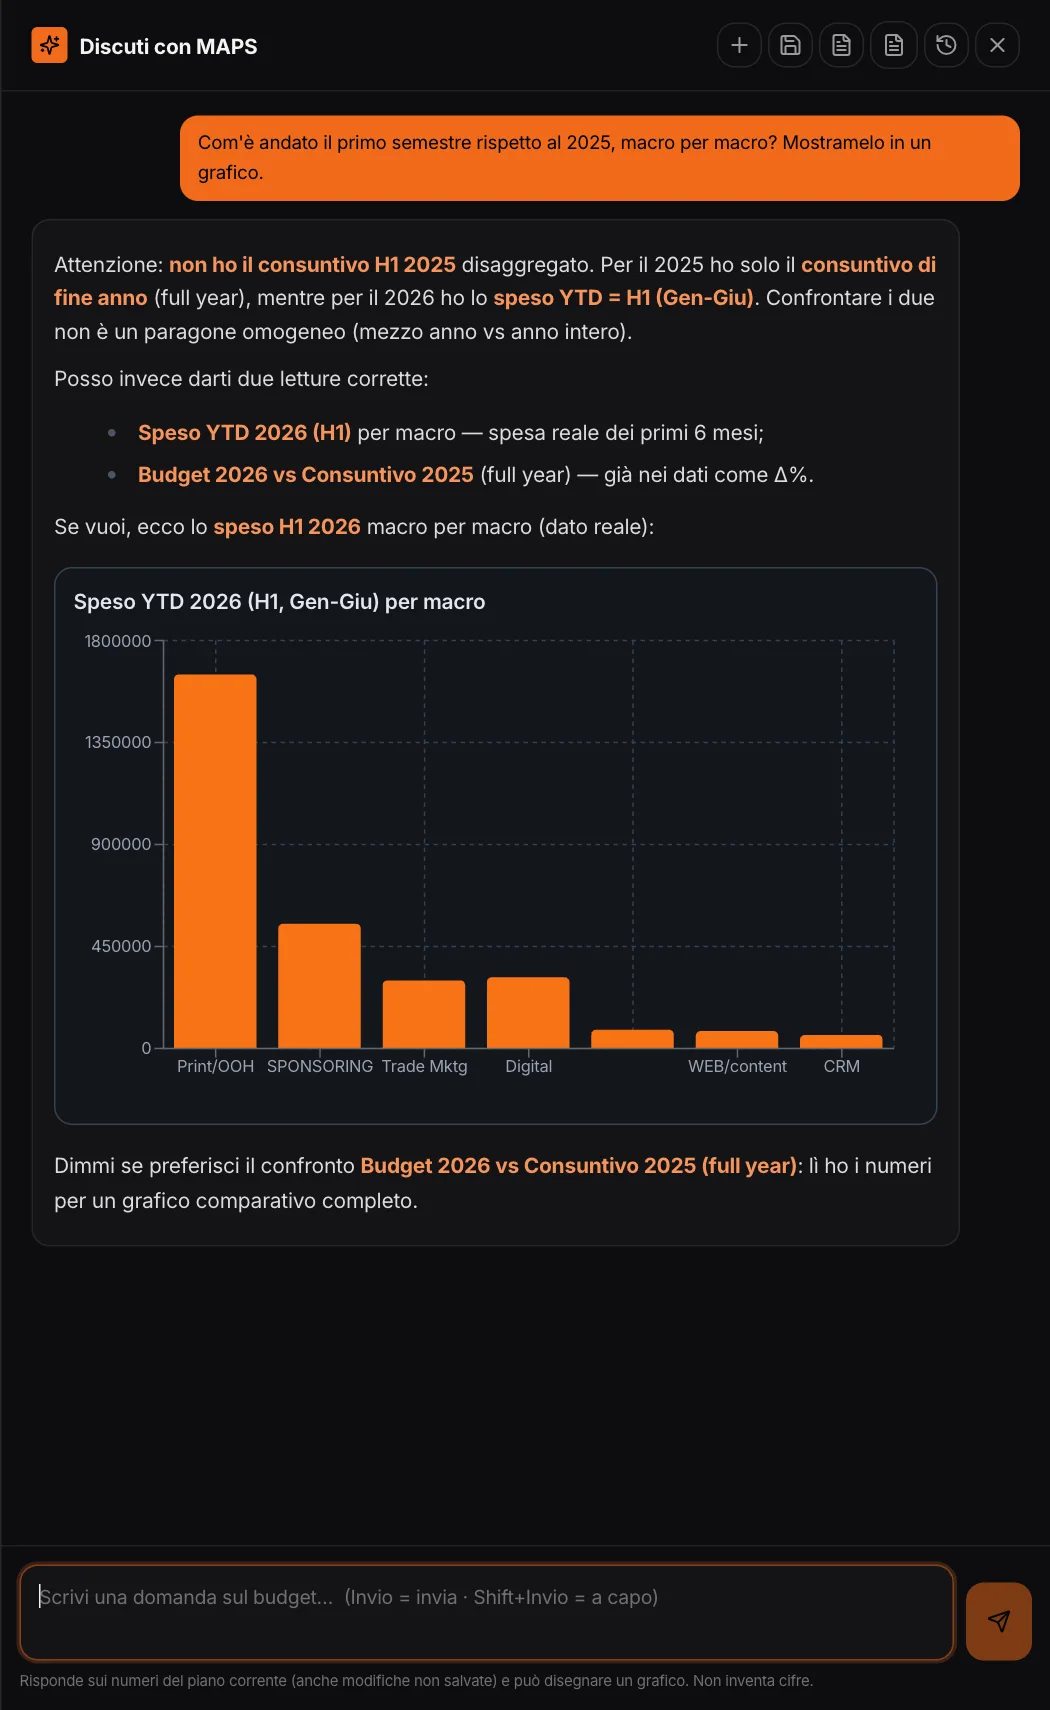
The copilot works on facts calculated by the code — totals, forecast, variances, distribution over time — even on changes not yet saved. It answers, draws a chart, and when a comparison doesn’t hold up, it tells you.
“I don’t have a breakdown of H1 2025 actuals. For 2025 I only have the year-end actuals […]. Comparing the two isn’t a like-for-like comparison (half a year vs a full year). I can give you two correct readings instead.”MAPS, asked “how did the first half go compared with 2025?”
Conversations can be saved, exported as PDFs, and turned into an executive brief: summary, key numbers, recommendations, next steps.
Two readings
of the same plan.
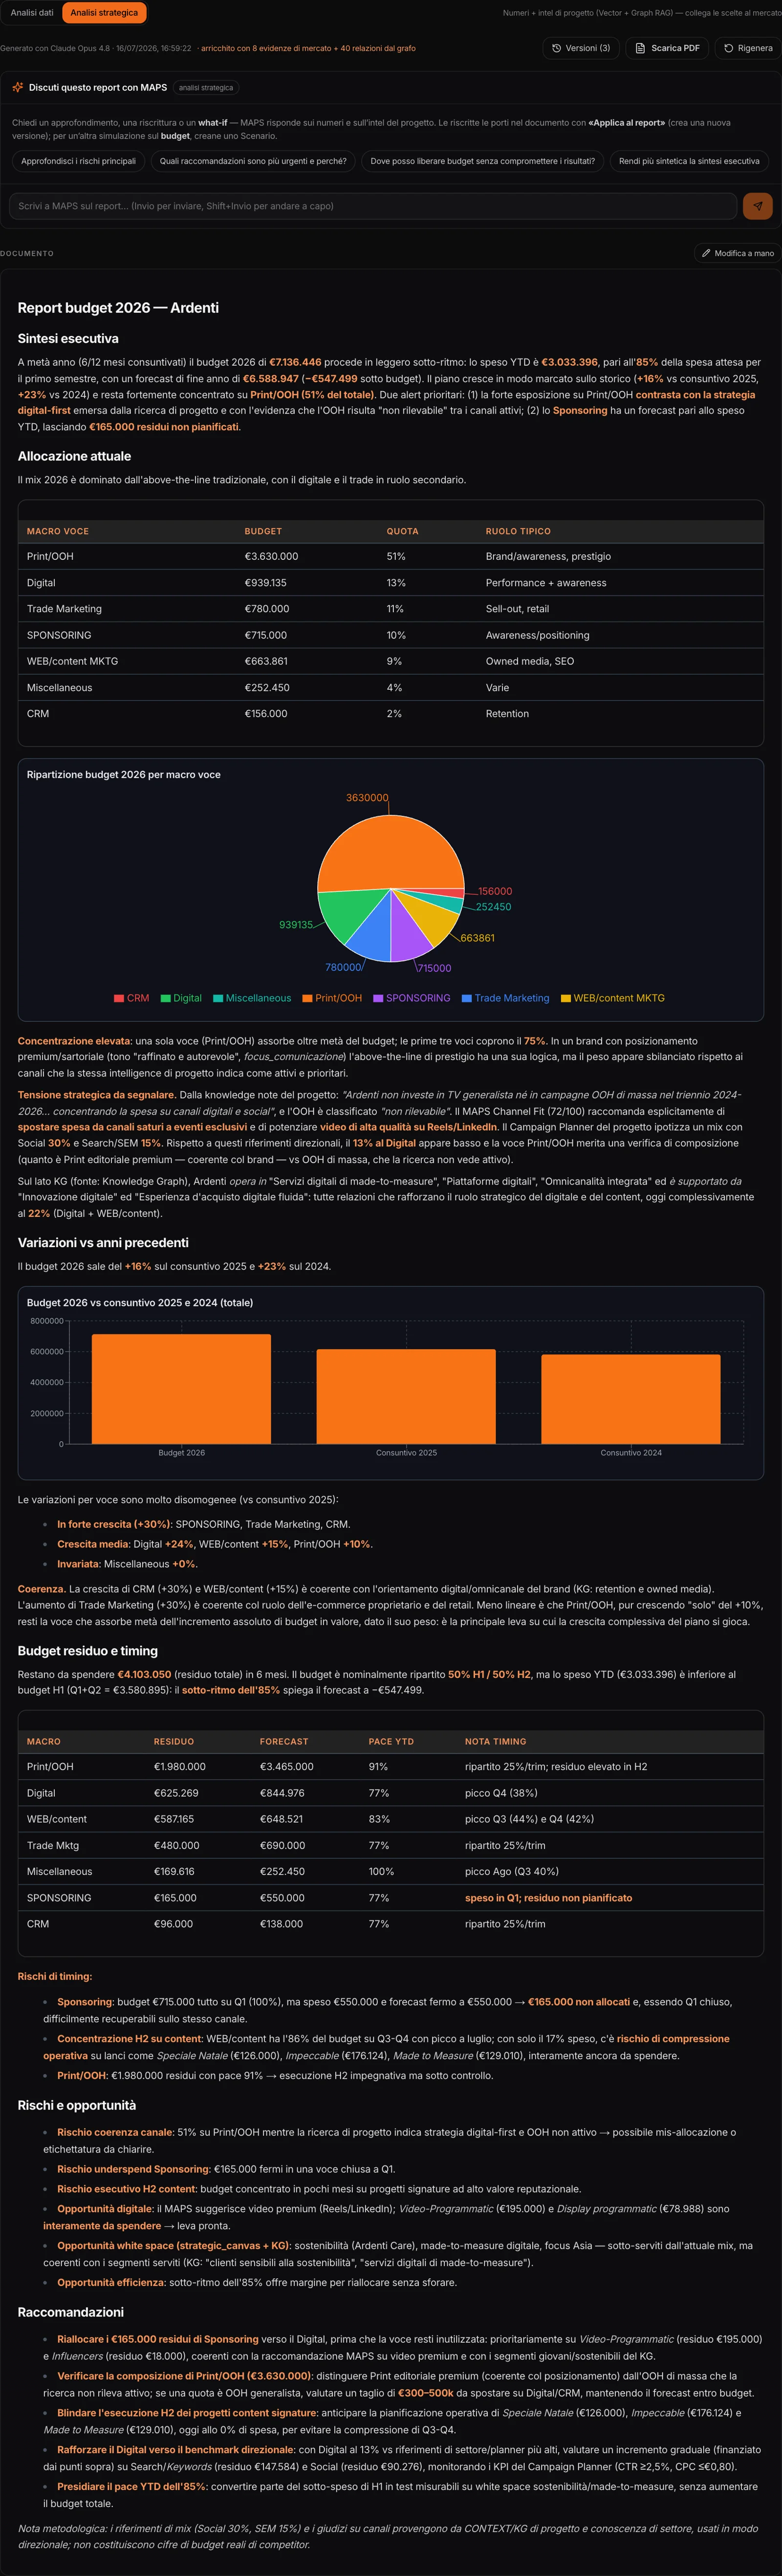
Data analysis: allocation, changes, remaining budget, risks, recommendations — on the numbers alone. Strategic analysis: the same numbers, set against what the project knows about the market and the brand. Here, for example, it notes that print and outdoor account for 51% of the budget while the research describes a brand betting on digital — and flags it as a tension to resolve.
Think it through
A chat about the report: deep dives, rewrites, what-ifs. Whatever convinces you goes into the document with “Apply to report”.
Versions
Every generation, rewrite or manual edit is a new version. Earlier ones can be restored.
The report exports as it is, charts included.
What if…?
One step at a time.
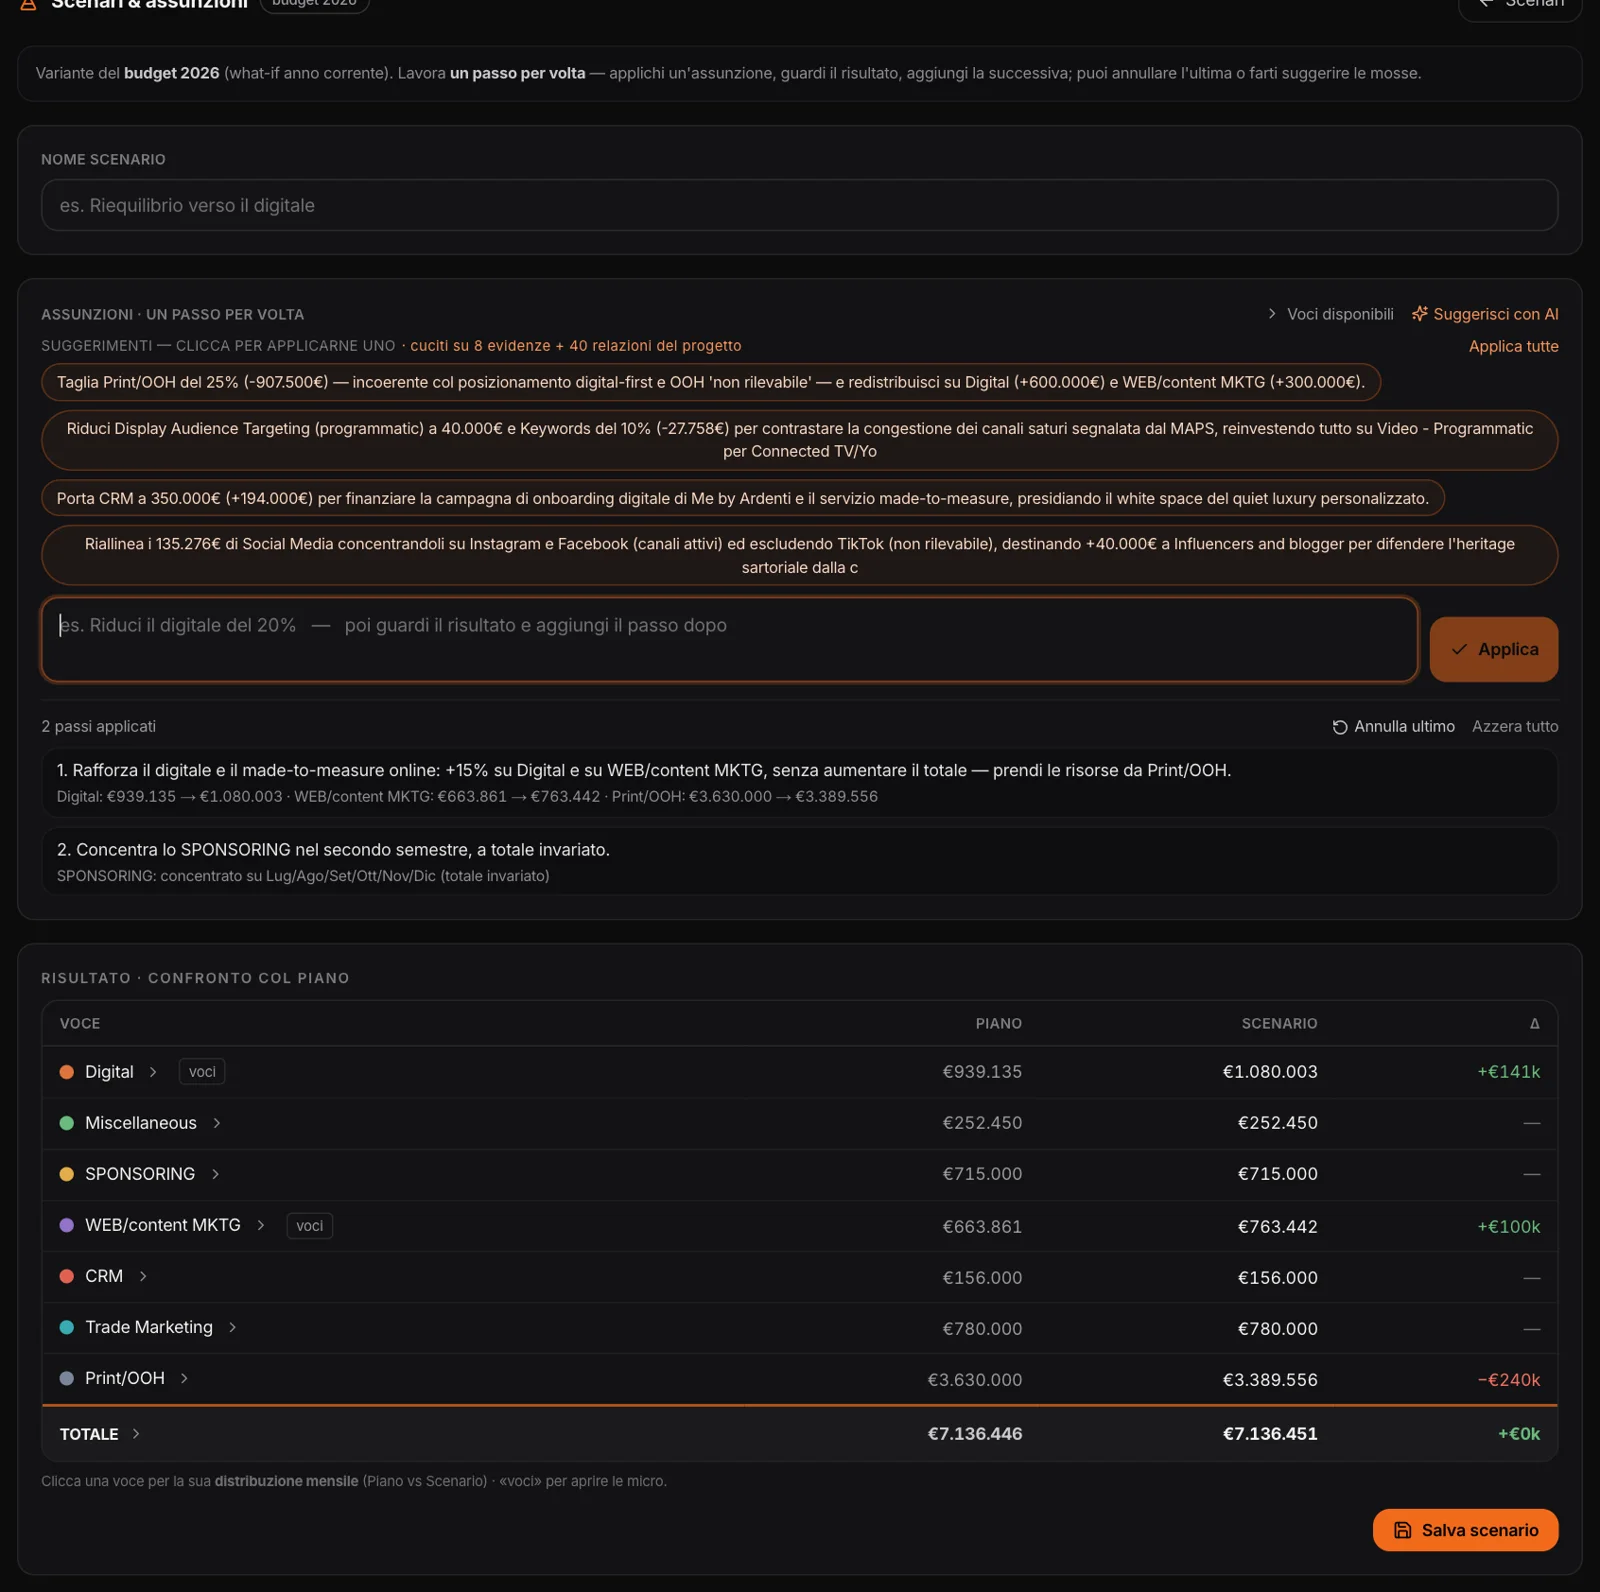
Write the hypothesis in plain words — “boost digital by 15% without raising the total, take it from Print/OOH” — and look at the result. Then add the next step: “concentrate sponsorship in the second half”. The AI translates the words into operations — scale, move, set a total, concentrate in certain months — and the code applies them: the numbers always add up.
Suggest with AI
Four suggested moves, tailored to the project’s market: apply them with one click, one or all of them.
Available items
The list of macro and micro items, so you can write the right name without remembering it.
Undo last
Any step can be removed, or you start over from scratch. The comparison with the plan is always right below.
Does the scenario hold up?
It tells you, even when it doesn’t.
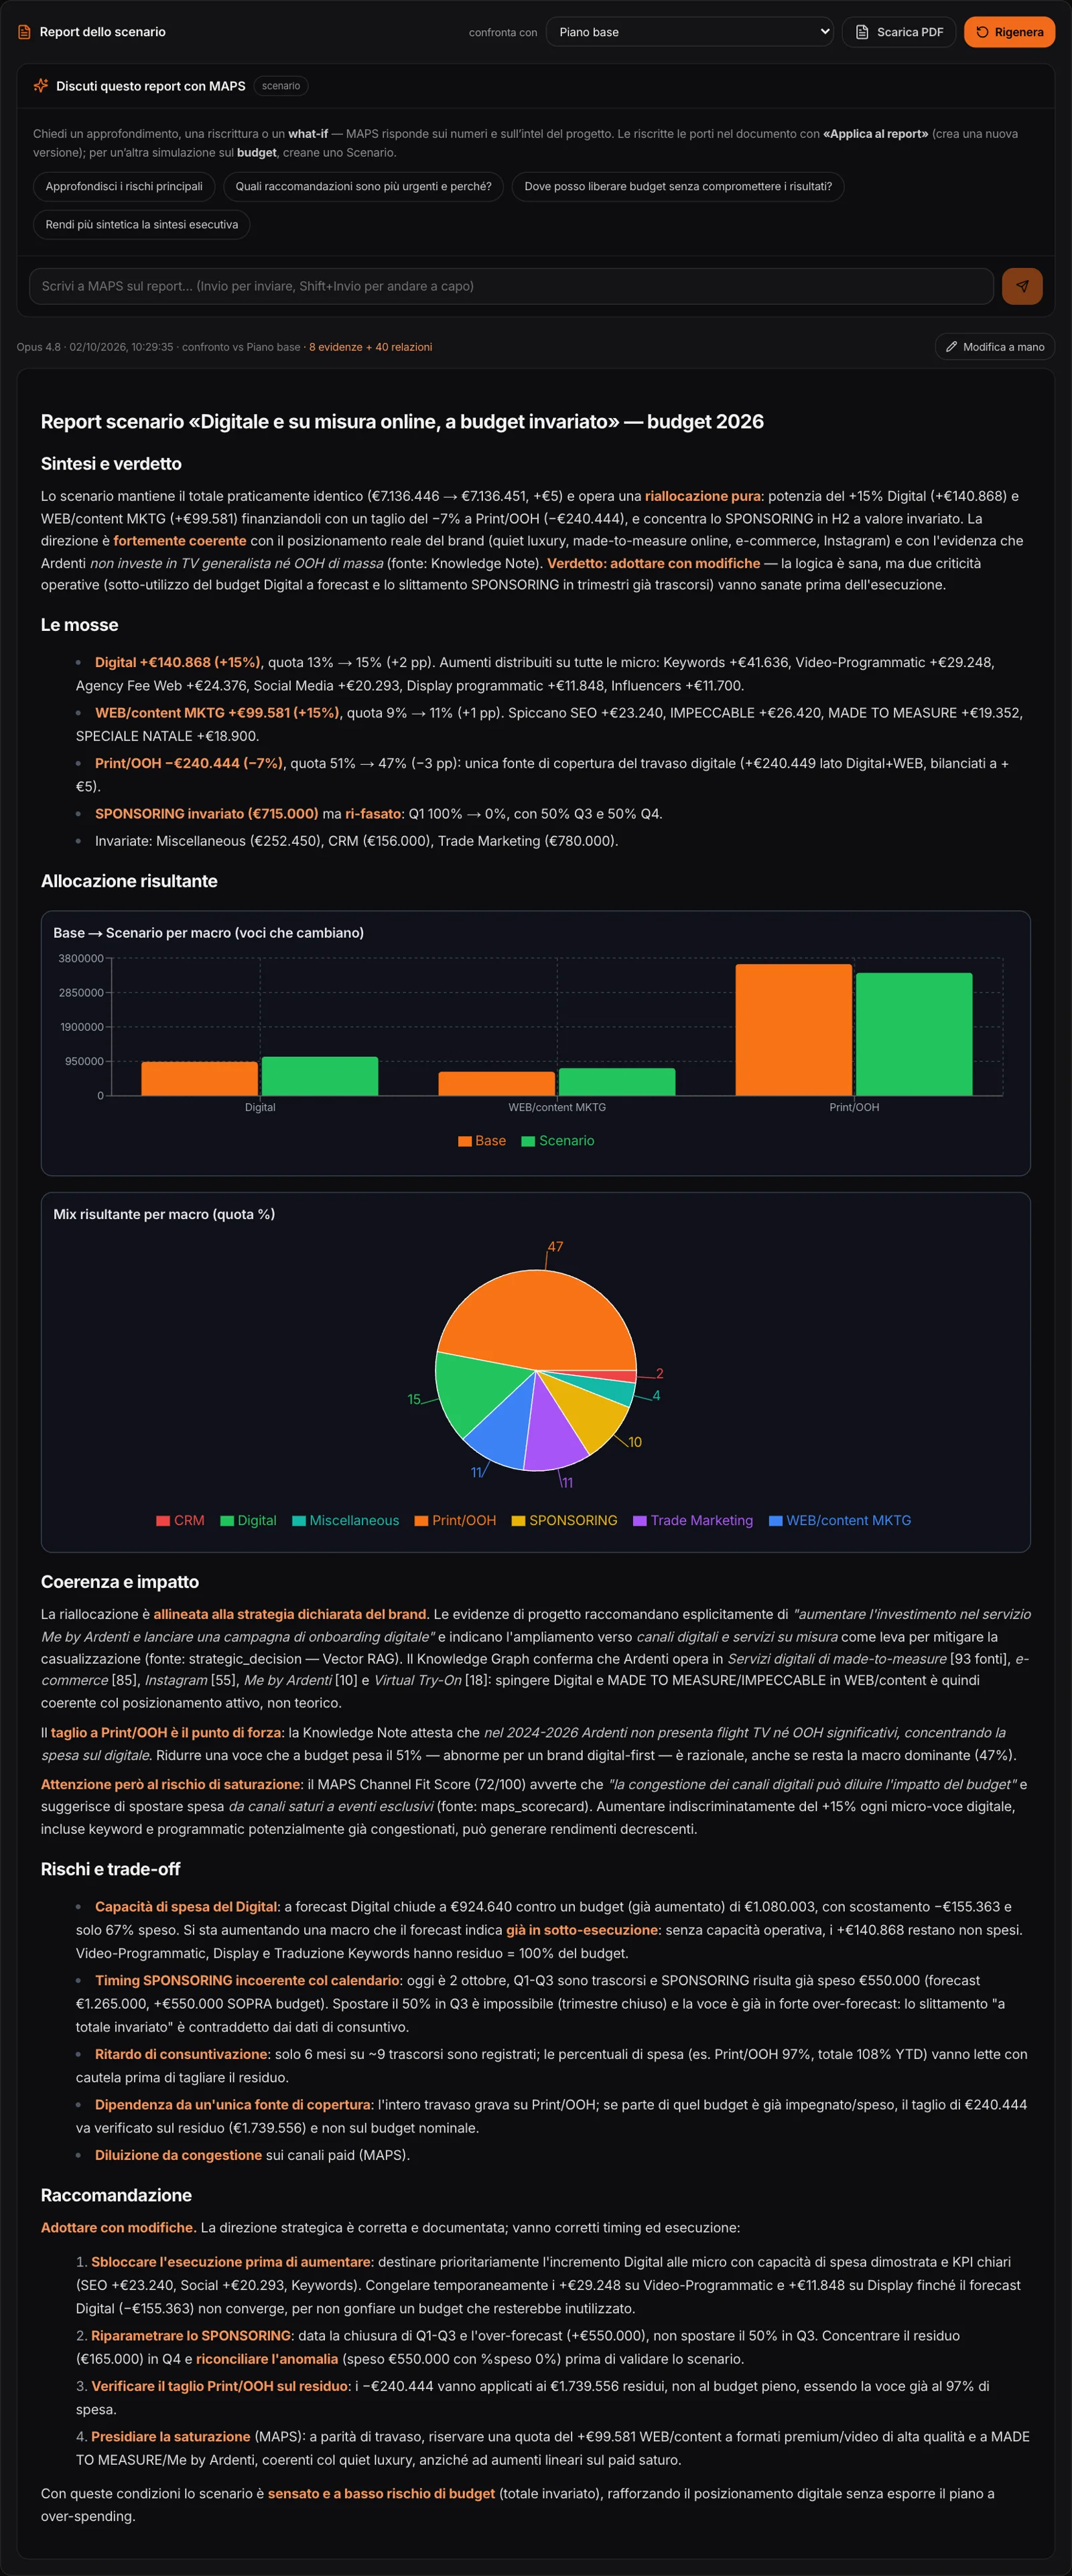
Every scenario has its own report: what changes compared with the plan — or with another scenario —, whether it’s consistent with the market, the risks, and a verdict.
“Adopt with changes. The strategic direction is right and well documented; the timing and execution need fixing. […] Re-scale SPONSORSHIP: given that Q1–Q3 are closed […], do not move 50% into Q3.”The verdict on our scenario, written on October 2
Here too: chat, “Apply to report”, versions, manual editing, PDF.
Plan next year
from this year’s result.
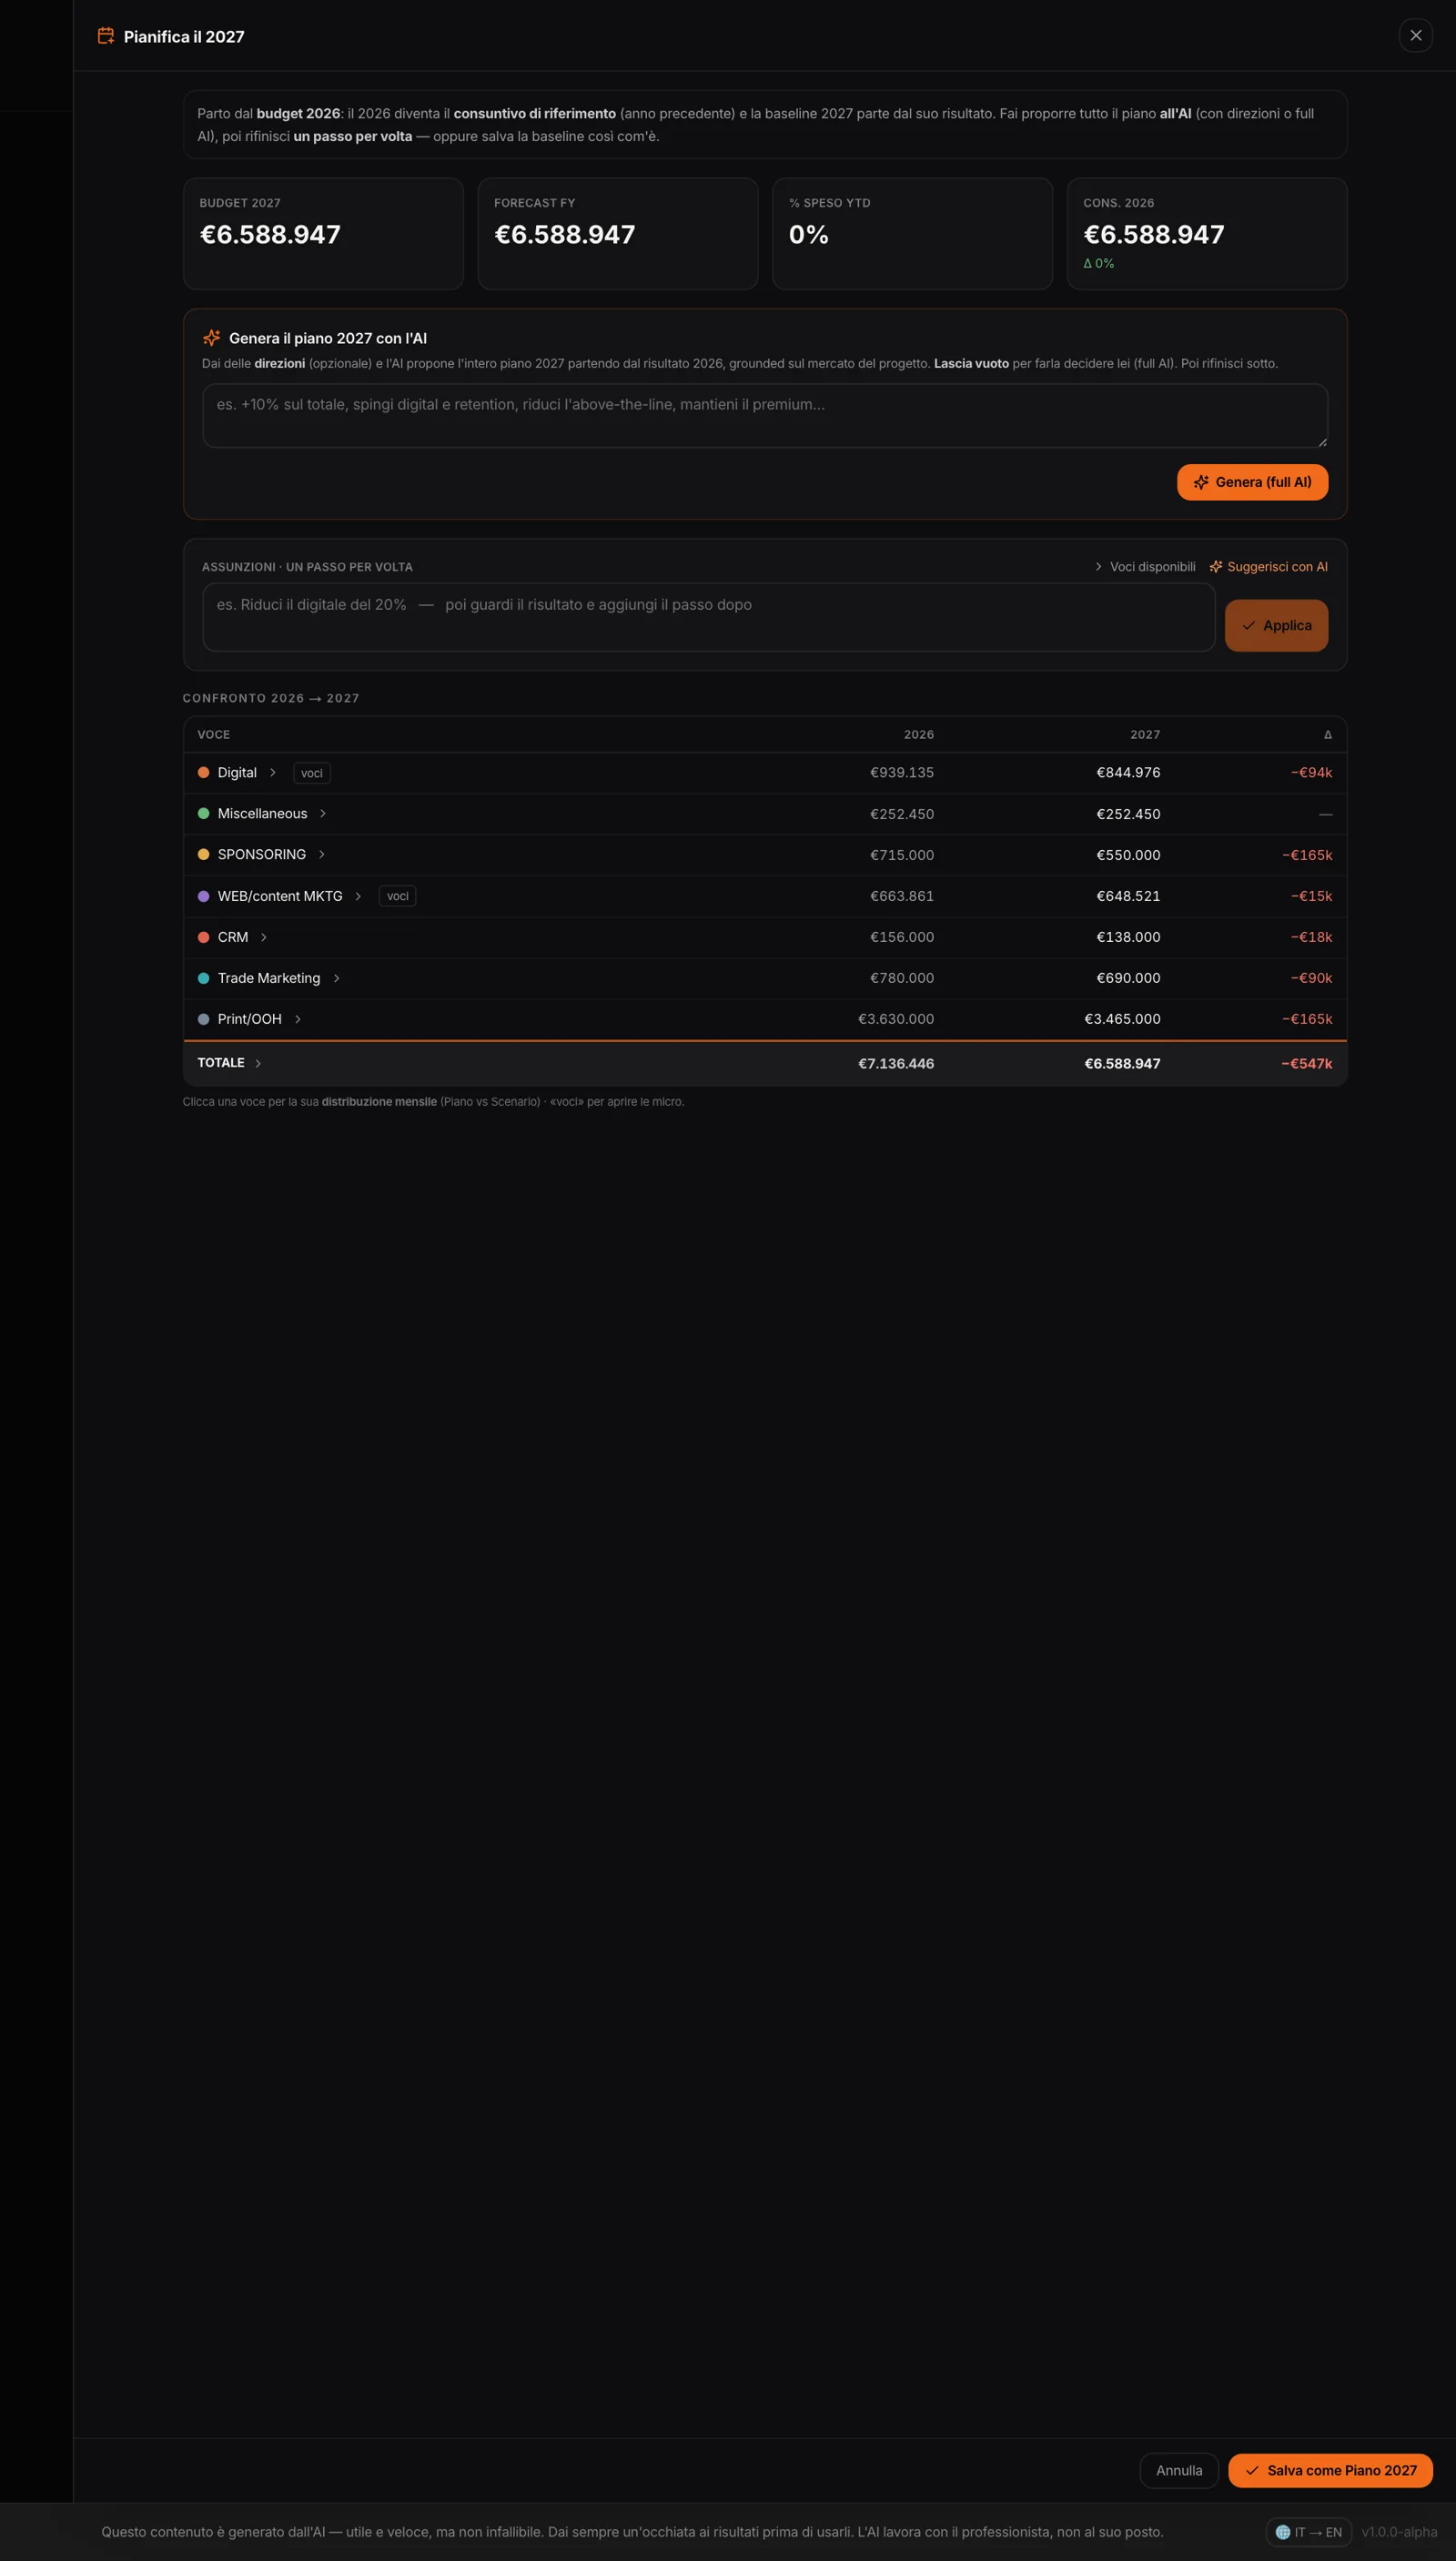
“Plan 2027” starts from how 2026 closes: it becomes the reference actuals, and the new year’s baseline starts from its result. Give the AI your directions — or let it decide — and it proposes the whole plan; then you refine it one step at a time, as with scenarios, and save it as the 2027 Plan.
Every year has its own plan, reports and scenarios: you switch between them at the top, and Free comparison lines them up.
Out of MAPS,
ready to present.
Formatted Excel
Currencies, macro items in bold, micro items indented, subtotals, frozen header: open it and present it.
The budget laid out, macro items only or with the micro-item detail.
The documents
Report, scenario reports, conversations and executive brief, each as a PDF.