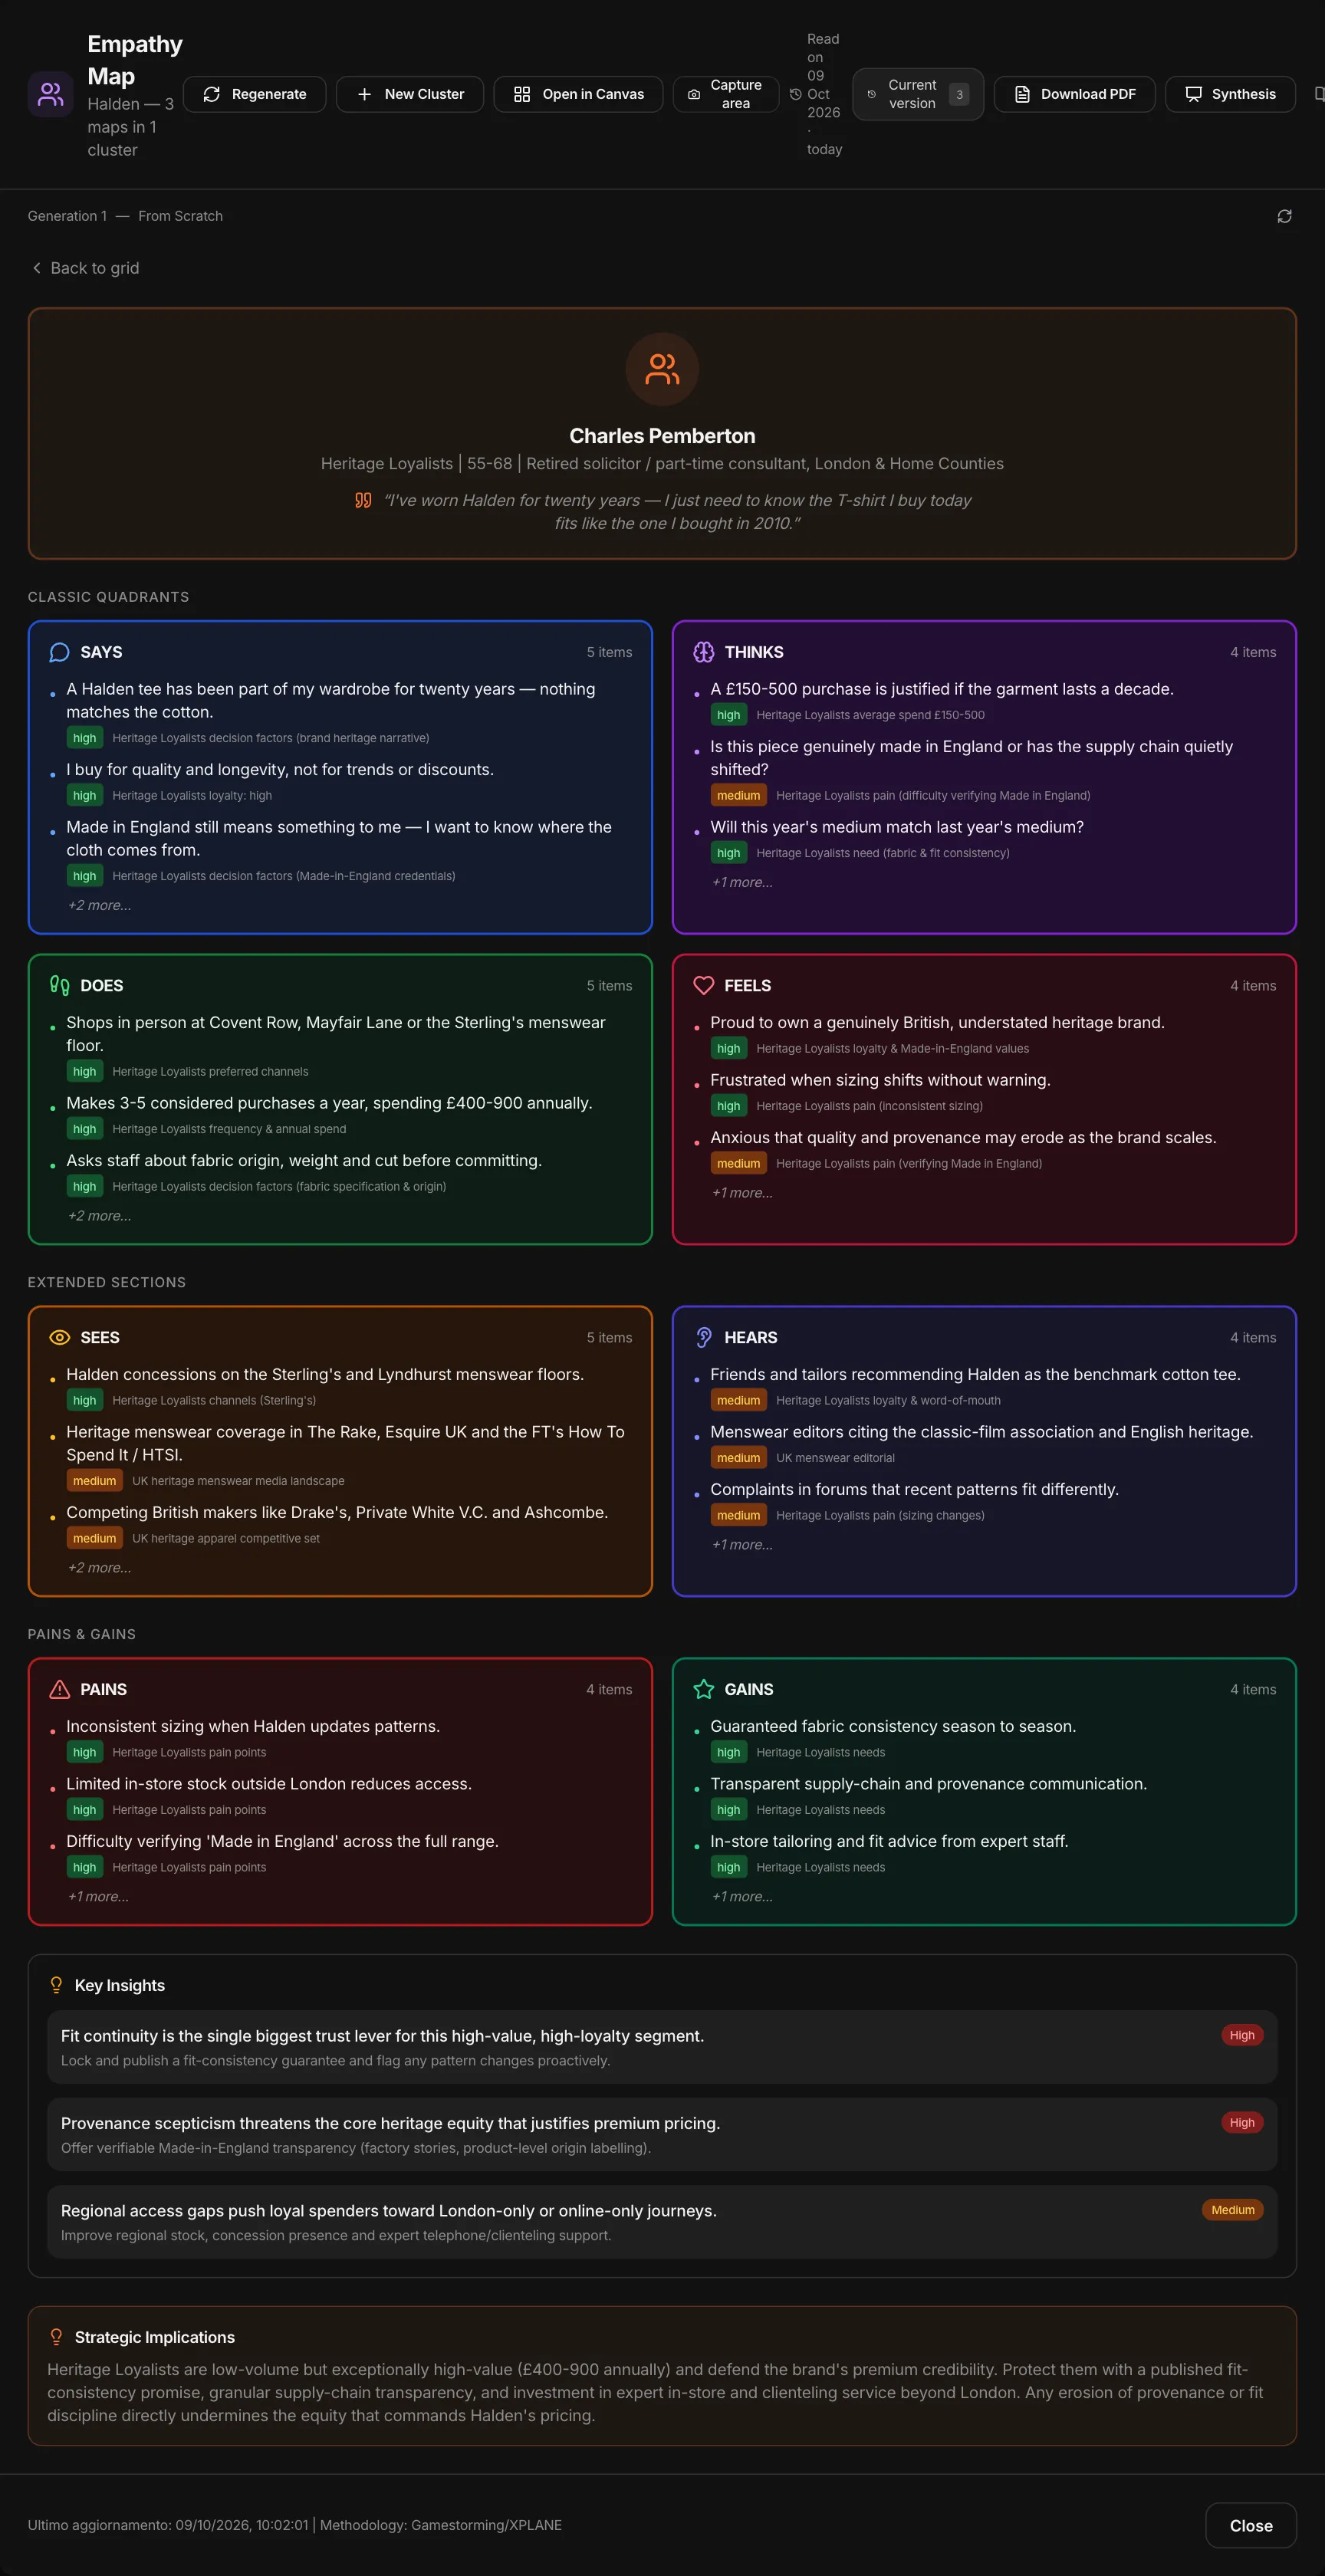
The sections
- Says — what they state in public, in reviews, in an interview.
- Thinks — what goes through their head and they might not say: doubts, expectations, calculations.
- Does — observable behaviors: how they search, compare, buy, use.
- Feels — emotions: anxiety, enthusiasm, embarrassment, trust.
- Sees — the environment: what others do, what the market offers, what they find online.
- Hears — influences: friends, colleagues, experts, creators, the press.
- Frustrations — fears, obstacles, perceived risks.
- Desires — what they’d like to achieve, how they measure success.
The gap between says and thinks, and between says and does, is often the most interesting part: that’s where insights hide.
How to build it
1. Choose who
A map applies to a specific profile, in a specific situation: “someone buying a formal suit for a business event,” not “our customer.”
2. Gather the evidence
Interviews, reviews, social media conversations, support requests, behavioral data. Every item on the map should be able to say where it comes from; anything inferred should be flagged as such.
3. Fill it in, then look for tensions
Once the sections are filled in, look for contradictions: they say quality matters, but only compare prices; they think made-to-measure is for the few, but they want it. Every tension is a potential insight.
4. From insights to implications
For every insight, ask what changes: in the proposition, the message, the channel, the service. A map that leads to no decision is just an exercise.
The most common mistakes
- Writing it at a desk. Without evidence, the map describes the customer the team imagines.
- A profile that’s too generic. The vaguer the profile, the more the sections fill up with clichés.
- Mixing up sections. “Feels” is about emotions, not opinions; “does” is about behaviors, not intentions.
- Stopping once it’s filled in. The value lies in the insights and in what you do next.