MAPS Intelligence
Resources/Strategic Tools
Strategic Tools · 9 min read

Positioning map: how to build it and read it

The brand and its competitors on two perceived axes: how to choose the right axes, find the white spaces and tell whether they’re worth it.

Updated October 6, 2026 · MAPS editorial team
In brief

A positioning map (or perceptual map) places the brand and its competitors on two axes that matter to buyers — for example price and degree of innovation. It shows how the category is perceived, where competitors crowd together and where there are white spaces: open positions that could become an opportunity.

How to build it

1. Choose the axes that matter to the customer

The axes are the most important choice. They must represent criteria that actually drive the choice in the category, and they must be independent of each other: price and perceived quality often move together and produce a diagonal, not a map.

2. Place brands as they’re perceived

What counts is the customer’s perception, not the product sheet. The best sources are research, reviews, conversations, real prices and the way brands communicate.

3. Read clusters and gaps

Crowded areas are where differentiation costs the most. White spaces are hypotheses: they can be an opportunity, or empty for a good reason — nobody wants them.

4. Assess each white space

For each open space, ask: is there demand? Can we be credible there? What does it cost to get there? Can competitors easily follow us?

5. Try different axes

A single map gives a single reading. Changing the axes — tradition vs. innovation, experience vs. convenience — often reveals spaces the first map didn’t show.

An example. In a formalwear category, a price × formality map shows all the premium brands bunched in the “high price, high formality” corner. Switching the axes to “tradition × digital service” reveals an open space: a classic tailoring brand with a made-to-measure service bookable online.

The most common mistakes

  • Correlated axes. If one axis predicts the other, the brands line up along a line and the map says nothing.
  • Axes that matter to the company, not the customer. The map must reflect the buyer’s decision criteria.
  • Positions based on how brands describe themselves. Use perception, not self-declaration.
  • Falling in love with the white space. A gap has to be verified: demand, credibility, cost.
  • A single map. Different axes tell the story of different categories.
How MAPS does it

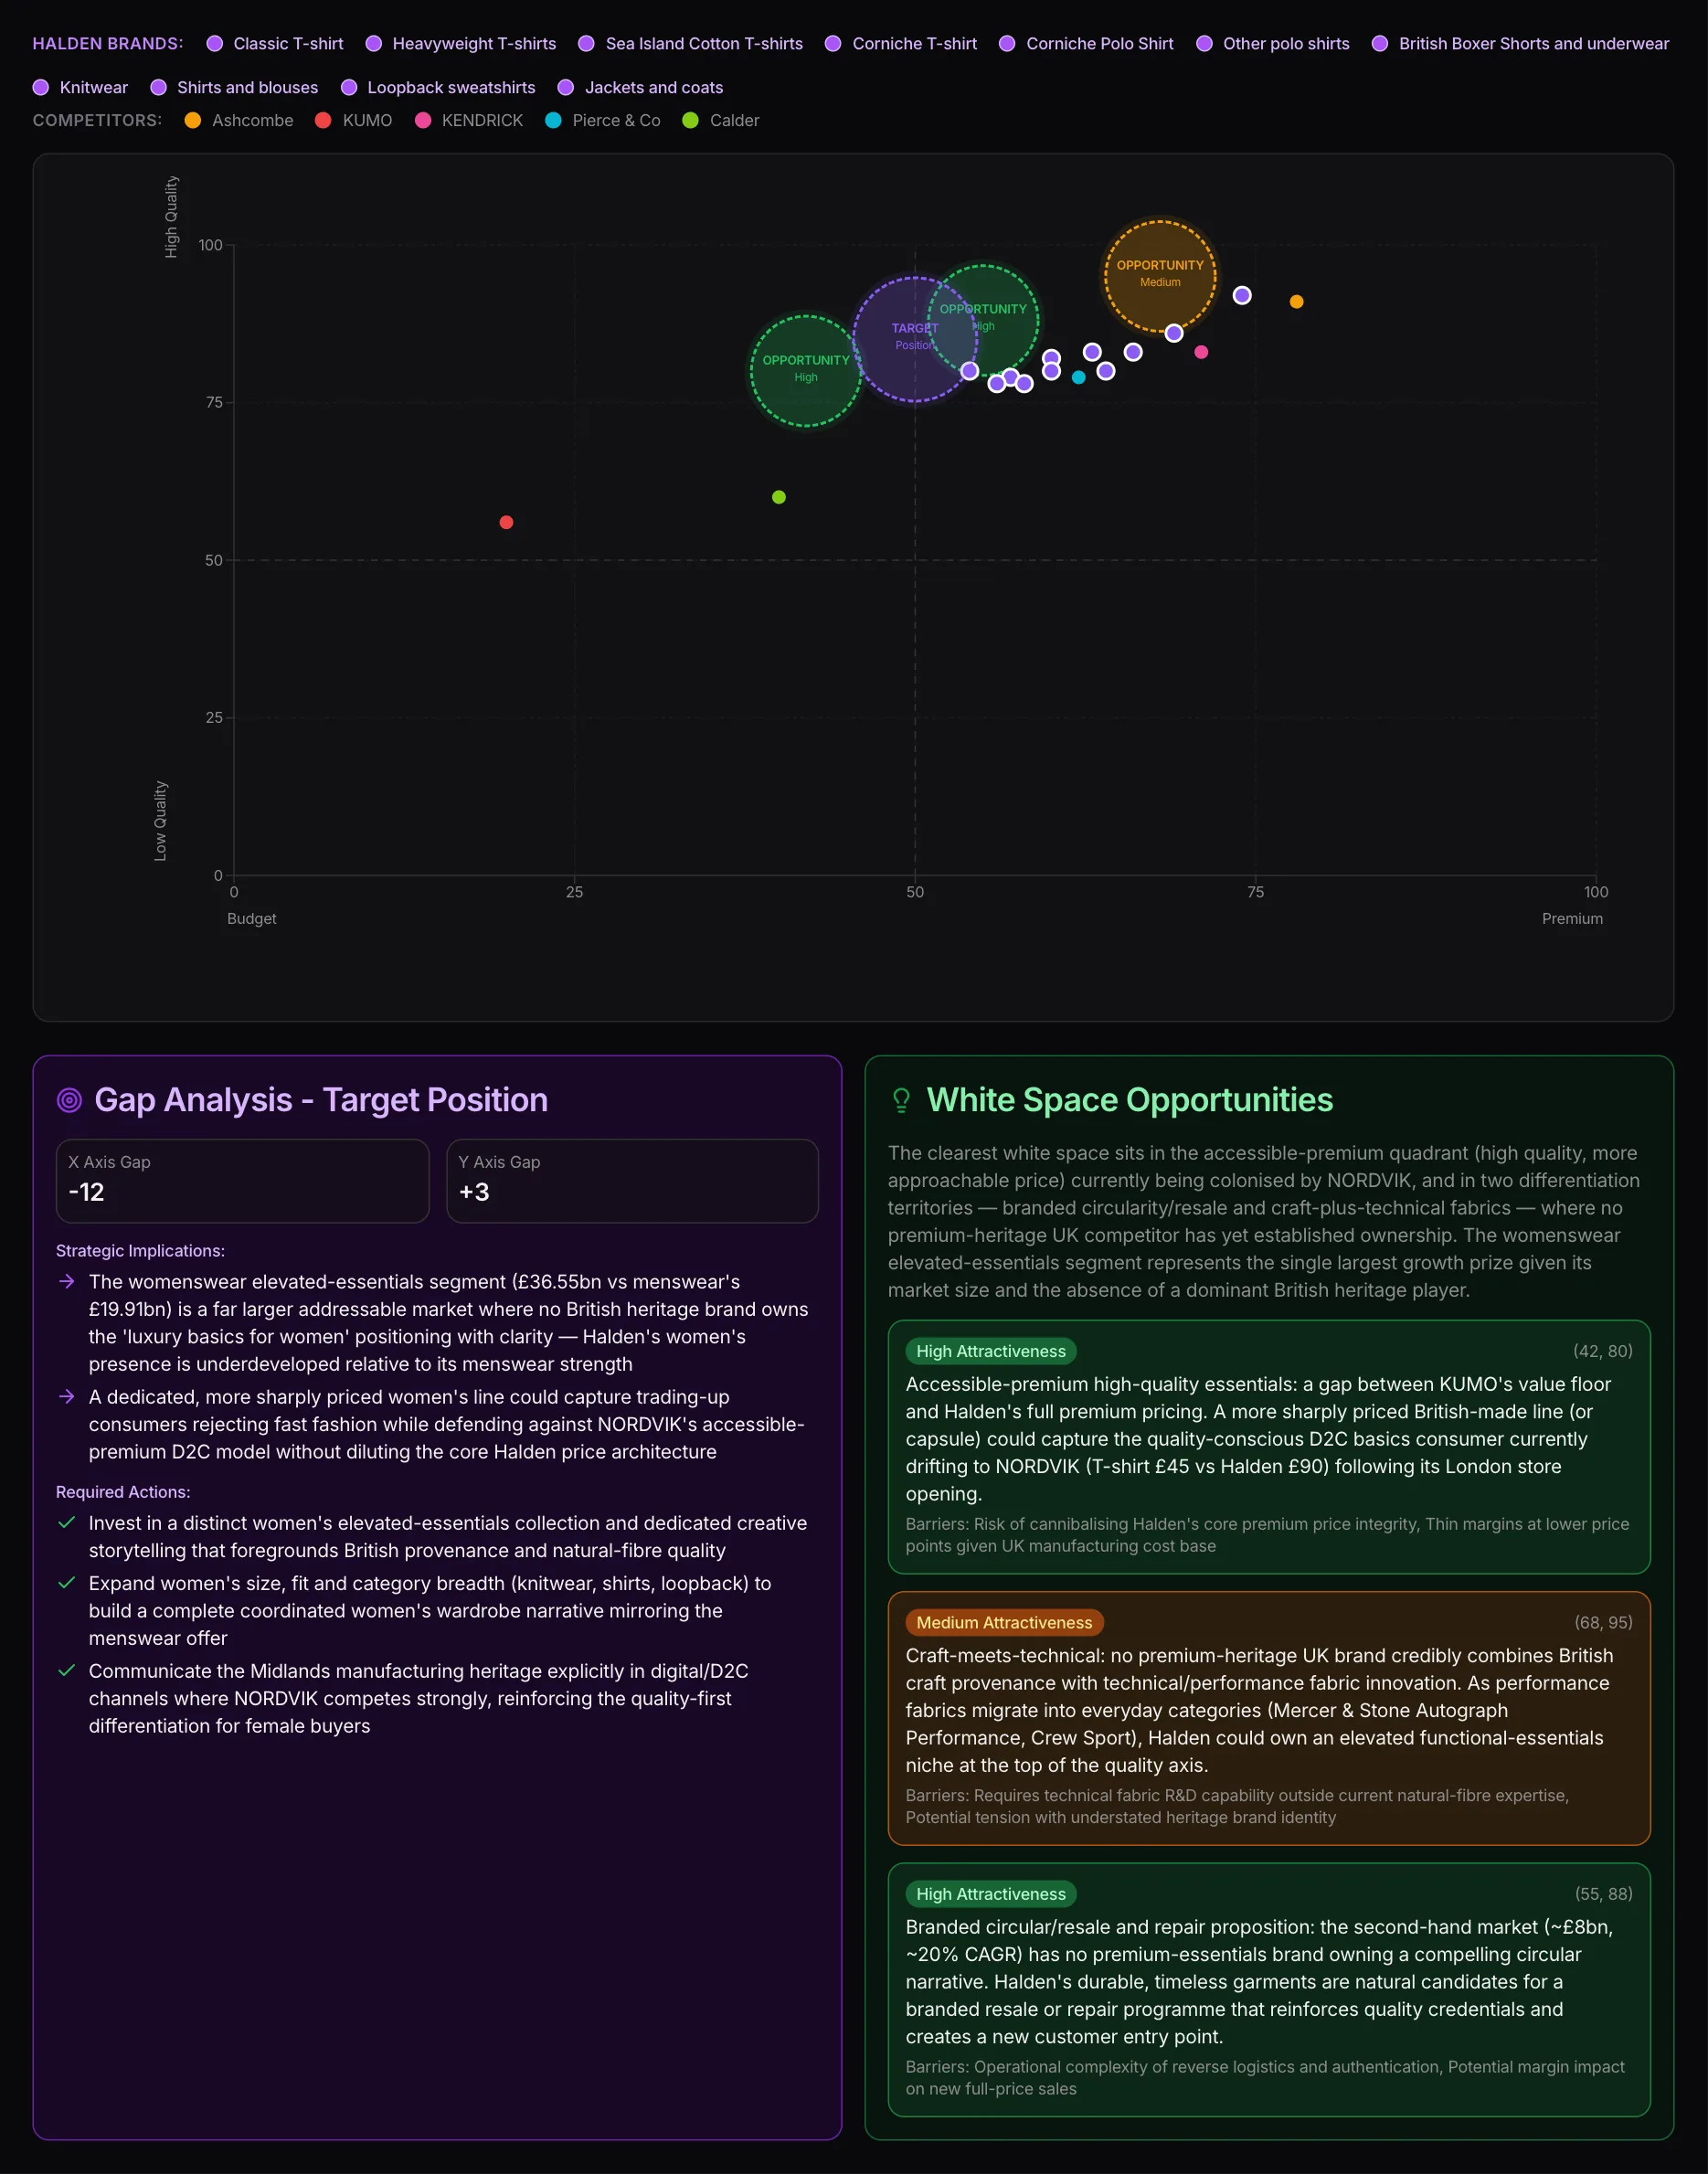
In MAPS the Positioning Map places the brand and its competitors on two axes, with the target position and the white spaces. Below, how far away the target is and what it takes to get there; for each open space, how attractive it is and what makes it hard. You can redo the map with different axes, and test the new positioning with the project’s synthetic users.

The Positioning Map in MAPS: the brand, the competitors, the target position and the white spaces

Frequently asked questions

How do you choose the axes of a positioning map?

Choose two criteria that actually drive the customer’s choice in the category and that aren’t correlated with each other. If two axes move together (as price and perceived quality often do), the map produces a diagonal and shows no spaces.

Is a white space always an opportunity?

No. It may be empty because nobody wants it. It has to be verified: is there demand, can we be credible there, what does it cost to get there, how defensible is it.

What’s the difference between a positioning map and a semiotic square?

The map places brands on two perceived attributes. The semiotic square starts from a tension between values and derives four positions of meaning from it, including the negations: it works at a deeper level and often suggests less obvious positionings.

How often should it be redone?

When the category changes: a new competitor, a repositioning, a price change. Perception moves more slowly than prices, but it does move.

Origin and references

The concept of positioning was made famous by Al Ries and Jack Trout (Positioning: The Battle for Your Mind, 1981). Perceptual maps come from marketing research, with the multidimensional scaling techniques that spread from the 1970s onward.

Written by the MAPS editorial team with the help of AI, checked and reviewed by the team.

Related articles
Methodology·10 min di lettura

Brand positioning: a four-phase process

Understand, choose, test, activate: how to arrive at a defensible positioning, capture it in one sentence and turn it into concrete choices.

Read →
Strategic Tools·9 min di lettura

The semiotic square in marketing: what it is and how to use it

Greimas’s tool, brought into marketing by Floch: how to build it from an underlying tension, read the four positions and find the open spaces in a category.

Read →
Strategic Tools·9 min di lettura

SWOT analysis and the TOWS matrix: how to do it right

Strengths, weaknesses, opportunities and threats: how to gather them with evidence, tell internal from external, and turn the SWOT into action with the TOWS matrix.

Read →