
MAPS Intelligence
Resources/Data & Measurement
Data & Measurement · 10 min read

Scanner data: reading sell-out, share, distribution and rate of sale

Retail panel exports explained: value and volume sales, share, weighted and numeric distribution, rate of sale, price and promotion — and how to understand why share moves.

Updated October 6, 2026 · MAPS editorial team
In brief

Scanner data are the sales recorded at store checkouts and collected by retail panels such as Nielsen, Circana (formerly IRI) or GfK. They measure sell-out — what the consumer buys — in value and volume, and from that market share, weighted and numeric distribution, rate of sale, price and promotional pressure. Read together, they tell you not just how much you sell, but why share is moving.

The metrics, one by one

  • Value and volume sales — how much revenue comes in and how many units (or kilos, liters) are sold. If value grows faster than volume, the average price is rising.
  • Market share — your sales as a share of the category total, in value or volume.
  • Numeric distribution — in how many stores out of a hundred the product is present.
  • Weighted distribution — the same presence, but weighted by how much those stores sell in the category. Being in a few large stores can be worth more than being in many small ones.
  • Rate of sale — how much the product sells where it’s present: sales per store, or per point of weighted distribution. It measures the product’s strength on the shelf.
  • Price and price index — the average price, and its ratio to the category average.
  • Promotional pressure — what share of sales happens on promotion.
  • SKUs — how many different products you have on the shelf.

Why share moves

The most useful question is the decomposition of the change in share. Simplifying: sales depend on where you are (distribution) and how much you sell where you are (rate of sale), within a market that’s growing or shrinking. If share rises because you got into new stores but rate of sale falls, the gain may not last. If share falls with distribution stable, the problem is on the shelf: price, promotions, product.

How to read an export

1. The market, before you

Category value and volume, how many brands, how concentrated it is: the share of the top three and the top five.

2. Your position, against the year before

Rank, sales, share, weighted distribution, sales per store, price, promotion, SKUs. Always compared with the same period of the previous year, to strip out seasonality.

3. Competitors and segments

Who went up, who went down, and in which segments of the category. A flat category can hide a fast-growing segment.

4. The drivers

Price tiers, distribution and rate of sale, promotions (with before and after), SKUs. And the decomposition of the change in share, brand by brand.

5. Channel by channel

Hypermarkets, supermarkets, discounters and specialists have different dynamics: the same brand can grow in one and lose in another.

An example. “Croccalì,” a fictional dog-treat brand, gains a point of share. The decomposition shows it all comes from distribution — new listings in one retail chain — while rate of sale has dropped. With promotions on the rise, the signal is clear: the new stores brought in sales, but on the shelf the product is selling less than before.

The most common mistakes

  • Looking only at share. Without distribution and rate of sale, you don’t know why it moves.
  • Confusing numeric and weighted distribution. The second tells you how much your presence really weighs.
  • Reading value without volume. Value growth can be price alone.
  • Ignoring promotions. Sales inflated by a promotion are often “given back” in the following weeks.
  • A single channel. The total can hide opposite trends.
How MAPS does it

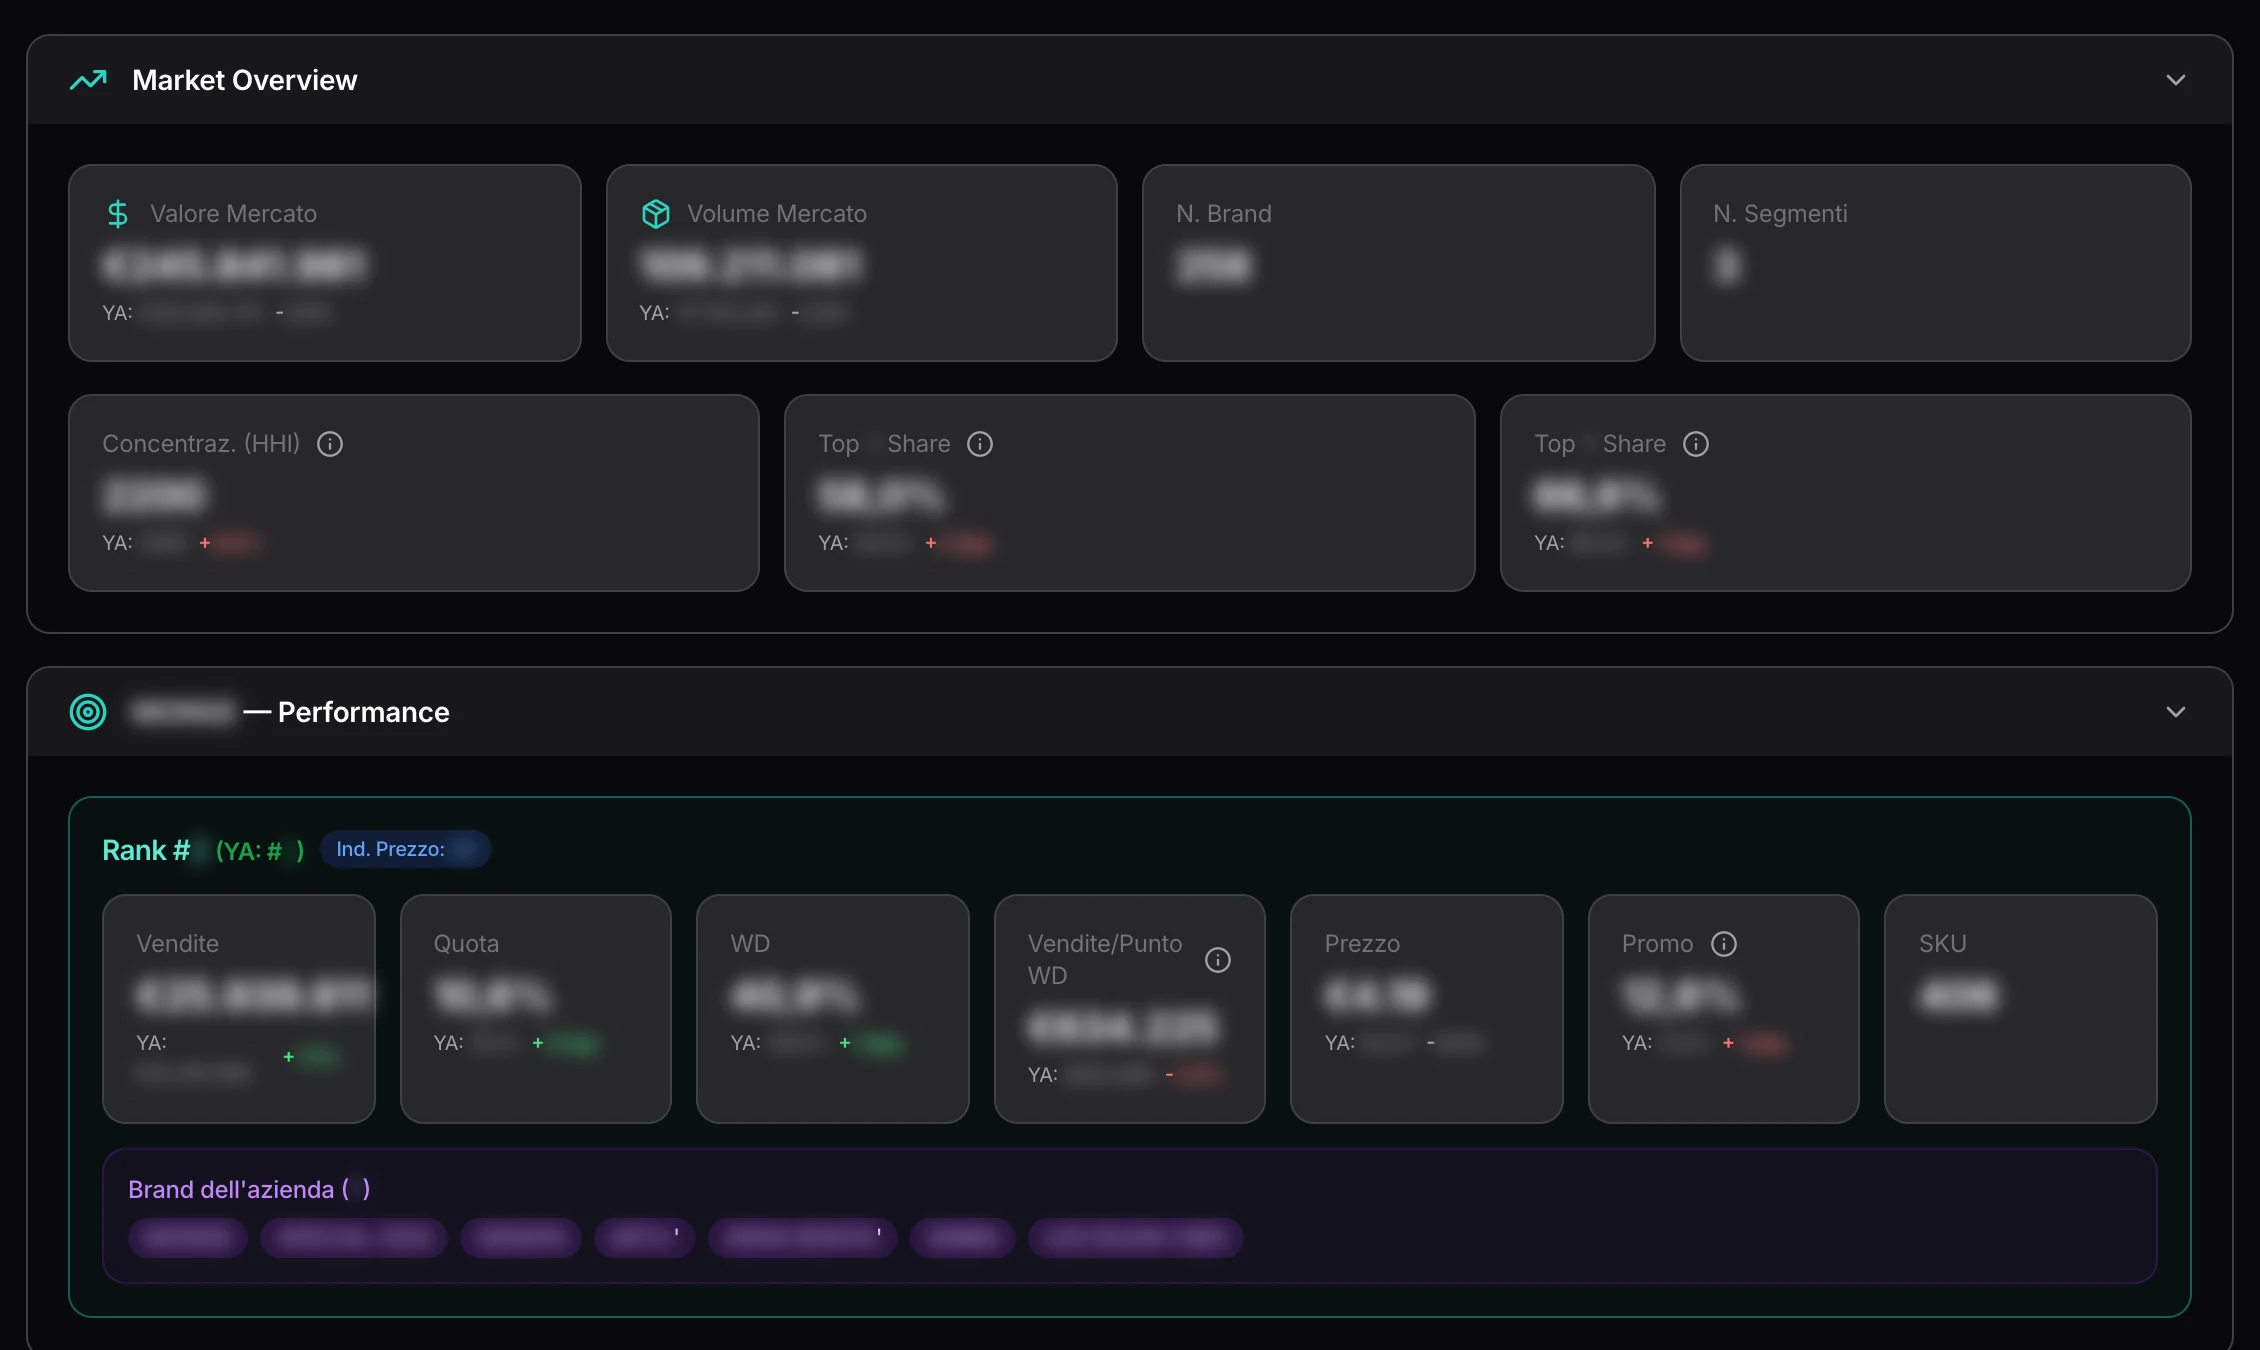
In MAPS, the Scanner Data Analyzer reads panel exports — Nielsen, Circana, GfK —, in Excel or CSV, exactly as they come out, at market, channel or retailer level. It recognizes the columns on its own — brand, value and volume sales, shares, weighted and numeric distribution, price, promotion, segment — and compares with the year before. You choose the company to track and add channels one at a time. The dashboard shows the market (value, volume, concentration, share of the top three and five) and your performance; the competitor ranking and the segments. The drill-down analyzes price tiers, distribution and rate of sale, promotions, SKUs, and decomposes the change in share into distribution, rate of sale and market, brand by brand. AI Insights write up the reading; the chat turns your question into a calculation on the data, and when the data isn’t enough, it says so. It’s available only in consumer projects.

The market overview and the company’s performance, compared with the previous year

Frequently asked questions

What’s the difference between numeric and weighted distribution?

Numeric distribution counts in how many stores out of a hundred the product is present; weighted distribution weights those stores by how much they sell in the category. Weighted distribution tells you how much of potential demand you can reach.

What is rate of sale?

How much a product sells in the stores where it’s present, for example sales per store or per point of weighted distribution. It measures the product’s strength on the shelf, separately from its presence.

What are sell-in and sell-out?

Sell-in is what the manufacturer sells to the retailer; sell-out is what the retailer sells to the consumer. Scanner data measure sell-out.

Why can share rise while things are going badly?

Because it can grow purely through new distribution or more promotions while rate of sale falls: a gain that may not last.

Written by the MAPS editorial team with the help of AI, checked and reviewed by the team.

Related articles
Strategic Tools·9 min di lettura

Market analysis: size, growth, segments

How much a market is worth, how it grows, how it breaks down and where the opportunities are: the method, TAM, SAM and SOM reasoning, and how not to be fooled by the numbers.

Read →
Practical Guides·8 min di lettura

Retail: reading the catchment area, competing banners and store customers

For retailers: how to read a market made of stores, assortment and perceived price, and why your competitors are the other banners in your catchment area.

Read →
Data & Measurement·9 min di lettura

Media planning: media mix, seasonality and category benchmarks

How to spread an advertising budget across media and months, starting from what your category does: competitor spend, open windows, objectives and scenarios.

Read →