
MAPS Intelligence
Resources/Strategic Tools
Strategic Tools · 9 min read

Market analysis: size, growth, segments

How much a market is worth, how it grows, how it breaks down and where the opportunities are: the method, TAM, SAM and SOM reasoning, and how not to be fooled by the numbers.

Updated October 6, 2026 · MAPS editorial team
In brief

A market analysis describes a market a company operates in or wants to enter: how much it’s worth (size), how it’s changing (growth and stage), how it breaks down (segments by product and by customer), who holds it, and which trends, channels, opportunities and threats run through it. Its job is to decide where to play, before deciding how.

What a market analysis contains

  • Size — how much the market is worth, in value and, if needed, in volume, for a defined area and period.
  • Growth and stage — whether the market is growing, flat or shrinking, and where it sits in its life cycle: emerging, developing, mature, declining.
  • Segments — how it breaks down: by product type, customer type, usage occasion, price tier. With the brands that hold each segment.
  • Trends and channels — what’s changing in demand and where people buy.
  • Opportunities and threats — what in the market can help or hurt you, with how much it weighs and how likely it is.
  • Key success factors — what you need to be good at to win in that market.

TAM, SAM and SOM: three different measures

When talking about size, it pays to separate three concentric circles. The TAM (total addressable market) is the whole market for that need. The SAM (serviceable available market) is the part you can actually serve with your product, your channels, your geography. The SOM (serviceable obtainable market) is the share you can realistically win within a defined horizon, given competitors and resources.

The TAM looks impressive in a deck, but decisions are made on the SAM and the SOM. A huge market in which you can serve a small niche is, for you, a small market.

How to do it

1. Set the boundaries

Which need, which products, which area, which period. “The apparel market” is too broad to decide anything; “made-to-measure menswear in Italy” can be measured and discussed.

2. Estimate size from more than one direction

Top-down: start from an industry figure and narrow it. Bottom-up: number of potential customers × purchases per year × average price. If the two estimates are far apart, one of the assumptions is wrong: find it before you go further.

3. Break it into segments and see who’s there

For each segment: how much it weighs, how it’s growing, which brands hold it. This is where crowded and neglected segments become visible. For a detailed comparison with competitors, the competitive map by arena is the next step.

4. Read the forces that move it

Demand trends, growing channels, changing rules. Separate opportunities from threats and give each a weight: impact and probability. This material feeds straight into the SWOT analysis.

5. State what you don’t know

Many market figures aren’t public, or are only available for broader categories. Writing “data not available” beats eyeballing an estimate and presenting it as fact: the reader needs to know how far to trust it.

An example. “Filo Nobile,” a small made-to-measure shirt brand, looks at the Italian men’s shirt market. The TAM covers all men’s shirts sold; the SAM only the premium tier, sold online and in a few cities where it has ateliers; the SOM is the share of that tier it can reach in three years with its budget. Breaking the market into segments, it finds the “ceremony” segment is held by many brands, while “work travel” has few players: that’s where it focuses the next round of analysis.

The most common mistakes

  • Confusing TAM with the reachable market. A big TAM says nothing about how much you can sell.
  • One number, one source. Without a cross-check, an order-of-magnitude error goes unnoticed.
  • Segments built on the product, not the customer. You need both: needs don’t line up with product lines.
  • Numbers made up to fill the gaps. A missing figure that’s declared is more useful than a plausible false one.
  • An analysis done once and never again. Markets change; the analysis has to be redone when they do.
How MAPS does it

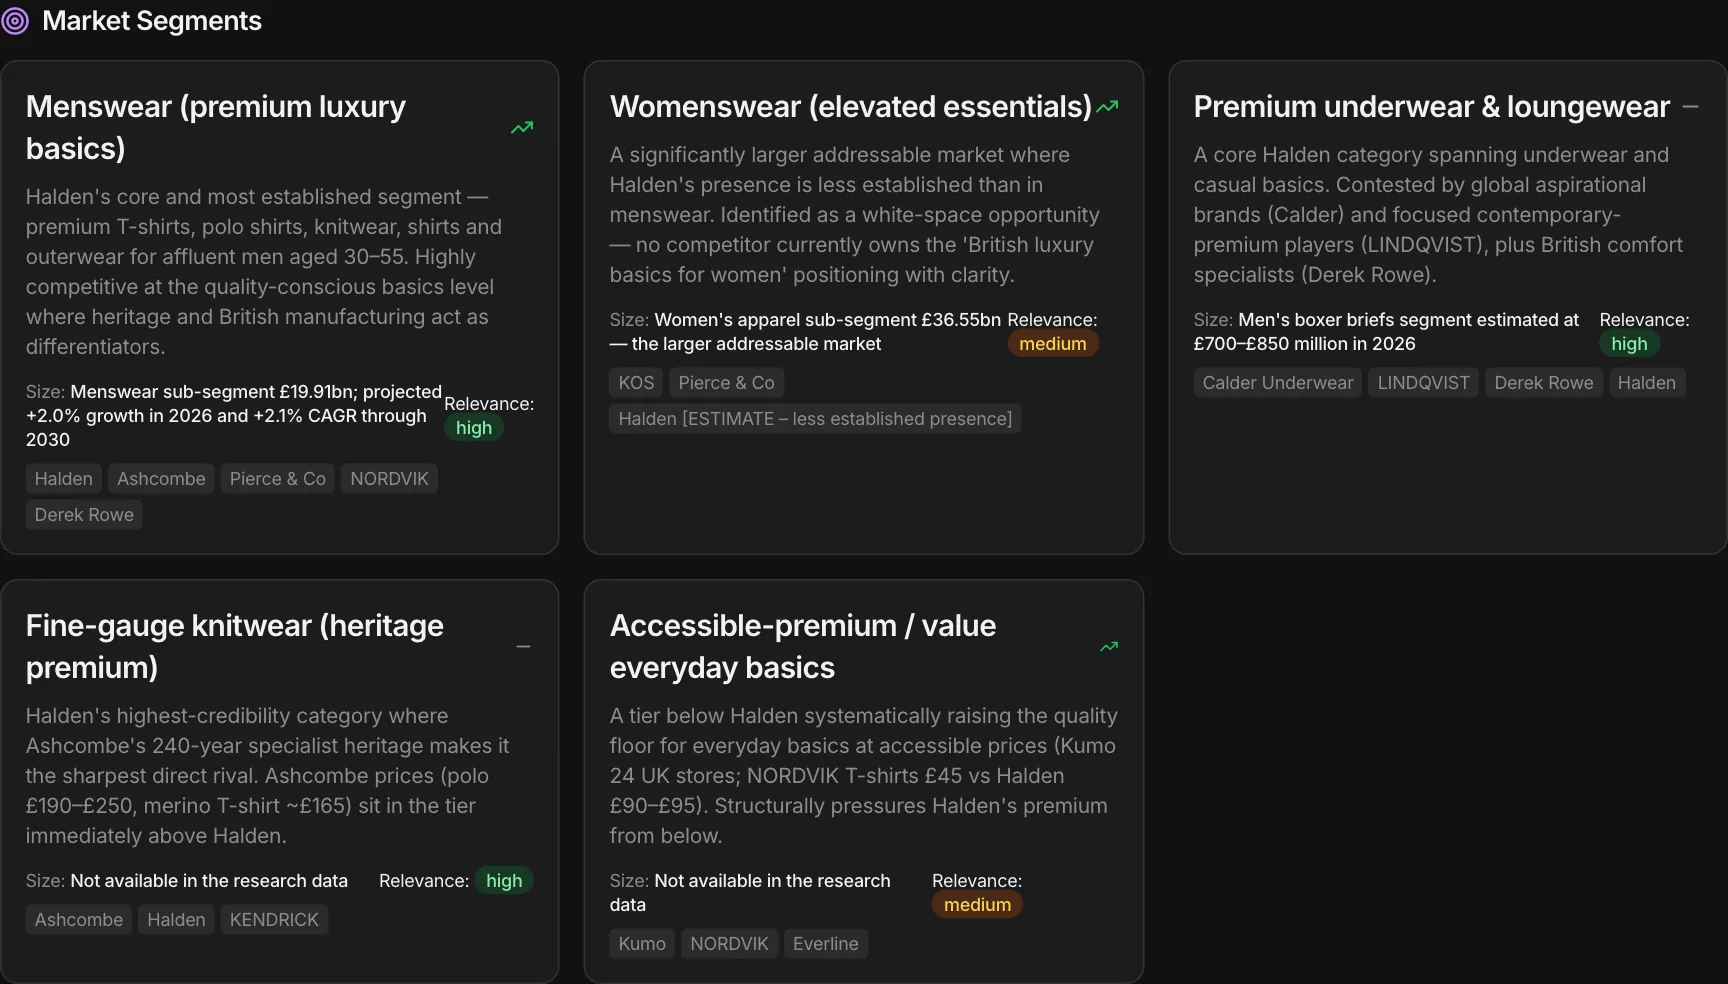
In MAPS, Market Analysis is one of the four tools in Market and Competition Analysis, and it’s built from what the project already knows. It puts market size, growth and stage on one page; the segments, by product and by customer, with the brands that hold them; trends, channels, opportunities and threats with impact and probability, and the key success factors. And when a number isn’t there, it says so: “the specific value of the segment is not available in the research data.” You regenerate it when the market changes, with previous versions kept in the history; it goes into the project’s memory, where the chat and the downstream tools use it; and it exports to PDF or to the Canvas.

Market segments, by product and by customer, with the brands present

Frequently asked questions

What’s the difference between TAM, SAM and SOM?

The TAM is the whole market for that need; the SAM is the part you can serve with your product, channels and geography; the SOM is the share you can realistically win in a defined period.

How do you estimate market size without official data?

From two independent directions: top-down, narrowing a broader industry figure; bottom-up, multiplying potential customers, purchase frequency and average price. If the estimates diverge widely, one assumption needs rechecking.

Are market analysis and market research the same thing?

No. Research gathers the data (sources, interviews, surveys); analysis organizes it to answer business questions: how much the market is worth, how it breaks down, where it makes sense to play.

How often should it be updated?

When the market changes visibly — a new competitor, a growing channel, a new regulation — and in any case before major decisions, such as a launch or an annual plan.

Written by the MAPS editorial team with the help of AI, checked and reviewed by the team.

Related articles
Strategic Tools·9 min di lettura

Competitive map: competitors split into arenas

You don’t compete with everyone the same way: how to divide the market into arenas, see who leads and who follows in each, and find the needs nobody serves well.

Read →
Strategic Tools·9 min di lettura

SWOT analysis and the TOWS matrix: how to do it right

Strengths, weaknesses, opportunities and threats: how to gather them with evidence, tell internal from external, and turn the SWOT into action with the TOWS matrix.

Read →
Methodology·9 min di lettura

Market research with AI: speed without losing depth

What AI does well in market research, where it goes wrong, and the rules for using it without being fooled: sources, dates, the market’s language, estimates flagged as estimates.

Read →