
MAPS Intelligence
Resources/Data & Measurement
Data & Measurement · 10 min read

Customer segmentation from the CRM: RFM analysis and clusters

How recently, how often, how much: how RFM analysis and clustering find the customer groups that really exist, who you’re losing, and what to do with each.

Updated October 6, 2026 · MAPS editorial team
In brief

Customer segmentation from the CRM groups customers by how they actually behave. The most common foundation is RFM analysis: Recency (how long ago they bought), Frequency (how often), Monetary (how much they spend). Clustering goes a step further: it finds the groups that emerge from the data instead of cutting them at fixed thresholds, and lets you say, for each one, who you’re losing and what to do.

RFM analysis

  • Recency — days since the last purchase. Often the strongest signal: someone who bought recently is more likely to buy again.
  • Frequency — number of purchases in a period.
  • Monetary — amount spent in the period.

The classic approach is to give each customer a 1-to-5 score on each dimension (for example by quintiles) and combine the three scores: a 5-5-5 is a recent, frequent, high-value customer; a 1-4-5 is a customer who used to be worth a lot and has stopped, the first to win back.

From RFM to clustering

RFM is simple and readable, but the thresholds are set a priori. Clustering (for example with the k-means algorithm) uses the same variables — and others, such as average order value and channels used — to find the groups the data shows. The hard question is how many groups to make: too many is noise, too few hides differences. And sometimes the honest answer is that the customer base is homogeneous.

How to do it

1. Prepare the data

One customer per row, with purchase dates and amounts; better still, the orders file, one row per purchase. Merge customers who appear in more than one channel, or you’ll count them twice.

2. Calculate the variables

Recency, frequency, value, average order value, channels. Decide the reference period: twelve or twenty-four months, depending on how often people buy in your category.

3. Find the groups, and validate them

Whether they’re RFM scores or clusters, check that the groups are genuinely different from each other and stable: if they change a lot when you rerun the calculation, they aren’t real groups.

4. Measure who you’re losing

For each customer, how far behind their usual purchase rhythm they are: a customer who buys every month and has been silent for three is more at risk than one who buys once a year and has been silent for six. Add up the value of those slipping away: that’s the value at risk.

5. A plan for each group

Retain, grow, win back, let go. Each group has its own objective, channels and metrics.

An example. “Caffè Ronda,” a fictional coffee roaster that sells online, segments 8,000 customers. Five groups emerge; the most valuable are long-standing subscribers with a high order value, but one in five is behind their usual reorder rhythm. The plan for that group: a personal touchpoint and a trial of the new blends, before any discount.

The most common mistakes

  • Demographic segments passed off as behavioral ones. Age doesn’t tell you who’s stopping buying.
  • The same period for every category. Ninety days of silence is a lot for coffee, not much for a sofa.
  • Too many groups. If you can’t give each one a different plan, there are too many.
  • The average customer. An average doesn’t exist: better the real customer who best represents the group.
  • Personal data where it isn’t needed. Behaviors and values are enough to segment: emails and names need protecting.
How MAPS does it

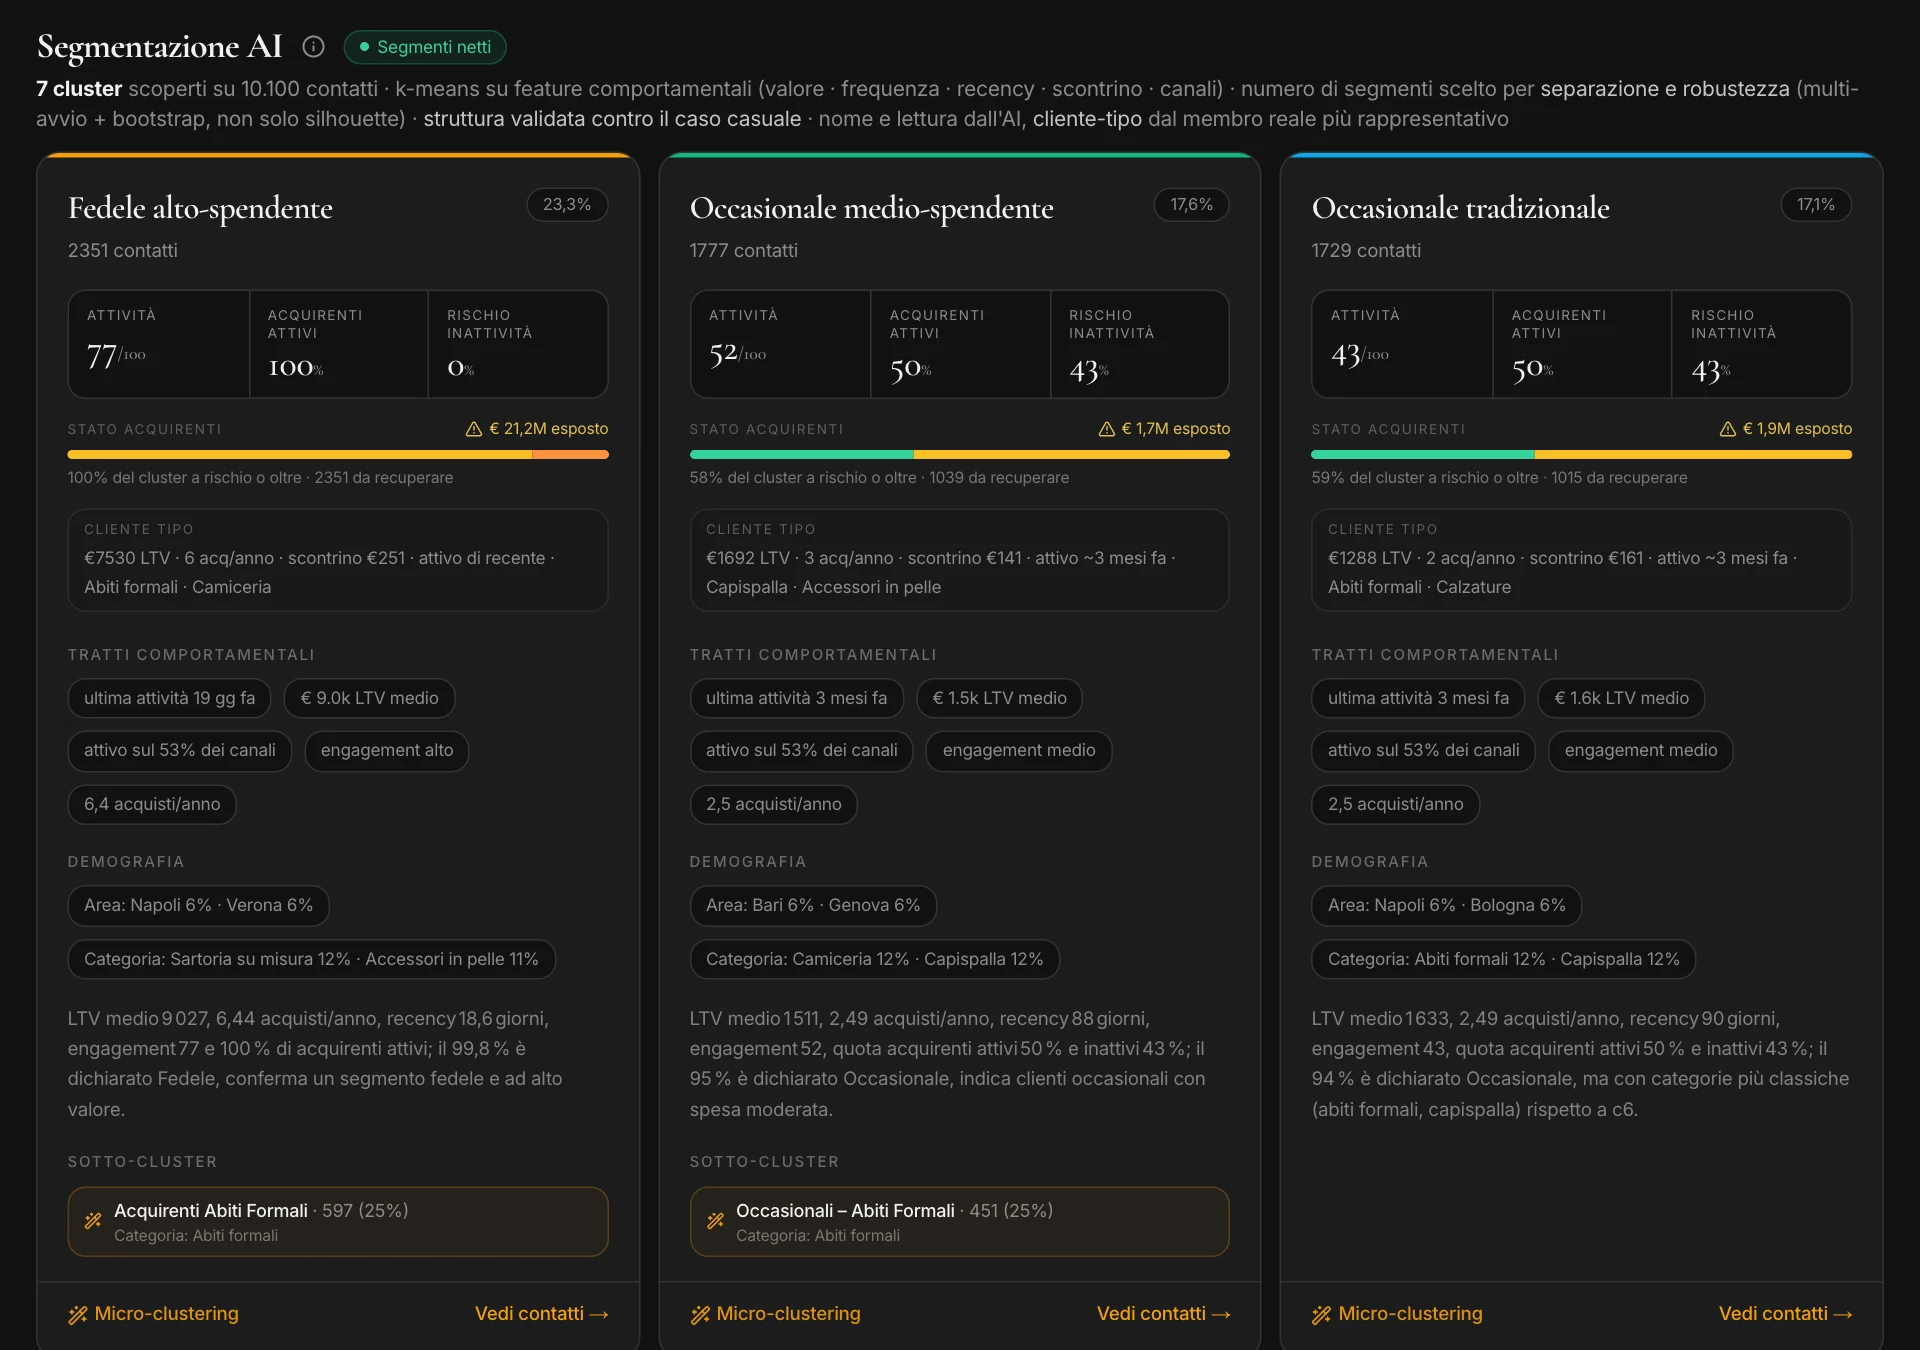
In MAPS, CRM Clustering brings in data from a file (CSV or Excel, up to 100,000 contacts), from the orders file, directly from HubSpot, or by merging several databases into a single customer view. It groups customers by how they behave — value, frequency, how long ago they bought, order value, channels used —, chooses how many groups to make by looking at how well separated and how stable they are, and tests the result against chance: if the customer base is homogeneous, it says so. For each customer it measures how far behind their purchase rhythm they are (active, at risk, dormant, lost) and the value at risk; the typical customer is the real customer who best represents the group. With orders, it adds categories at risk, cross-sell and seasonality. For each group: a synthetic persona to interview in Prove and an action plan, which “Move to Campaign” turns into a campaign. Contacts never reach the AI: only aggregate numbers, with emails pseudonymized.

Three of the seven groups: activity, active buyers, inactivity risk, value at risk, typical customer, traits, demographics, sub-clusters

Frequently asked questions

What does RFM stand for?

Recency, Frequency, Monetary: how long ago the customer bought, how often and how much they spend. They’re the three variables most commonly used to segment customers by purchase behavior.

What’s the difference between RFM analysis and clustering?

RFM assigns scores with thresholds set in advance; clustering finds the groups that emerge from the data, and can also use other variables such as order value and channels.

How many customer segments should you create?

As many as you can manage with different plans, and only if they’re genuinely distinct and stable. Usually between four and eight.

How do you tell which customers you’re losing?

By comparing the time since the last purchase with each customer’s usual rhythm: someone far behind their own rhythm is at risk, even if in absolute terms they haven’t been silent for long.

Written by the MAPS editorial team with the help of AI, checked and reviewed by the team.

Related articles
AI & Marketing·9 min di lettura

Synthetic users: what they are and how to use them to test an idea

Simulated people built on a market’s data: what they can tell you, what they can’t, how to interview them without fooling yourself, and when you still need the real customer.

Read →
Data & Measurement·10 min di lettura

From click to customer: measuring the return on digital spend

Cost per click, cost per lead, cost per customer: why the cheapest lead isn’t the cheapest customer, what happens after the click, and how to read attribution without fooling yourself.

Read →
Strategic Tools·10 min di lettura

Customer Journey Map: how to build it channel by channel

Stages, touchpoints, emotions and critical moments of the buying journey: why a journey per channel is worth more than a generic one, and how to use it to decide where to act.

Read →