
MAPS Intelligence
Resources/Data & Measurement
Data & Measurement · 10 min read

From click to customer: measuring the return on digital spend

Cost per click, cost per lead, cost per customer: why the cheapest lead isn’t the cheapest customer, what happens after the click, and how to read attribution without fooling yourself.

Updated October 6, 2026 · MAPS editorial team
In brief

Measuring the return on digital spend means following the chain spend → click → landing on the site → lead → customer, and not stopping at the platforms’ metrics. Cost per lead tells you what a contact costs; cost per customer what a purchase or a won deal costs. The two rankings often don’t match: the cheapest lead isn’t the cheapest customer.

The metrics in the chain

  • CPM — cost per thousand impressions.
  • CTR — percentage of impressions that become clicks.
  • CPC — cost per click.
  • Conversion rate — percentage of clicks (or visits) that turn into a result.
  • CPA or CPL — cost per action or per lead. CPA = CPC ÷ conversion rate: if CPA rises, the cause is the cost of the click, conversion, or both.
  • Cost per customer — spend divided by actual customers, from the CRM.

The stretch the platforms can’t see

Between click and lead sits the website. Two opposite problems produce the same symptom — few leads —: people who click and never arrive (often tracking parameters lost in a redirect, or slow pages), and people who arrive and don’t convert (the page doesn’t deliver on the ad’s promise). Telling them apart takes the site’s analytics data, not just the platform’s.

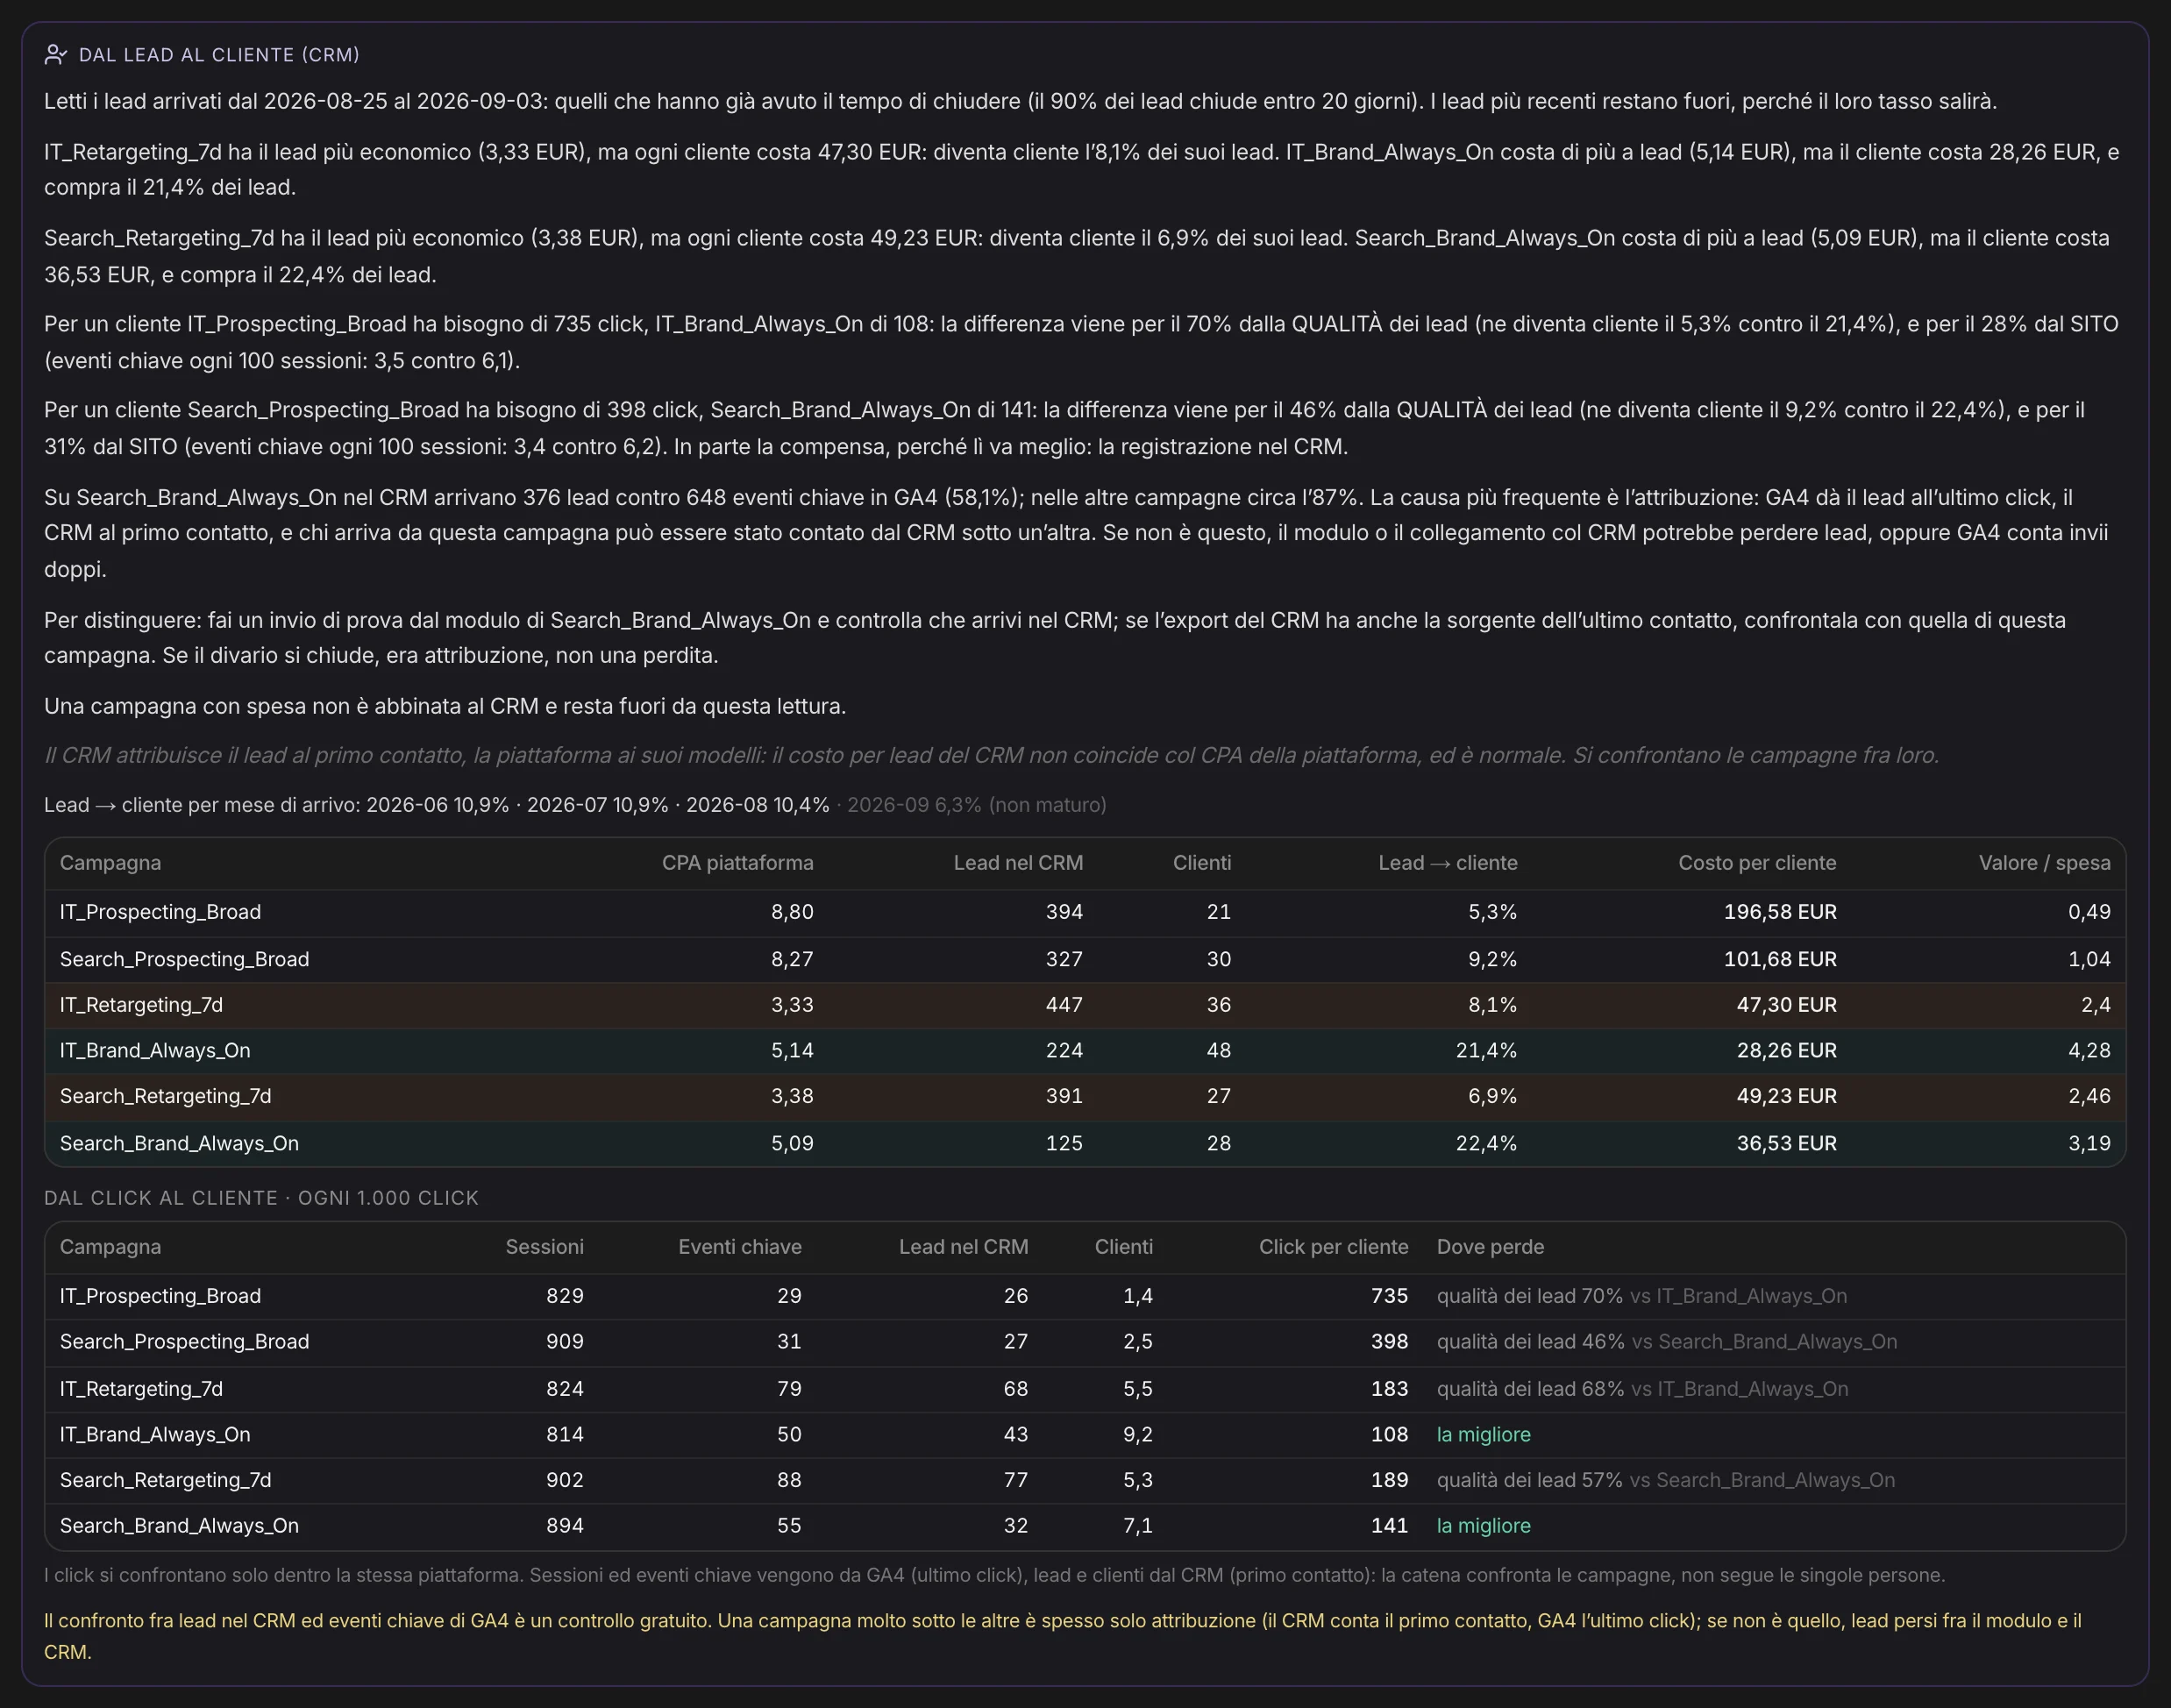
Between lead and customer sits the CRM. One campaign can bring in lots of cheap leads that never buy, and another a few expensive leads that become customers. Optimizing on cost per lead would cut the second.

Attribution, without fooling yourself

Every platform tends to claim the conversion for itself: adding up the results reported by several platforms often gives you more than the real total. Attribution models — last click, first click, linear, data-driven — distribute credit in different ways, and none of them is “the truth.” Two practical rules: compare campaigns counted the same way, and treat associations as associations, not causes.

How to do it

1. Bring the sources together

Ad platform exports, site analytics data, outcomes from the CRM. Recalculate CTR, CPC and CPM from the base data: every platform rounds them its own way.

2. When a cost changes, decompose it

How much comes from the cost of the click, how much from conversion, how much from budget shifting between campaigns. And define a threshold below which a change is noise.

3. Follow the post-click

For each campaign: how many clicks reach the site, how many of those convert, and on which pages people drop off.

4. Go all the way to the customer, with mature cohorts

Calculate cost per customer only on leads that have had time to close: last week’s leads haven’t had a chance to become customers yet, and they drag the rate down misleadingly.

5. A few moves, with verification

What to change first, why, and how to tell whether it worked.

An example. “Scuola Nautica Levante,” a fictional sailing school, runs two campaigns. The first brings leads at €12, the second at €30. From the CRM: the first turns one lead in forty into an enrolled student, the second one in eight. Cost per enrollment is €480 versus €240: the “expensive” campaign is the one that pays off.

The most common mistakes

  • Optimizing on cost per lead. You reward the campaigns that bring contacts, not customers.
  • Adding up the conversions the platforms report. The same customer gets counted several times.
  • Comparing platforms that count differently. A click on one platform isn’t always a click on another.
  • Cohorts that are too recent. New leads haven’t closed yet.
  • Reacting to noise. Small week-to-week changes aren’t a signal.
How MAPS does it

In MAPS, Web Investment brings together exports from Meta, Google, TikTok and LinkedIn, GA4 and outcomes from the CRM — from a file or directly from HubSpot, reading only dates, status, source and value: emails and names are never requested. MAPS recognizes the columns of each export and remembers the mapping; CTR, CPC and CPM are recalculated from the base data; if two platforms count clicks differently, it says so. When cost per result moves, it decomposes it — cost of the click, conversion, budget distribution — and below 5% it says it’s noise. With GA4 it separates those who click and don’t arrive from those who arrive and don’t convert. With CRM outcomes it calculates cost per customer campaign by campaign, only on leads that have had time to close. Then at most three moves, with a way to verify them, and a chat that answers only about the numbers on screen.

From lead to customer: cost per customer by campaign, and the chain from click to customer

Frequently asked questions

What’s the difference between cost per lead and cost per customer?

Cost per lead is spend divided by the contacts generated; cost per customer is spend divided by those who actually bought or signed. Only the second tells you which campaign pays off.

Why don’t platform conversions match sales?

Because each platform counts by its own rules and tends to claim the conversion for itself: add them up and the same customer gets counted several times.

How do you calculate CPA?

Spend divided by the number of actions (or leads). It’s equivalent to cost per click divided by conversion rate: that’s why a rising CPA can always be explained by one of the two, or both.

Which attribution model should you use?

None is perfect. What matters is using one consistently over time, comparing campaigns counted the same way, and checking results against CRM data.

Written by the MAPS editorial team with the help of AI, checked and reviewed by the team.

Related articles
Data & Measurement·10 min di lettura

Customer segmentation from the CRM: RFM analysis and clusters

How recently, how often, how much: how RFM analysis and clustering find the customer groups that really exist, who you’re losing, and what to do with each.

Read →
Data & Measurement·9 min di lettura

Media planning: media mix, seasonality and category benchmarks

How to spread an advertising budget across media and months, starting from what your category does: competitor spend, open windows, objectives and scenarios.

Read →
Glossary·10 min di lettura

Glossary of digital and performance marketing

Digital metrics, channels and concepts — from CPM to ROAS, from SEO to GEO — explained simply.

Read →