
The comparison,
with the data you already have.
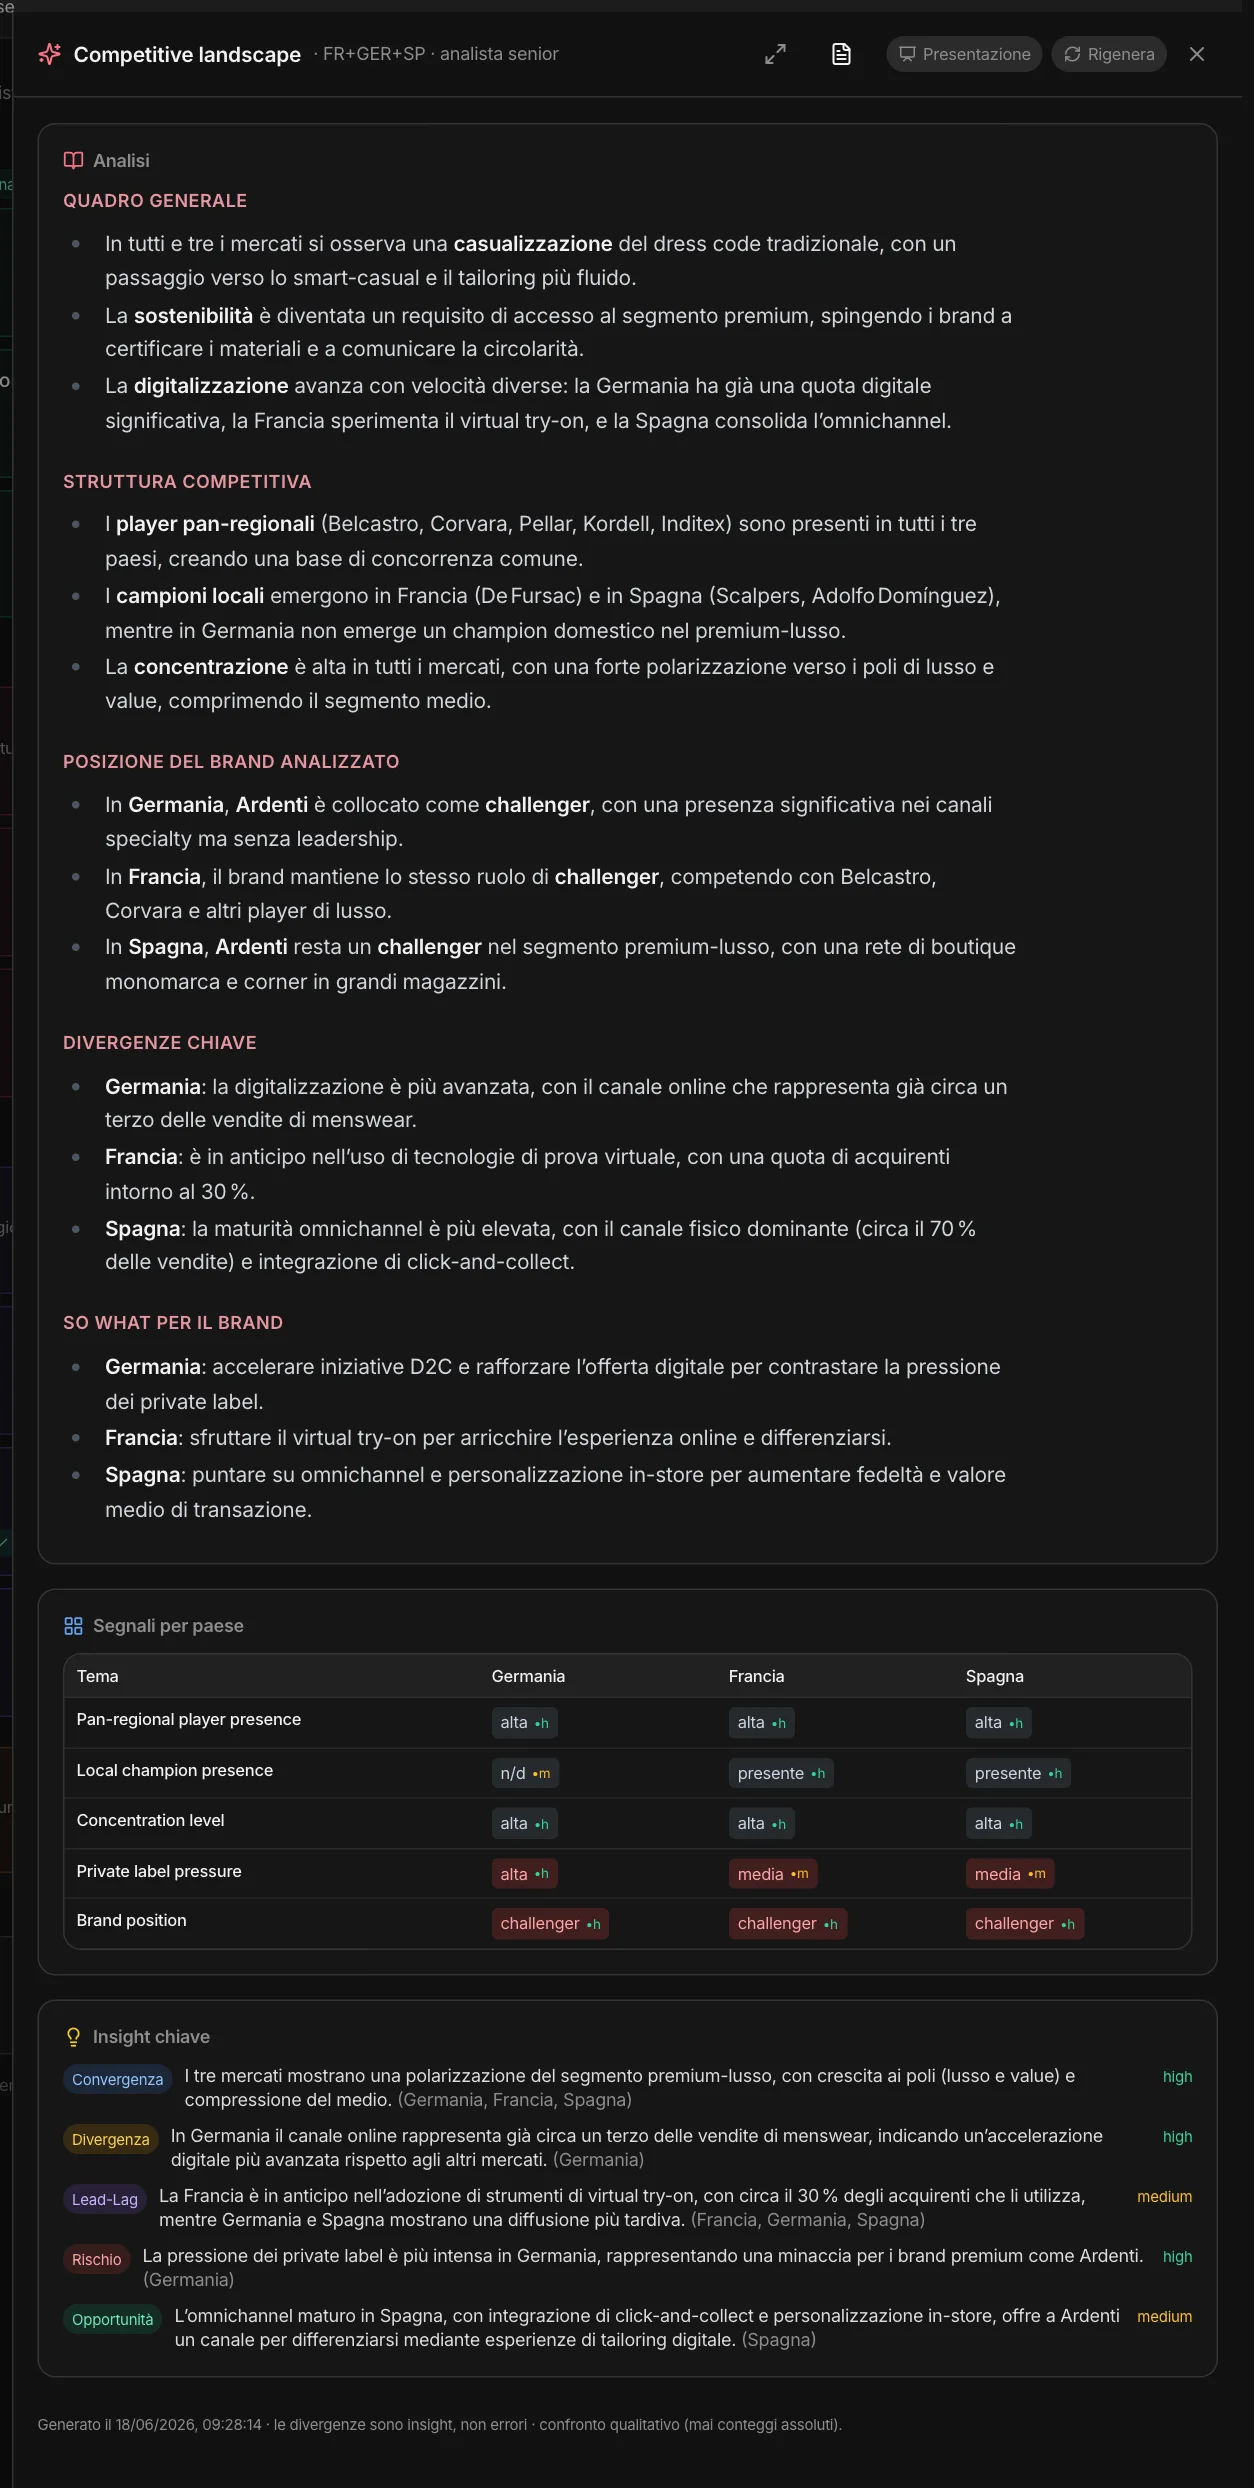
The syntheses don’t search for anything new: they read the research each country project has already done and compare it. Nine reads, each with its own lens — the trend radar starts from each country’s social listening, comparative pricing from the price analyses, and so on.
In a region the columns are the countries. You need at least two country projects with that module: if one is missing, the panel tells you which.
Where each one
comes from.
Each synthesis starts from a specific module in the country projects.
Market context
Company profile and market landscape: size, growth, maturity, structure.
Trend radar
From social listening: the signals emerging country by country.
Consumer convergence
From Consumer Focus: the shared segments and the local ones.
Competitive landscape
From Competition Focus and market shares: pan-regional and local players.
Comparative pricing
From the price analyses: positioning and elasticity.
Innovation lead-lag
From innovation trends: who anticipates what.
Comparative portfolio
From the portfolio: the regional core and the local gaps.
Comparative communication
From advertising and Communication Focus: message territories and media mix.
Comparative distribution
From distribution channels: structure and retail banners across countries.
Areas
made of areas.
On a macro-area the columns become the sub-areas, and each one brings its own position: the synthesis already done in the cluster, the project’s data if it’s a Big Country, the Quick Overview if it’s a country without a project. The comparison is made between comparable units — Italy, the United Kingdom, the three-country cluster.
If a sub-area doesn’t have that read yet, it stays out and the panel says so: you generate it there and regenerate here. And if the countries or the upstream data change after generation, a notice tells you to regenerate.
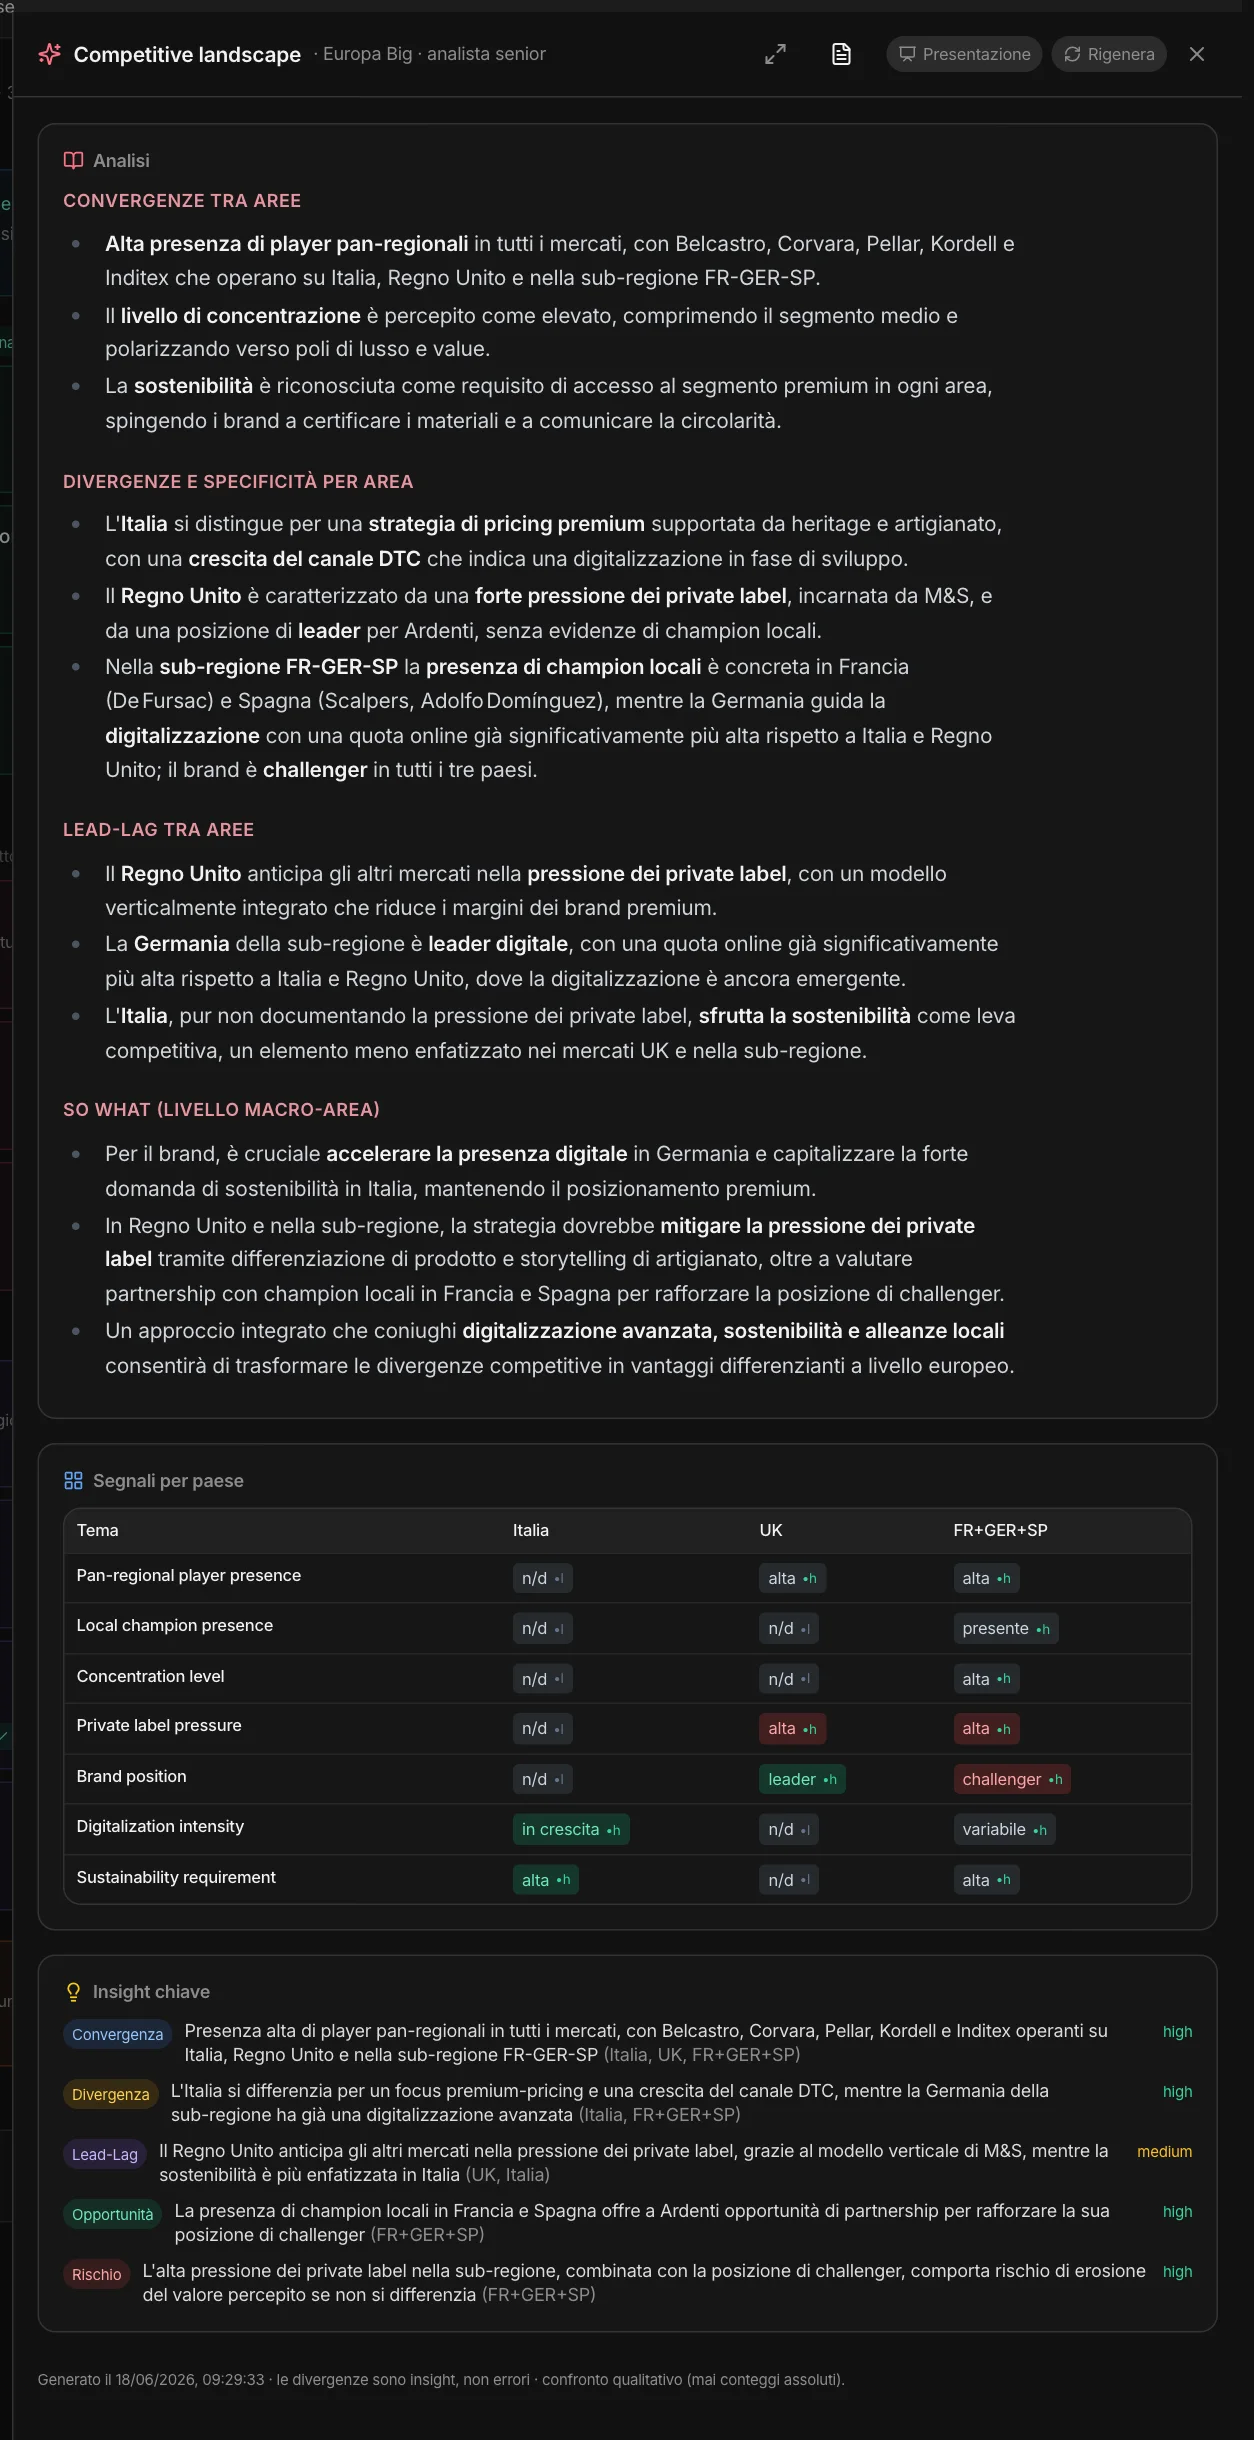
Syntheses come out in the team’s working language and go into the area’s memory. They can be regenerated, have their own versions, and export to PDF or to a presentation.